
Research article · 2022 · Full text
International Journal of Geography Geology and EnvironmentCorrelation between caste-based female literacy and child sex ratio in Alipurduar district of West Bengal
Volume 4(2) · Pages 52–59 · DOI: 10.22271/27067483.2022.v4.i2a.117 ↗
Research areasSocial and Economic Development in IndiaDemographic Trends and Gender PreferencesPoverty, Education, and Child Welfare
Abstract
Author-writtenThe present paper examines the correlation between the caste-based female literacy rate and child sex ratio in the Alipurduar District of West Bengal in 2011. The study is secondary data based which is collected from the Census of India. The study aims to analyze the spatial pattern of female literacy rate and child sex ratio and to find out the correlation between the caste-based female literacy rate and child sex ratio in Alipurduar District. Pearson’s correlation method is used to identify the correlation between female literacy rate and child sex ratio. The result of the study reveals that there is a wide disparity in the spatial distribution of caste-based female literacy rate and child sex ratio in the Alipurduar district. The study shows that the correlation between the caste-based female literacy rate and the child sex ratio is not equal. Correlation is positive in the case of General Caste but negative for both the Scheduled Caste and Scheduled Tribe in Alipurduar District. The study also highlights that the correlation between the Scheduled Caste female literacy rate and child sex ratio is significant at the 95 percent level.
Summary
Source-checkedPlain-language reading of the full paper, prepared with AI and checked against the text. Each point links to the authors' own words.
Why it matters
- Female literacy is considered a critical characteristic of society because it drives social progress. View evidence ↗
- Improving female literacy is believed to play a vital role in improving the child sex ratio. View evidence ↗
- While some research exists on female literacy and child sex ratio in West Bengal, there is a gap in research specifically focusing on caste-based literacy. View evidence ↗
The question
- The study aims to analyze the spatial patterns and the correlation between caste-based female literacy rates and the child sex ratio in the Alipurduar District. View evidence ↗
What they did
- The research utilized secondary data obtained from the Census of India. View evidence ↗
- Pearson's correlation method was employed to determine the relationship between female literacy and the child sex ratio. View evidence ↗
- The study area, Alipurduar District, was analyzed across its six blocks: Madarihat, Kalchini, Kumargram, Alipurduar-I, Alipurduar-II, and Falakata. View evidence ↗
What they found
- For the General Caste, there is a low positive correlation (r = 0.072) between female literacy and the child sex ratio, which is not statistically significant. View evidence ↗
- The Scheduled Caste (SC) group showed a high negative correlation (r = -0.809) between female literacy and the child sex ratio, which is significant at the 95% confidence level. View evidence ↗
- The Scheduled Tribe (ST) group exhibited a low negative correlation (r = -0.262) between female literacy and the child sex ratio, which was not statistically significant. View evidence ↗
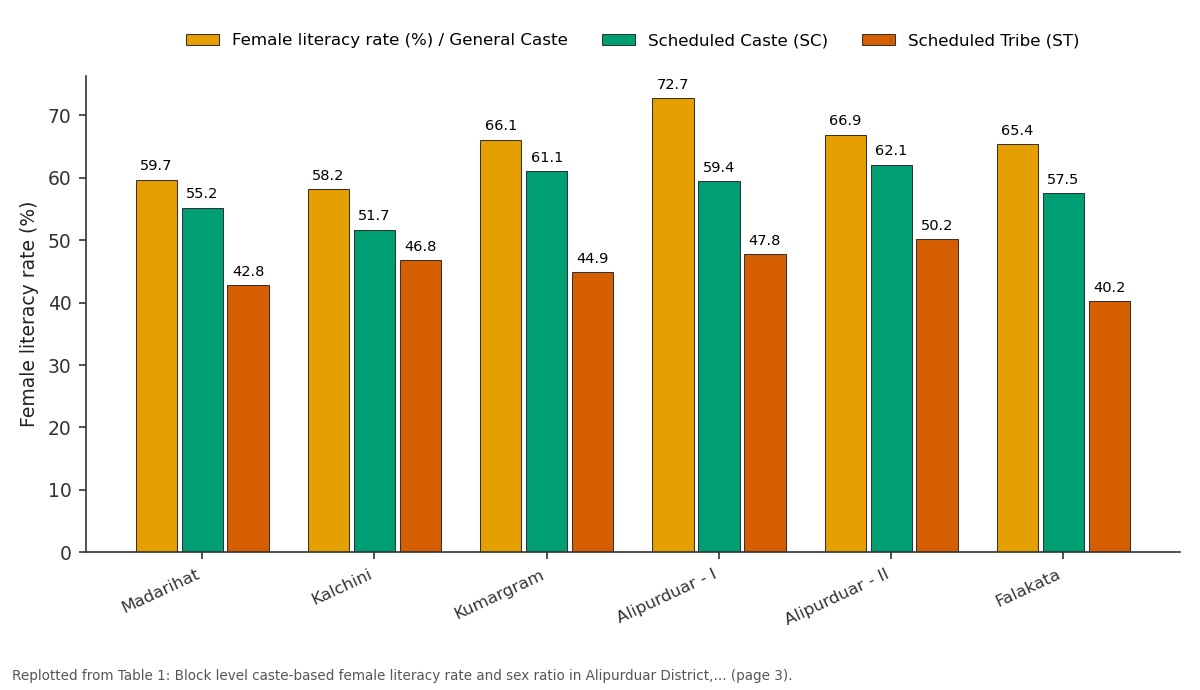
- In 2011, the Alipurduar-II block recorded the highest female literacy rates across all studied caste groups. View evidence ↗
- The Madarihat block had a high child sex ratio for all caste groups in 2011. View evidence ↗
What it means
- The authors conclude that providing equal opportunities regardless of caste or class is necessary to achieve social equality and eliminate gender discrimination. View evidence ↗
Visual summary
2 visualsIllustrations explain the paper; charts are replotted from the paper's own table values.
Female literacy rate (%) / General Caste and Scheduled Caste (SC) and more: Madarihat vs Kalchini vs Kumargram vs Alipurduar - I vs Alipurduar - II
Replotted from Table 1 (page 3) of the original paper. Every bar is the paper's own table value.
View source evidence ↗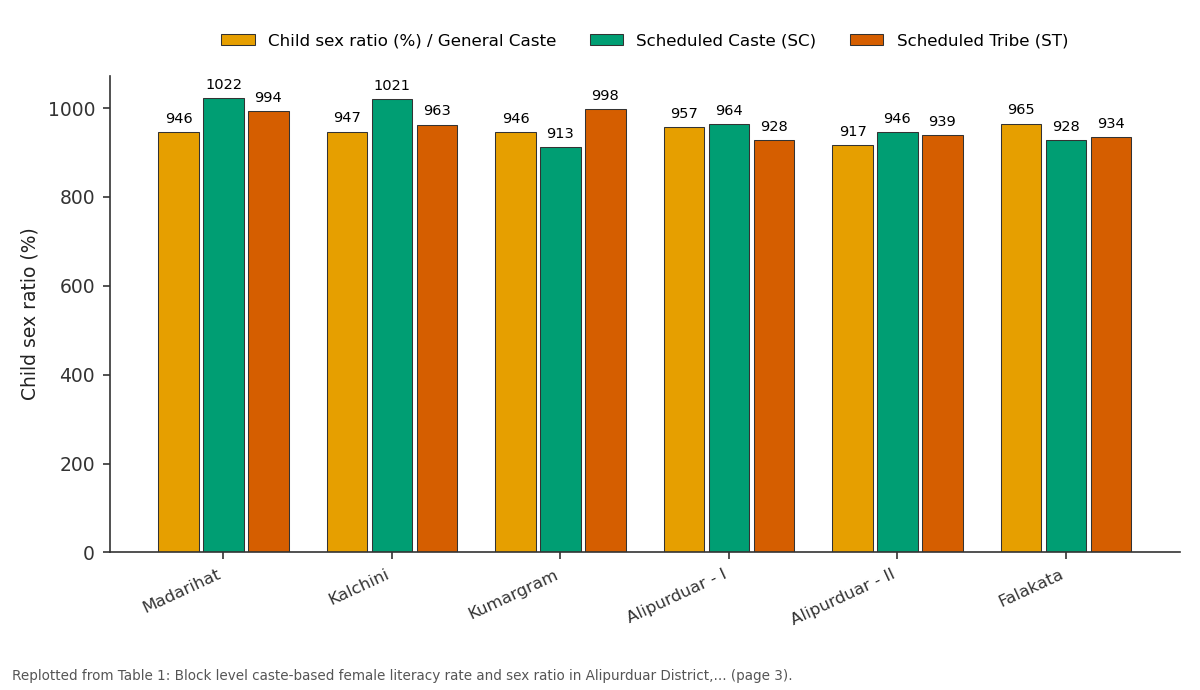
Child sex ratio (%) / General Caste and Scheduled Caste (SC) and more: Madarihat vs Kalchini vs Kumargram vs Alipurduar - I vs Alipurduar - II
Replotted from Table 1 (page 3) of the original paper. Every bar is the paper's own table value.
View source evidence ↗Figures & tables
From the original paper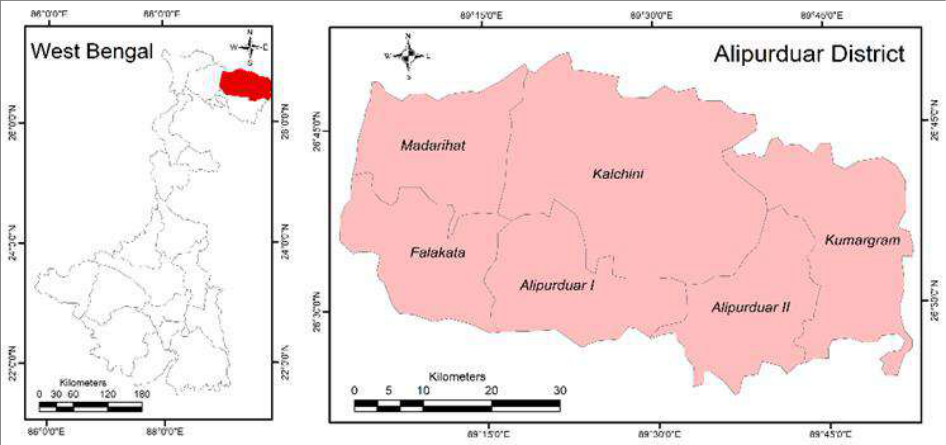 Figure 1
 Table 1
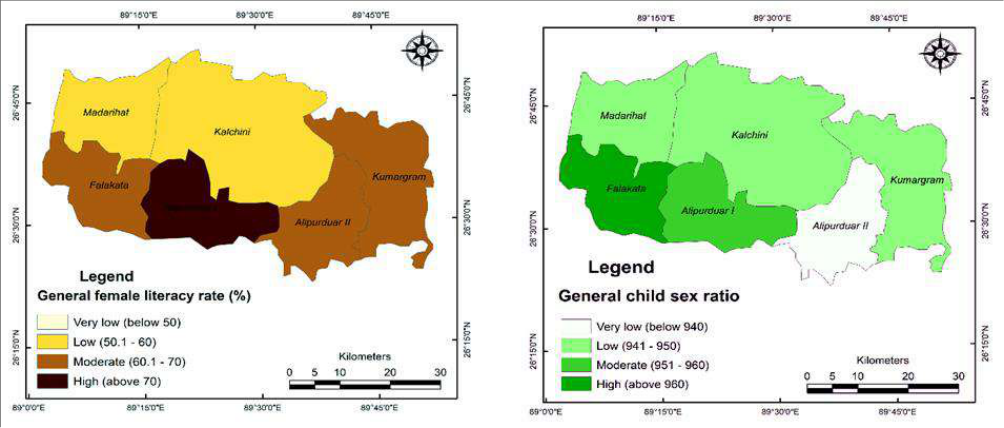 Figure 2
 Table 2
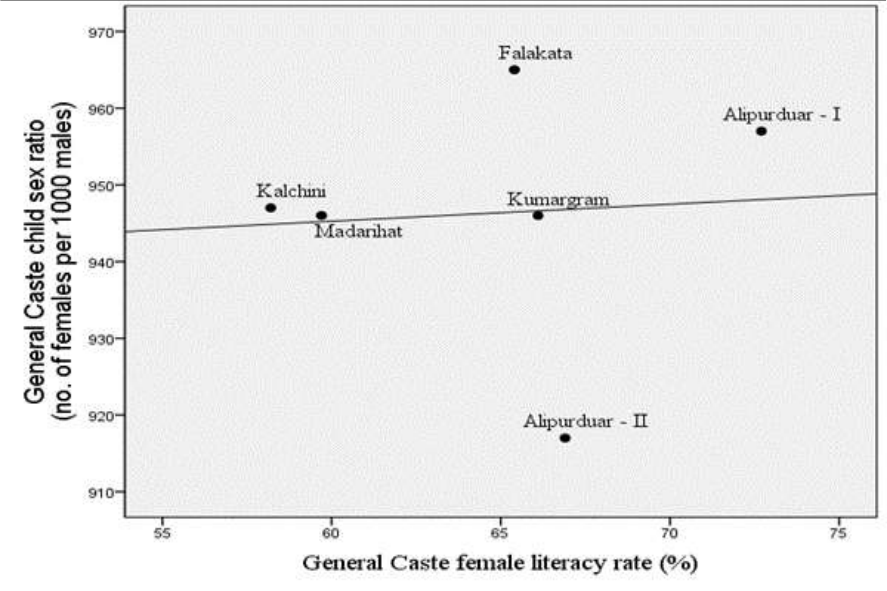 Figure 3
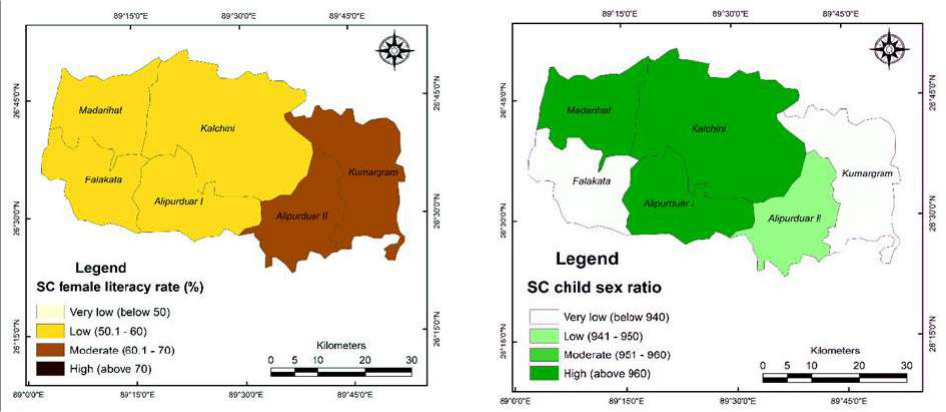 Figure 4
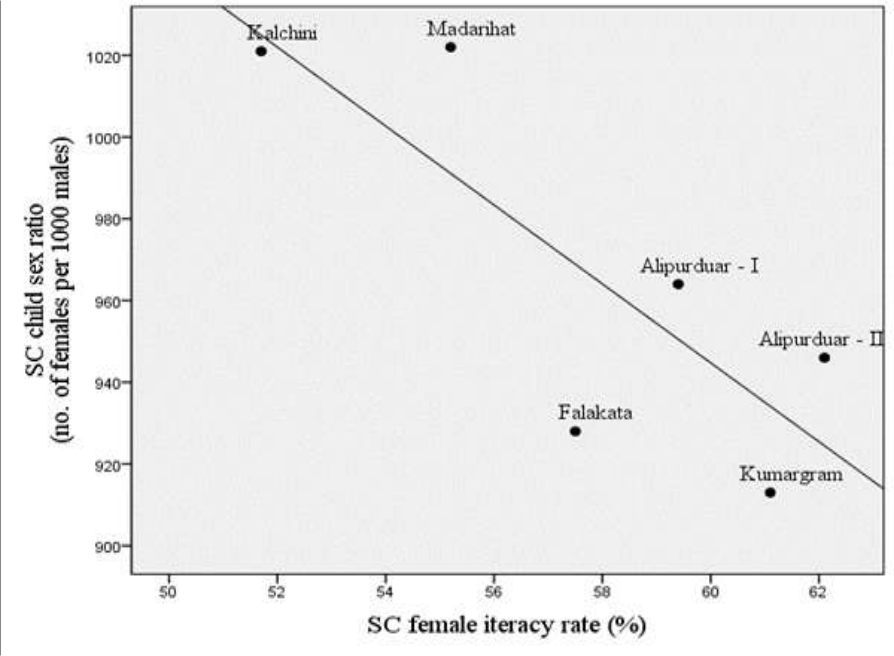 Figure 5
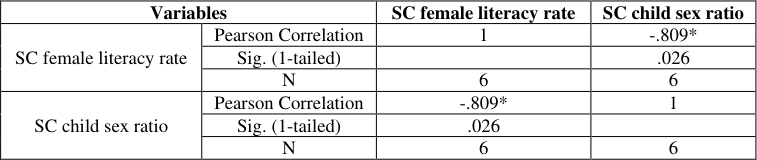 Table 3
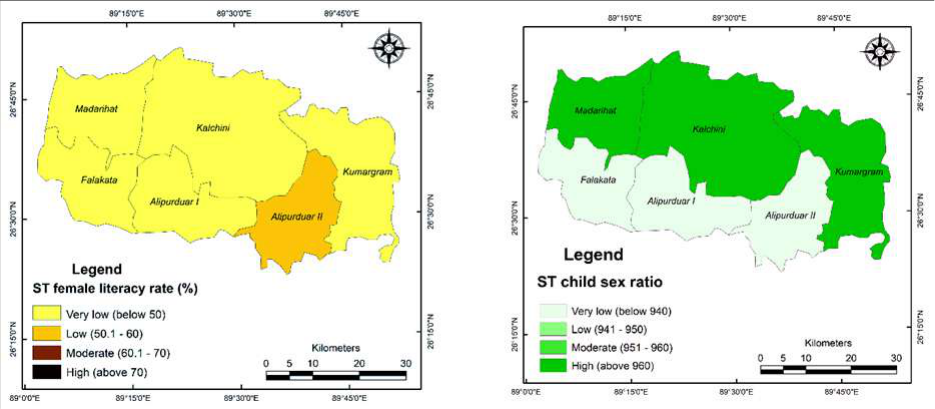 Figure 6
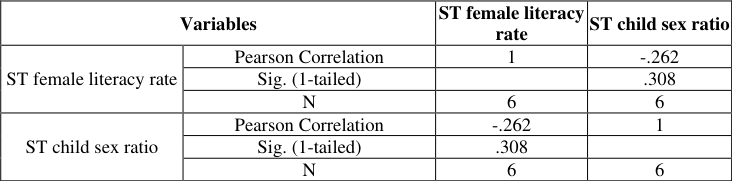 Table 4
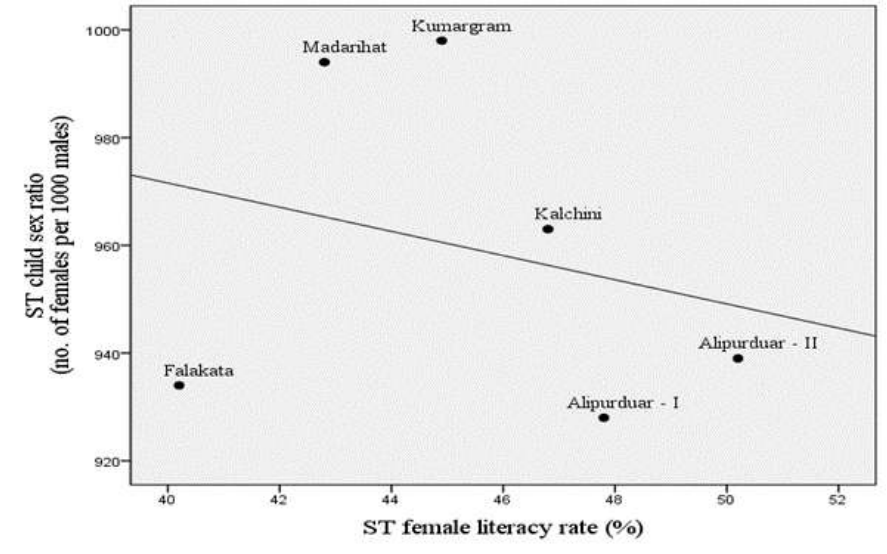 Figure 7
Introduction
Literacy is the first step of learning and knowledge building. It is an important quality of civilization such as modernization, urbanization, and industrialization (Kumari, 2017) [4] . Female Literacy is probably the most enabling tool and weapon in the arsenal of democracy (Shetty & Shetty, 2014) [2] . Female literacy is one of the most important characteristics of any society as they improve social progress. According to the 2011 census report, India's female literacy rate is 65.5 percent. Female literacy is highest in Kerala and lowest in Rajasthan. There is a wide disparity in female literacy from state to state in India. Female literacy rate is higher in Kerala (92%), Mizoram (89.4%), Tripura (83.1%), Goa (81.8%), Himachal Pradesh (76.6%), Nagaland (76.7%) and Maharashtra (75.5%), while very low in Rajasthan (52.7%), Bihar (53.3%), Jharkhand (56.2%), Telangana (57.9%), Uttar Pradesh (59.3%), Arunachal Pradesh (59.6%) and Andhra Pradesh (60%). According to the 2011 census, the female literacy rate in West Bengal is 70.5%. The highest female literacy rate is found in Kolkata District (85%) and the lowest in Purulia District (51.3%). Child sex ratio is an important aspect of population studies. The child sex ratio is defined as the number of female's population below six years of age per 1000 male's population below six years of age. According to the 2011 census report, India's child sex ratio is 919. The child sex ratio is highest in Arunachal Pradesh (972) and lowest in Haryana (834). There is a wide disparity in child sex ratio from state to state in India. Child sex ratio is higher in Arunachal Pradesh (972), Mizoram (970), Meghalaya (970), Chhattisgarh (969) and Kerala (964), while very low in Haryana (834), Punjab (846), Rajasthan (888) and Gujarat (890). As per the 2011 census, the child sex ratio in West Bengal is 956, which is much higher than the national average. The highest child sex ratio is found in Howrah District (964) and the lowest in Kolkata District (930). Higher female literacy leads to increase consciousness and also contribute to improving social status. There is a correlation between female literacy and child sex ratio. Female literacy plays a crucial role in the upliftment of the child sex ratio. Therefore, the study of the correlation between female literacy and child sex ratio has become an important topic.
Important research works on the relationship between female literacy and child sex ratio have been carried out by various scholars like Monu Kumar (Kumar, 2013) [1] did important research work on the correlation between female literacy and child sex ratio in Haryana by using census data 2011 based on Spearman's Rank Difference method. Anil Shetty and Shraddha Shetty (Shetty & Shetty, 2014) [2] conducted a study on the influence of female literacy on the sex ratio in Indian states by using the census data from 1981 to 2011. T. P. Shinde (Shinde, 2015) [3] examined the correlation between female literacy and child sex ratio in the Satara District of Maharashtra based on primary and secondary data. Bharat Parveen Kumari (Kumari, 2017) [4] conducted a study on the relationship between female literacy and child sex ratio in Haryana by using census data in 2011. Lalit Singh Jhala (Jhala, 2019) [5] also did research work on the impact of female literacy on the child sex ratio in Rajasthan by using Spearman's Rank Difference method. Surender Kumar and Amir Singh (Kumar & Singh, 2019) [6] investigated the correlation between female literacy rate and sex ratio through a case study of all districts of the state of Haryana based on census data in 2011. Shahid Imam (Imam, 2020) [7] analyzed the district level female literacy and changes in child sex ratio in Bihar, and T.V. Krishna, S. Rama Krishna and A. Raju (Krishna et al. 2020) [8] did research work on the changes and correlation between literacy rate and sex ratio of a backward region of Northern Vizianagaram District in Andhra Pradesh by using the Spearman's rank order method. Based on the literature review it can say that only a few research works have been done on the relationship between female literacy and child sex ratio in West Bengal. Still, the relationship between caste-based female literacy and child sex ratio has been not done. Thus, the present research work tries to study the relationship between caste-based female literacy and child sex ratio in the Alipurduar District of West Bengal. The Person correlation method by IBM SPSS Statistics 23 software is used for analyzes the correlation between castebased female literacy rate and child sex ratio. Furthermore, ArcGIS 10.3 is used for preparing maps.
Objectives
Objectives
Result and Discussion
Result and Discussion
Spatial pattern of the General Caste female literacy rate and child sex ratio in Alipurduar District, 2011
The General Caste female literacy rate in Alipurduar District is 64 percent and the General Caste child sex ratio is 947 in the census year 2011. But the block level General Caste female literacy rate or General Caste child sex ratio differs from block to block.
Spatial pattern of the Scheduled Caste (SC) female literacy rate and child sex ratio in Alipurduar District, 2011
The Scheduled Caste female literacy rate in Alipurduar District is 58.9 percent and the Scheduled Caste child sex ratio is 950 in the census year 2011. But the block level Scheduled Caste female literacy rate or Scheduled Caste child sex ratio differs from block to block. Table - The Pearson correlation method is used to find out the relationship between two variables. It is identified that the correlation (r) between the SC female literacy rate and sex ratio is -0.809 and the correlation is significant at 95% level of confidence. It is a high negative correlation, which means that there is a high inverse relationship between the SC female literacy rate and SC child sex ratio of Alipurduar District in the census year 2011. The high negative relationship indicates that an increase in SC female literacy rate leads to a decrease in SC child sex ratio and a decrease in SC female literacy leads to an increase in SC child sex ratio. While comparing the SC female literacy rate and SC child sex ratio of Alipurduar District in 2011 (figure-4 and 5), it is observed that blocks with high SC female literacy rates have lower child sex ratios, and blocks with low SC female literacy rates have higher child sex ratios. For example, in the Alipurduar-II block, SC female literacy rate is the highest (62.2%) but the sex ratio is the third lowest (946).
On the other hand, in the Kalchini block, the SC female literacy rate is the lowest (48%) but the sex ratio is the second highest (1021). The Pearson correlation method is used to detect the relationship between two variables. It is identified that the correlation (r) between the ST female literacy rate and ST Child sex ratio is -0.262 and the correlation is not significant. It is a low negative correlation, which means that there is an inverse relationship between ST female literacy rate and ST Child sex ratio of Alipurduar District in the census year 2011. The low negative relationship indicates that an increase in ST female literacy rate leads to a decrease in ST Child sex ratio and a decrease in ST female literacy rate leads to an increase in ST Child sex ratio. While comparing the ST female literacy rate and ST child sex ratio of Alipurduar District in 2011 (figures-6 and 7), it is noticed that the blocks with high ST female literacy rates have lower ST child sex ratios and blocks with low ST female literacy rates have higher ST child sex ratios. For example, the Alipurduar-II block has the highest (50.2%) ST female literacy rate but the second lowest in the ST Child sex ratio (939). On the other hand, the literacy rate of the Madarihat block is the second lowest (42.8%) but the ST Child sex ratio of the block is the second highest (994).
Conclusion
Literacy rate and sex ratio are one of the most considerable components of social development. The study is mainly focused on investigating the spatial pattern of caste-based female literacy rate and child sex ratio and identifying the caste-based correlation between female literacy rate and child sex ratio in Alipurduar District by using the census data of 2011. The study shows that the block level castebased female literacy rate and child sex ratio is irregularly distributed in Alipurduar District. The study represents that General Caste female literacy and child sex ratio are low positively correlated. The study also highlights that there is a significant negative correlation between the Schedule Caste female literacy rate and child sex ratio, but not significant in the case of Schedule Tribe in Alipurduar District. In conclusion, it can be said that equal opportunity is needed for improving our society irrespective of every caste and class to establish social equality as well as eradication of gender discrimination.
Acknowledgement
6. Kumar S, Singh A. Correlation between female literacy rate and sex ratio in Haryana (2011), India. International Journal of Multidisciplinary Research and Development. 2020;7(1):138-141. 7. Imam S. Female Literacy and Changes in Child Sex Ratio in Bihar: A District Level Analysis. International Journal of Science and Research (IJSR). 2021;10(9):1037-1047. 8. Krishna TV, Krishna SR, Raju A. Study on Changes and Correlation between Literacy Rate and Sex Ratio of a Backward Region of Northern Vizianagaram District, AP: A Geographical. International Journal of Research and Analytical Reviews (IJRAR). 2020;7(4):31-36.
Figures and tables from the paper
| Block name | Female literacy rate (%) | — | — | Child sex ratio (%) | — | — |
|---|---|---|---|---|---|---|
| General Caste | Scheduled Caste (SC) | Scheduled Tribe (ST) | General Caste | Scheduled Caste (SC) | Scheduled Tribe (ST) | |
| Madarihat | 59.7 | 55.2 | 42.8 | 946 | 1022 | 994 |
| Kalchini | 58.2 | 51.7 | 46.8 | 947 | 1021 | 963 |
| Kumargram | 66.1 | 61.1 | 44.9 | 946 | 913 | 998 |
| Alipurduar - I | 72.7 | 59.4 | 47.8 | 957 | 964 | 928 |
| Alipurduar - II | 66.9 | 62.1 | 50.2 | 917 | 946 | 939 |
| Falakata | 65.4 | 57.5 | 40.2 | 965 | 928 | 934 |
| District total | 64.0 | 58.9 | 45.3 | 947 | 950 | 965 |
Table text extracted from the original PDF; superscript letters are shown inline. The original table image is below.
View original table image
| Variables | — | General female literacy rate | General child sex ratio |
|---|---|---|---|
| General female literacy rate | Pearson Correlation | 1 | .072 |
| Sig. (1-tailed) | .446 | ||
| N | 6 | 6 | |
| General child sex ratio | Pearson Correlation | .072 | 1 |
| Sig. (1-tailed) | .446 | ||
| N | 6 | 6 |
Table text extracted from the original PDF; superscript letters are shown inline. The original table image is below.
View original table image
| Variables | — | SC female literacy rate | SC child sex ratio |
|---|---|---|---|
| SC female literacy rate | Pearson Correlation | 1 | -.809* |
| Sig. (1-tailed) | .026 | ||
| N | 6 | 6 | |
| SC child sex ratio | Pearson Correlation | -.809* | 1 |
| Sig. (1-tailed) | .026 | ||
| N | 6 | 6 |
Table text extracted from the original PDF; superscript letters are shown inline. The original table image is below.
View original table image
| Variables | — | ST female literacy rate | ST child sex ratio |
|---|---|---|---|
| ST female literacy rate | Pearson Correlation | 1 | -.262 |
| Sig. (1-tailed) | .308 | ||
| N | 6 | 6 | |
| ST child sex ratio | Pearson Correlation | -.262 | 1 |
| Sig. (1-tailed) | .308 | ||
| N | 6 | 6 |
Table text extracted from the original PDF; superscript letters are shown inline. The original table image is below.
View original table image
References
4 in the original paper- Kumar M. Correlation between Female Literacy and Child Sex Ratio in Haryana: A Geographical Analysis. International Journal of Advanced Research in Management and Social Sciences. 2013;2(10):65-73.
- Shetty A, Shetty S. The Influence of Female Literacy on the Sex Ratio in Indian States. International Journal of Medical Science and Public Health. 2014;3(10):1219-1224.
- Shinde TP. Correlation between Female Literacy and Child Sex Ratio in Satara District (Maharashtra): A Geographical Analysis. American International Journal of Research in Humanities, Arts and Social Sciences. 2015;13(1):71-73.
- Jhala LS. Impact of Female Literacy on Child Sex Ratio in Rajasthan. Transactions. 2019;14(2):235-244.
Cited by 1
From OpenAlex, OpenCitations and reference lists read by Scinovex
- The Correlation between Female Literacy and Juvenile Sex Ratio in Nashik District: A Geographical Perspective ↗
Dhanraj Kalu Ahire · South Asian Journal of Social Studies and Economics · 2024
The present investigation aims to examine the geographical analysis of the correlation between female literacy and the juvenile sex ratio in Nashik district. The study is primarily based on secondary data collected from Nashik district's 2011 population census handbooks. The present paper is a major analysis of the female literacy rate, the juvenile sex ratio pattern, and its correlation with…
❝ 0PDF