
Research article · 2022 · Full text
International Journal of Statistics and Applied MathematicsA hierarchical example of the method of c-rating for combat readiness assessment technique
Volume 7(6) · Pages 24–29 · DOI: 10.22271/maths.2022.v7.i6a.895 ↗
Research areasReliability and Maintenance OptimizationTechnology Assessment and ManagementRisk and Safety Analysis
Abstract
Author-writtenIn this paper we present a follow up to an earlier method of c-rating models for combat readiness assessment in which we reported on a new development of immense importance to readiness managers and decision markers. The method is a multi-dimensional approach for resolving readiness problem via subresources in which the state and factor are the cardinal concepts with a concomitant relationship. We demonstrate the applicability of the method by using a hypothetical yet typical example within a naval environment. A step-by-step process is followed to determine unreadiness and consequently the readiness of the fleet as shown on the c-scale.
Summary
Source-checkedPlain-language reading of the full paper, prepared with AI and checked against the text. Each point links to the authors' own words.
Why it matters
- Combat readiness is defined as the ability of military forces to execute the specific missions or functions they were designed for. View evidence ↗
- Achieving readiness requires organizing human and material resources into a specific, desirable state to meet a challenge. View evidence ↗
- Readiness is categorized into three types: perceived (based on perceived threats), expected (required for a specific task), and actual (the result of re-evaluating expected readiness when conflict is imminent). View evidence ↗
The question
- The study aims to demonstrate how the c-rating method can be applied to assess the combat readiness of military forces. View evidence ↗
What they did
- The assessment method uses two primary concepts: the 'ɸ state' (the static condition of a subresource) and the 'λ-factor' (the criticality of that subresource for a specific task). View evidence ↗
- The method is demonstrated using a hypothetical naval scenario involving a squadron of 15 frigates, where only 10 are required for a specific task. View evidence ↗
- Each ship in the example is evaluated based on 22 subresources divided into four areas: Operations, Logistics, Manpower, and Engineering. View evidence ↗
- To determine fleet readiness, the five ships with the highest unreadiness values are excluded, and the assessment focuses on the ten best-performing ships. View evidence ↗
What they found
- In the example scenario, subresources were categorized as 6 highly critical, 8 critical, 5 non-critical, and 3 inconsequential (ASP, REP.GR, and DNET). View evidence ↗
- Subresources identified as inconsequential are removed from the Readiness Matrix of Evaluation. View evidence ↗
- The ships were ranked by unreadiness, with F15 being the least unready and F7 being the most unready. View evidence ↗
- Based on the unreadiness rankings, ships F11, F13, F8, F10, and F7 were dropped from the task. View evidence ↗
- The calculated mean unreadiness for the required fleet was 0.282. View evidence ↗
What it means
- Based on the C-scale, the authors conclude that the example fleet is almost substantially ready for the assigned task. View evidence ↗
- The authors recommend that mission decisions be based on both the fleet's own readiness level and the perceived readiness level of the enemy. View evidence ↗
- A limitation of the decision process is that enemy readiness can never be known exactly and depends entirely on the accuracy of intelligence. View evidence ↗
Visual summary
2 visualsIllustrations explain the paper; charts are replotted from the paper's own table values.
Readiness Assessment Logic
AI-generated conceptual illustration (Military hardware and equipment). It explains the idea and does not show study data.
View source evidence ↗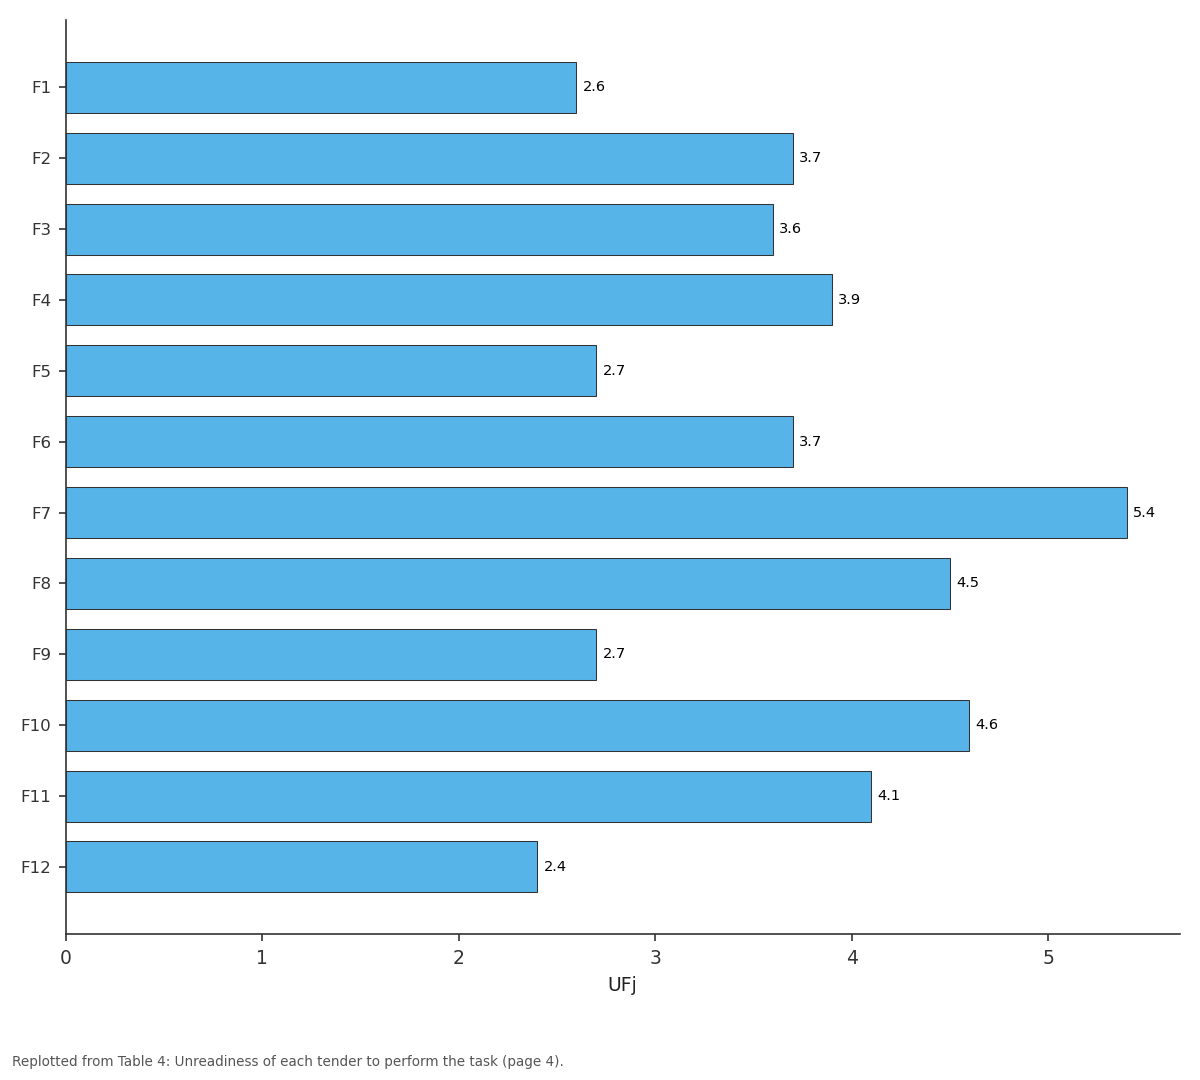
UFj: F1 vs F2 vs F3 vs F4 vs F5
Replotted from Table 4 (page 4) of the original paper. Every bar is the paper's own table value.
View source evidence ↗Figures & tables
From the original paper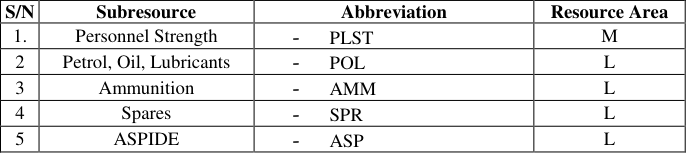 Table 1
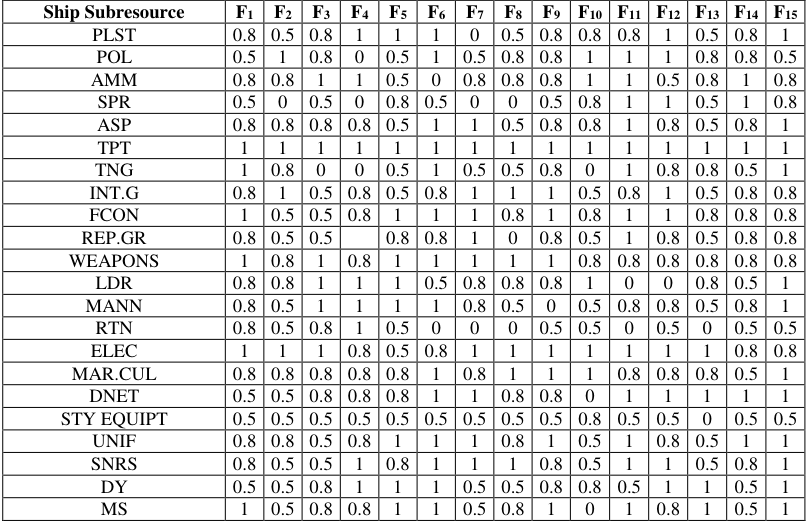 Table 2
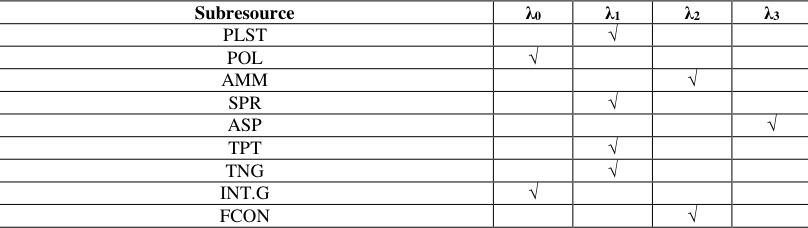 Table 3
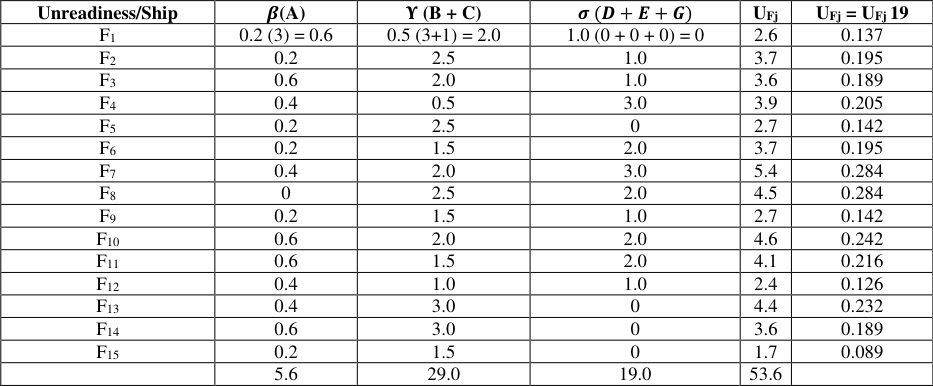 Table 4
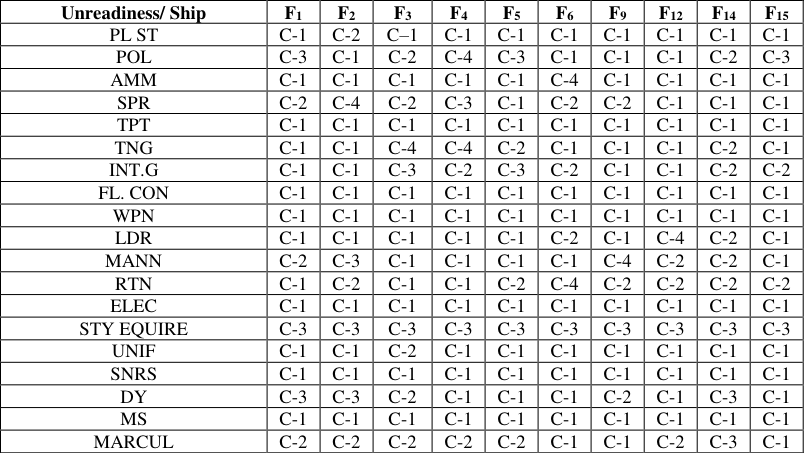 Table 5
Introduction
The concept of readiness suggests the existence of some phenomenon such as a challenge or event, which requires some resource(s) to meet. The phenomenon can be regarded as the process of assuming a posture to meet an activity or task or a mission. The posture to be attained is indeed the required state of the system to meet the challenge. The desired posture has to be assumed before engaging the event (activity). In other words, the concept is essentially a pre-event phenomenon. Basically, various resources, human and (or) material, are ingredients that must be marshalled in some appropriate or desirable state to meet the challenge. Readiness of combat forces is widely accepted as the capability of such forces to perform the mission or function for which they are organized and designed. Within the military realm, readiness is a pre-D day/(pre-hostilities) phenomenon. We shall regard sustainability as the ability to maintain continuous readiness, since even when an operation is on-stream, to sustain the operation; it will mean ensuring that the unit/system is continuously ready for each activity that makes up the entire operation. By definition, Readiness is the level of preparedness to perform a task or embark on a mission. It is the aggregate capacity to carry out this basic function, given an inventory of resources and their status. It is of different types.
Types of Readiness
On a conceptual basis, there are three type of readiness. There are: 1. Perceived readiness (Rp) 2. Expected readiness (Re) 3. Actual readiness (Ra)
During peacetime, the navy may for example, perceive a threat or task. The readiness of the navy to match this threat or perform the task will be known as perceived readiness. When an actual task has been identified, there will be some expected level of readiness required to execute the task successfully. This type of readiness is referred to as expected readiness. In combat situations, it is usually quite a difficult to assess this precisely and more often than not, this normally contributes to the battle by units. When a war or conflict is imminent, then an actual task has been identified. This situation normally gives raise to the need to re-evaluate your expected readiness because your perceived readiness may have been overtaken by developments. The resultant readiness following such a re-evaluation is what we call actual readiness.
Basic Issues
Assessing the combat readiness of a naval fleet could turn out to be as complex as the prosecution of war itself. Conventionally, five basic issues are addressed when assessing readiness, which we call the 5W -H of readiness assessment. They are: 1. What should be assessment? 2. Who should do the assessment? 3. How should the assessment be done? 4. When should the assessment be done? 5. Where should the assessment be done? A naval fleet is usually made up of ships of different types designed to carry out specific roles. Various resources are committed in the process of performing the roles. It has because customary to classify these resources and then use the classification as a basis for carrying out the required readiness assessment. We make the point here that generally, attention is focused on pre-hostility regime. Modifications exist for handling hostility regime (sustained readiness) and posthostility regime. Post-hostility assessment normally serves as input into the fine-turning of readiness plans for subsequent campaigns.
Sub-resources
Subresources are the foundation upon which mission (task) accomplishment depends on. The terms ''task'' and ''mission'' are used interchangeably. However note that in give mission there might be one or more tasks to be carried out for the mission to be accomplished. And of course, for every tasks there might be as a number of activities. When we use task we shall be referring to a single task, while mission could mean a single or more. The goal of the commander is for the fleet to accomplish successfully any identified task. Any further assumption (s) made subsequently will be stated as appropriate.
Description and conceptual frame work
Our method (Lambda (λ)) for combat readiness assessment is based on two main concepts, namely; the prevailing (static) condition (PSC) of subresource which we refer to as the ɸ state of subresource and the criticality status of the subresources with respect to a specific task and this we call the λ-factor (Lambda factor). The two concepts are concomitant in the matrix of readiness assessment.
The Ф-state concept
Suppose that Fh is any given naval fleet, then Fh will comprise a number of ships. Further, suppose that M is the total number of ships in Fh, Fh will most probably be made of ships of different types according to the roles they are expected to play (Frigates, Aircraft carries, submarines, Fast Attack Craft, Land Ship Thanks, etc,). Let Sh be any Man of War (Fighting Ship) of Fh (Sh є Fh), then Sh has four RA'"s namely operation, Logistics, Manpower and Engineering. Each of these RA's will be made up of a number of subresources. Note that the various subresources will normally be in some "functional" state. The state for particular subresource at a given point in time (or defined interval) could be described in terms of its quality, quantity performance level, or some other characteristic of interest. This measure will be known as the Prescribed Performance Statement (PPS). The PPS at the time of evaluation is what we refer to as the static condition (Фstate) of the subresources. Obvious by, for a given type or set of subresources, differentiated PSS apply depending on what is being measured or even depending on the elements of 5W-H, with particular reference to the achievement of the desired objective. Each subresource that is relevant to the accomplishment of a particular task, contributes to fleet readiness.
The Concept of Resource Criticality (RC)
The concept of resource criticality or the λ-position, is rooted in what we call the Resource Requirement Question (RRQ): "Is the subresource in question required for the identified task or mission?" In order words, we are interested in knowing whether or not a given subresources is a combat essential for the specific task. If the answer to the RRQ is "Yes", then we say that, that subresource is a readiness candidate (or indicator). Otherwise, we say that it is inconsequential in the matix of readiness for the identified task regardless of its Фstate standing. This paper aims at demonstrating the applicability of the method for c-rating approach to readiness assessment of combat forces, we use extensively the work developed in an earlier paper titled method of c-rating for combat readiness assessment technique. A scenario within a naval environment is captured. A task Tk is identified for which a fleet made up of frigate f is to accomplish. The concept of ɸ state and λfactor are employed as concomitant factors for assessing the fleet readiness.
Motivations and organzation
The current effort is motivated by the need to advance the effort of previous researchers, particularly, by extending the contributions of Frank et al. (1968) our development attempts to address adequately those issues some previous researchers had failed to address.
The scenario
Suppose that, we have a fleet, which is divided into two flotillas each of which is organised in squadrons according to their types or roles. Suppose further that a task, Tk has been identified which only one type of ship (for simplicity) will be relevant. Assume that the squadron to be engaged for this task has 15 such tenders. Let it be a squadron of frigates. From intelligence and operational experience combined with careful analytical assessment, it is concluded that only 10 of the relevant tenders will be required for this task. Suppose further that each ship has 22 different subresources, which make up the resource areas -Operations, Logistics, Manpower, and Engineering System. Let these subresources be as named in table 1.
| S/N | Subresource | Abbreviation | Resource Area |
|---|---|---|---|
| 1. | Personnel Strength | - PLST | M |
| 2 | Petrol, Oil, Lubricants | - POL | L |
| 3 | Ammunition | - AMM | L |
| 4 | Spares | - SPR | L |
| 5 | ASPIDE | - ASP | L |
Table text extracted from the original PDF; superscript letters are shown inline. The original table image is below.
View original table image
Analysis
Let the letter F stand for frigate such that all the fifteen frigates in the fleet are designated F1, F2, F3, …, F15. Based on an established standard for determining the ɸstate of subresource, the navy will assess and assign ɸstate for each of the subresource. Suppose that the performance measures have been established, and then we obtain. 0.5 0.5 0.5 0.5 0.5 0.5 0.5 0.5 0.5 0.8 0.5 0.5 0 0.5 0.5 UNIF 0.8 0.8 0.5 0.8 1 1 1 0.8 1 0.5 1 0.8 0.5 1 1 SNRS 0.8 0.5 0.5 1 0.8 1 1 1 0.8 0.5 1 1 0.5 0.8 1 DY 0.5 0.5 0.8 1 1 1 0.5 0.5 0.8 0.8 0.5 1 1 0.5 1 MS 1 0.5 0.8 0.8 1 1 0.5 0.8 1 0 1 0.8 1 0.5 1 Following the identification of the task another evaluation is commenced so as to determine the criticality level for each of the subresources on board. The evaluation, gives the following λfactors: Observe that for a particular subresource, its λfactor will be the same for all the ships unlike the ɸ -state that may differ from one ship to another. Observe that, 6 of the subresources are highly critical, 8 are critical the tasks at hand, 5 are noncritical while the 3 subresources, ASP, REP.GR and DNET are inconsequential. These subresources will, therefore, be discarded from the subsequent Readiness Matrix of Evaluation (RME). In fact, when "passed" through the RCPC, what we have as output is the ɸ -state, not the Crating. Of the 15 frigates only 10 are required for the task. Therefore, the worst 5 frigates will be dropped and the readiness will be assessed based only on the best 10 ships. It is important to note that to arrive at the number 10 as the required number of frigates, consideration would have adequately be given to eventualities. Now that we have the ɸ -state of each subresource as it stands in each ship and we also have the λfactor of each subresource wrt to the task, we are then in a position to process our information in the Readiness Processing System (RPS). Applying the development (Mankilik, 2004) we obtain table 2.4. While the upper diagonal of each small square carries the ɸ -state a subresource at the time of assessment in a particular frigate, the lower part of the diagonal is the Crating (output) of processing such a subresource based on its criticality with respect to the identified task. Now to determine the readiness of the fleet to accomplish the task, we first evaluate the unreadiness of each ship. The five ships with the worst (highest) value of unreadiness will the ones to be dropped from our RME.
| Ship Subresource | F1 | F2 | F3 | F4 | F5 | F6 | F7 | F8 | F9 | F10 | F11 | F12 | F13 | F14 | F15 |
|---|---|---|---|---|---|---|---|---|---|---|---|---|---|---|---|
| PLST | 0.8 | 0.5 | 0.8 | 1 | 1 | 1 | 0 | 0.5 | 0.8 | 0.8 | 0.8 | 1 | 0.5 | 0.8 | 1 |
| POL | 0.5 | 1 | 0.8 | 0 | 0.5 | 1 | 0.5 | 0.8 | 0.8 | 1 | 1 | 1 | 0.8 | 0.8 | 0.5 |
| AMM | 0.8 | 0.8 | 1 | 1 | 0.5 | 0 | 0.8 | 0.8 | 0.8 | 1 | 1 | 0.5 | 0.8 | 1 | 0.8 |
| SPR | 0.5 | 0 | 0.5 | 0 | 0.8 | 0.5 | 0 | 0 | 0.5 | 0.8 | 1 | 1 | 0.5 | 1 | 0.8 |
| ASP | 0.8 | 0.8 | 0.8 | 0.8 | 0.5 | 1 | 1 | 0.5 | 0.8 | 0.8 | 1 | 0.8 | 0.5 | 0.8 | 1 |
| TPT | 1 | 1 | 1 | 1 | 1 | 1 | 1 | 1 | 1 | 1 | 1 | 1 | 1 | 1 | 1 |
| TNG | 1 | 0.8 | 0 | 0 | 0.5 | 1 | 0.5 | 0.5 | 0.8 | 0 | 1 | 0.8 | 0.8 | 0.5 | 1 |
| INT.G | 0.8 | 1 | 0.5 | 0.8 | 0.5 | 0.8 | 1 | 1 | 1 | 0.5 | 0.8 | 1 | 0.5 | 0.8 | 0.8 |
| FCON | 1 | 0.5 | 0.5 | 0.8 | 1 | 1 | 1 | 0.8 | 1 | 0.8 | 1 | 1 | 0.8 | 0.8 | 0.8 |
| REP.GR | 0.8 | 0.5 | 0.5 | 0.8 | 0.8 | 1 | 0 | 0.8 | 0.5 | 1 | 0.8 | 0.5 | 0.8 | 0.8 | |
| WEAPONS | 1 | 0.8 | 1 | 0.8 | 1 | 1 | 1 | 1 | 1 | 0.8 | 0.8 | 0.8 | 0.8 | 0.8 | 0.8 |
| LDR | 0.8 | 0.8 | 1 | 1 | 1 | 0.5 | 0.8 | 0.8 | 0.8 | 1 | 0 | 0 | 0.8 | 0.5 | 1 |
| MANN | 0.8 | 0.5 | 1 | 1 | 1 | 1 | 0.8 | 0.5 | 0 | 0.5 | 0.8 | 0.8 | 0.5 | 0.8 | 1 |
| RTN | 0.8 | 0.5 | 0.8 | 1 | 0.5 | 0 | 0 | 0 | 0.5 | 0.5 | 0 | 0.5 | 0 | 0.5 | 0.5 |
| ELEC | 1 | 1 | 1 | 0.8 | 0.5 | 0.8 | 1 | 1 | 1 | 1 | 1 | 1 | 1 | 0.8 | 0.8 |
| MAR.CUL | 0.8 | 0.8 | 0.8 | 0.8 | 0.8 | 1 | 0.8 | 1 | 1 | 1 | 0.8 | 0.8 | 0.8 | 0.5 | 1 |
| DNET | 0.5 | 0.5 | 0.8 | 0.8 | 0.8 | 1 | 1 | 0.8 | 0.8 | 0 | 1 | 1 | 1 | 1 | 1 |
| STY EQUIPT | 0.5 | 0.5 | 0.5 | 0.5 | 0.5 | 0.5 | 0.5 | 0.5 | 0.5 | 0.8 | 0.5 | 0.5 | 0 | 0.5 | 0.5 |
| UNIF | 0.8 | 0.8 | 0.5 | 0.8 | 1 | 1 | 1 | 0.8 | 1 | 0.5 | 1 | 0.8 | 0.5 | 1 | 1 |
| SNRS | 0.8 | 0.5 | 0.5 | 1 | 0.8 | 1 | 1 | 1 | 0.8 | 0.5 | 1 | 1 | 0.5 | 0.8 | 1 |
| DY | 0.5 | 0.5 | 0.8 | 1 | 1 | 1 | 0.5 | 0.5 | 0.8 | 0.8 | 0.5 | 1 | 1 | 0.5 | 1 |
| MS | 1 | 0.5 | 0.8 | 0.8 | 1 | 1 | 0.5 | 0.8 | 1 | 0 | 1 | 0.8 | 1 | 0.5 | 1 |
Table text extracted from the original PDF; superscript letters are shown inline. The original table image is below.
View original table image
Computation
The computations of the readiness of each ship to perform its roles is based on the formula:
Where: z F, = Total Unreadiness of the frigate Fj j = 1, 2, 3, …......, 15
Such that zfj = β (A) = ⋎ (𝐵 + 𝐶) + 𝜎 (𝐷 + 𝐸 + 𝐺) Arranging the ships in ascending order of unreadiness we have F15, F12, F1, F5, F9, F14, F3, F2, F6, F4, F11, F13, F8, F10 and F7. The positions of F5 and F9 can be swapped. So also can F14 with F3 and F2 with F4 ships F11, F13, F8, F10, and F7 will be dropped for the task. 5 follows from calculation of status of each Subresourcetaking cognizance of the ɸ and A-factors.
From table 5, we have the following computations: The mean unreadiness is then 0.282 This value is then read out on the Cscale to give us the readiness for the fleet to embark on the task. Using the scale in figure 3.12.3 we can say the fleet is almost substantially ready for the task. A decision can then be taken as to whether to go ahead with the operation or not. In a similar manner, we evaluate the readiness of each subresource with respect to the task. This provides the horizontal analysis for decision taking. It is important to note and to remember that we are evaluating through readiness. As such, the smaller the value obtained, the better. As stated elsewhere, it is adviceable to avoid rounding up of figures at the disaggregate level, rather, this should be done in the final analysis. It is of note that a decision on whether to go ahead with the mission or not could and indeed should be guided by own fleet level of readiness and enemy own perceived level of readiness. Caution is vital here as enemy level of readiness can hardly be actual infact it is never so known. It depends highly on the accuracy of intelligence data and analysis.
| Unreadiness/ Ship | F1 | F2 | F3 | F4 | F5 | F6 | F9 | F12 | F14 | F15 |
|---|---|---|---|---|---|---|---|---|---|---|
| PL ST | C-1 | C-2 | C–1 | C-1 | C-1 | C-1 | C-1 | C-1 | C-1 | C-1 |
| POL | C-3 | C-1 | C-2 | C-4 | C-3 | C-1 | C-1 | C-1 | C-2 | C-3 |
| AMM | C-1 | C-1 | C-1 | C-1 | C-1 | C-4 | C-1 | C-1 | C-1 | C-1 |
| SPR | C-2 | C-4 | C-2 | C-3 | C-1 | C-2 | C-2 | C-1 | C-1 | C-1 |
| TPT | C-1 | C-1 | C-1 | C-1 | C-1 | C-1 | C-1 | C-1 | C-1 | C-1 |
| TNG | C-1 | C-1 | C-4 | C-4 | C-2 | C-1 | C-1 | C-1 | C-2 | C-1 |
| INT.G | C-1 | C-1 | C-3 | C-2 | C-3 | C-2 | C-1 | C-1 | C-2 | C-2 |
| FL. CON | C-1 | C-1 | C-1 | C-1 | C-1 | C-1 | C-1 | C-1 | C-1 | C-1 |
| WPN | C-1 | C-1 | C-1 | C-1 | C-1 | C-1 | C-1 | C-1 | C-1 | C-1 |
| LDR | C-1 | C-1 | C-1 | C-1 | C-1 | C-2 | C-1 | C-4 | C-2 | C-1 |
| MANN | C-2 | C-3 | C-1 | C-1 | C-1 | C-1 | C-4 | C-2 | C-2 | C-1 |
| RTN | C-1 | C-2 | C-1 | C-1 | C-2 | C-4 | C-2 | C-2 | C-2 | C-2 |
| ELEC | C-1 | C-1 | C-1 | C-1 | C-1 | C-1 | C-1 | C-1 | C-1 | C-1 |
| STY EQUIRE | C-3 | C-3 | C-3 | C-3 | C-3 | C-3 | C-3 | C-3 | C-3 | C-3 |
| UNIF | C-1 | C-1 | C-2 | C-1 | C-1 | C-1 | C-1 | C-1 | C-1 | C-1 |
| SNRS | C-1 | C-1 | C-1 | C-1 | C-1 | C-1 | C-1 | C-1 | C-1 | C-1 |
| DY | C-3 | C-3 | C-2 | C-1 | C-1 | C-1 | C-2 | C-1 | C-3 | C-1 |
| MS | C-1 | C-1 | C-1 | C-1 | C-1 | C-1 | C-1 | C-1 | C-1 | C-1 |
| MARCUL | C-2 | C-2 | C-2 | C-2 | C-2 | C-1 | C-1 | C-2 | C-3 | C-1 |
Table text extracted from the original PDF; superscript letters are shown inline. The original table image is below.
View original table image
Figures and tables from the paper
| Unreadiness/Ship | 𝜷(A) | 𝚼 (B + C) | 𝝈 (𝑫+ 𝑬+ 𝑮) | UFj | UFj = UFj 19 |
|---|---|---|---|---|---|
| F1 | 0.2 (3) = 0.6 | 0.5 (3+1) = 2.0 | 1.0 (0 + 0 + 0) = 0 | 2.6 | 0.137 |
| F2 | 0.2 | 2.5 | 1.0 | 3.7 | 0.195 |
| F3 | 0.6 | 2.0 | 1.0 | 3.6 | 0.189 |
| F4 | 0.4 | 0.5 | 3.0 | 3.9 | 0.205 |
| F5 | 0.2 | 2.5 | 0 | 2.7 | 0.142 |
| F6 | 0.2 | 1.5 | 2.0 | 3.7 | 0.195 |
| F7 | 0.4 | 2.0 | 3.0 | 5.4 | 0.284 |
| F8 | 0 | 2.5 | 2.0 | 4.5 | 0.284 |
| F9 | 0.2 | 1.5 | 1.0 | 2.7 | 0.142 |
| F10 | 0.6 | 2.0 | 2.0 | 4.6 | 0.242 |
| F11 | 0.6 | 1.5 | 2.0 | 4.1 | 0.216 |
| F12 | 0.4 | 1.0 | 1.0 | 2.4 | 0.126 |
| F13 | 0.4 | 3.0 | 0 | 4.4 | 0.232 |
| F14 | 0.6 | 3.0 | 0 | 3.6 | 0.189 |
| F15 | 0.2 | 1.5 | 0 | 1.7 | 0.089 |
| 5.6 | 29.0 | 19.0 | 53.6 |
Table text extracted from the original PDF; superscript letters are shown inline. The original table image is below.
View original table image
References
32 in the original paper- Aplan S. An Approach to the Measurement of the Short Term Readiness of Military Systems. Technical Report No. 10. GSPA, New York University, N.Y, LD/34461A, 1975.
- Barnejee UK, Operational Analysis and Indian Defence. (Naurarg Rai) Concept Publishing Company, New Delhi, 1980.
- Barzily Z, Marlow WH, Zacks S. Survey of Approaches to Readiness. NRLQ, 1974, p. 21-31.
- Bigelow JH. Conceptual Design for an Army Logistics Assessment -Extended (ALA -X) methodology. The RAND Publication N-2317 -A, 1985.
- Bigelow JH. Relating Selected Army Logistics researches to Combat Performance Measures, The RAND Publication N -2317 -A, 1985.
- Christer AH, Lee SK. Modelling Ship Operational Reliability over a Mission Under Regular inspections, EJOR S. 1997;48:688-699.
- Cooper DF, Holt J, Klein H. Models of Naval Command and Control System. EJOR. 1986;26:217-228.
- Cooper G. METRI and the Allowance List Problem, Management Science. 1967;13:293 326.
- Dunlop and Associate, METRI Personnel Readiness Measurement, Darien, Connecticut LD 08175B, 1965.
- Frank S, Gruttke WB, Marlow WH, Mathis SJ. Readiness Measurement via Sub resource C-ratings, Technical paper Serial T-216, Logistics Research project, the George Washington University, Washington, D.C. LD 196463, 1968.
- Jaggi B, Lau HS. Toward a model for Human Resource Valuation: Accounting Review.1975;50:348-350.
- Kaplan RTE, Lu JY, Paulson RM. SCAM: A System Support Cost Analysis Model. The RANd Pulblications, RM -6049 -PR, 1969.
- Kaplan S. Application of Programs with Maximum Objective Functions to Problegs of Optimal Resource Allocation. Operational Research. 1974;22:802-807.
- Kaplan S. A production Function Approach to the Measurement of Short Term Readiness of Navy Units. Technical Report No. 1, Graduate School of Public Administration, New York University, New York, LD 28693, 1972.
- Kaplan S. Readiness Analysis for ships where both Moberization and Replacement are used to Inrease Fleet Readiness. Technical Report No. 13, Graduate School of Public Administration New York University, New York, W.Y (LD, 35512A), 1975.
- Kaplan S. readiness and the Optimal Redeployment of Resources, Technical Report No. 4, Graduate School of Public Administration, New York University, New York N.Y. (LD 28829), 1972.
- Mavoy JL. The Concept of Material Readiness as Applied to Naval Vessels, Logistics Management Institute, Washington D.C. (LD 26719), 1970.
- Michael R, Cohen IK, Pyles RA. Recent Progress in Assessing the Readiness and Sustainability of Combat Forces, RAND, R, 3475 -AF, 1987.
- Oladejo MO. Some Development in Military Operational Analysis: Readiness, C 3 I and Training, Ph.D., Thesis, University of Benin, Nigeria, 1995.
- Ovuworie GC. Maintenance Policy in Nigerian Armed Forces A Critical Analysis, Eastern Naval Command Seminar, 5 th -7 th May, Calabar, Nigeria 1987.
- Pyles RA, Tripp R. Measuring and Managing Readiness. The Concept and Design of the Combat Support Capability Management System. The RAND Corporation, N-1840-AF, 1982.
- Pyles RA. The Duna. Metric Readiness Assessment Model: Motivation, Capabilities, and Use, the RAND R2886, 1984.
- Raymond P, Tripp R. Measuring and Managing Readiness: the Concept and Design of the Combat Support Capability Management System. RAND N-1840 AF, 1982.
- Rich MD, Cohen IK, Pyles RA. Recent Progess in Assessing the Readiness and Sustainability of Combat Forces. The RAND Corporations R-3475-AF, 1987.
- Rich MD, Stanley WL, Anderson S. Improving U.S Airforce Readiness and Sustainability. The RAND Publications, R -31131/1 -AF, 1984.
- Schnelker HJ. Max-Cap Allowance Model (revised), Alrand Report 48A, Operations Analysis Department, U.S. Navy Fleet Material Support Office, Mechanicsburg Pennsylvania (LD 08595), 1966.
- Schnelker HJ. Max-Cap Allowance Model, ALRAND Report 48, Application Development Division, Data Systems Support Office, Mechanicsburg, Pennsylvania (LD 08595), 1965.
- Segel FW. The Methodology for Improved Inspection Procedures by the U.S Navy Board of Inspection and Survey. Technical Paper Serial T-160. Logistics Research Project, The George Washington University, Washington D.C. (LD 07860), 1964.
- Shishko R, Paulson M. Relating Resources to the Readiness and Sustainability of Combined Arms Units, RAND, R-2769 -MRAL, 1981.
- Tolis IS. A continuous Time Markov Process Model Operational Readiness. Technical Paper Serial T-214, Logistics Research Project, The George Washington University, Washington D.C. (LD 19646), 1968.
- Tsai CL, Tripp R, Berman MB. The Vision Assessment System: Class IX Sustainment Planning. The Rand Corporation R-3969-A, 1992.
- Zacks S. Operational Readiness in Modern Trend for Logistics Research, ed. W.H. Marlow, Massachussets Institute of Technology Press, Cambridge, Massachussets, 1976.