
Research article · 2022 · Full text
International Journal of Veterinary Sciences and Animal HusbandryOn station performance evaluation of local honey bee colonies traits (Apis mellifera scutellata) in Gedeo zone, Ethiopia
Volume 7(4) · Pages 46–50 · DOI: 10.22271/veterinary.2022.v7.i4a.431 ↗
Research areasInsect and Arachnid Ecology and BehaviorPlant and animal studiesInsect and Pesticide Research
Abstract
Author-writtenIn Ethiopia, despite the potential of apicultural resource, production and productivity are relatively low. This could be due to many factors like management, environmental factors and races of honeybees. The aim of this study was to evaluate productive potentiality trait of local honeybee colonies for further colonies multiplication purpose. We obtained 20 selected strong honeybee colonies from local beekeepers within traditional hives and transferred into movable frame hive at Dilla site. All the transferred colonies were managed properly to establish themselves and acquire uniform strength. These colonies were evaluated for different parameters such as hygienic behavior, brood, pollen and nectar area, swarming and absconding tendency at different season. The result indicated that the mean percent removal per colony varied from 86.57 (February) to 99.62 (August). The highest brood rearing activity was observed in September and March that covered up to 148.9±14.16 unit areas while the least was observed during November (1.19±0.43) unit area. Maximum pollen and nectar area was found in October (97.5±12.40) unit area and April (81.88±9.47) unit area. While minimum pollen area (5.25±7.13) unit area and nectar (1.10±0.1) area was occupied in November. In general, the study showed that A. m. scutellata honeybees are good in hygienic behavior and brood rearing performance under optimum management practices in the study area. On average 25% of absconding was observed at study site over the last two years of the study period at the time of pollen and nectar shortage mainly November and May Therefore, it is recommended to investigate its detail behavioral aspects whether it is due to environmental or genetically factor for future selection and improvement.
Summary
Source-checkedPlain-language reading of the full paper, prepared with AI and checked against the text. Each point links to the authors' own words.
Why it matters
- Ethiopia has significant potential for apiculture, but current honey production and productivity levels remain relatively low. View evidence ↗
- Honeybee colony strength is directly linked to productivity, as larger populations generally correlate with higher honey production. View evidence ↗
- Hygienic behavior, defined as the ability of worker bees to identify and remove dead or infected brood, is a key indicator of a colony's disease resistance. View evidence ↗
The question
- The study aimed to evaluate the productive potential traits of local honeybee colonies to identify those suitable for further multiplication. View evidence ↗
What they did
- The research was conducted over two and a half years, from October 2019 to November 2021, at the Dilla apiary of the Hawassa Agricultural Research Center in Ethiopia. View evidence ↗
- Hygienic behavior was tested using a pin-killed brood assay, measuring the removal of dead pupae from a 100-cell comb section. View evidence ↗
What they found
- The mean percentage of dead brood removal by the colonies varied by season, ranging from a low of 86.57% in February to a high of 99.62% in August. View evidence ↗
- Brood rearing peaked in September and March with up to 148.9±14.16 unit areas, and reached its lowest point in November at 1.19±0.43 unit areas. View evidence ↗
- Maximum pollen storage occurred in October (97.5±12.40 unit area) and maximum nectar storage in April (81.88±9.47 unit area), while both were at their minimum in November. View evidence ↗
- The average number of queen cells produced per colony in a 21-day period ranged from 0 to 5.2. View evidence ↗
- The highest rates of colony absconding occurred in May (63.3%), July (59%), January (54.4%), and December (50.3%). View evidence ↗
What it means
- The authors concluded that A. m. scutellata colonies in Gedeo exhibit varied performance but possess remarkable hygienic behavior, reaching up to 99.62% brood cleaning within 24 hours. View evidence ↗
- The authors recommend further investigation into whether the observed behaviors are driven by genetic or environmental factors to aid future selection and improvement. View evidence ↗
Visual summary
2 visualsIllustrations explain the paper; charts are replotted from the paper's own table values.
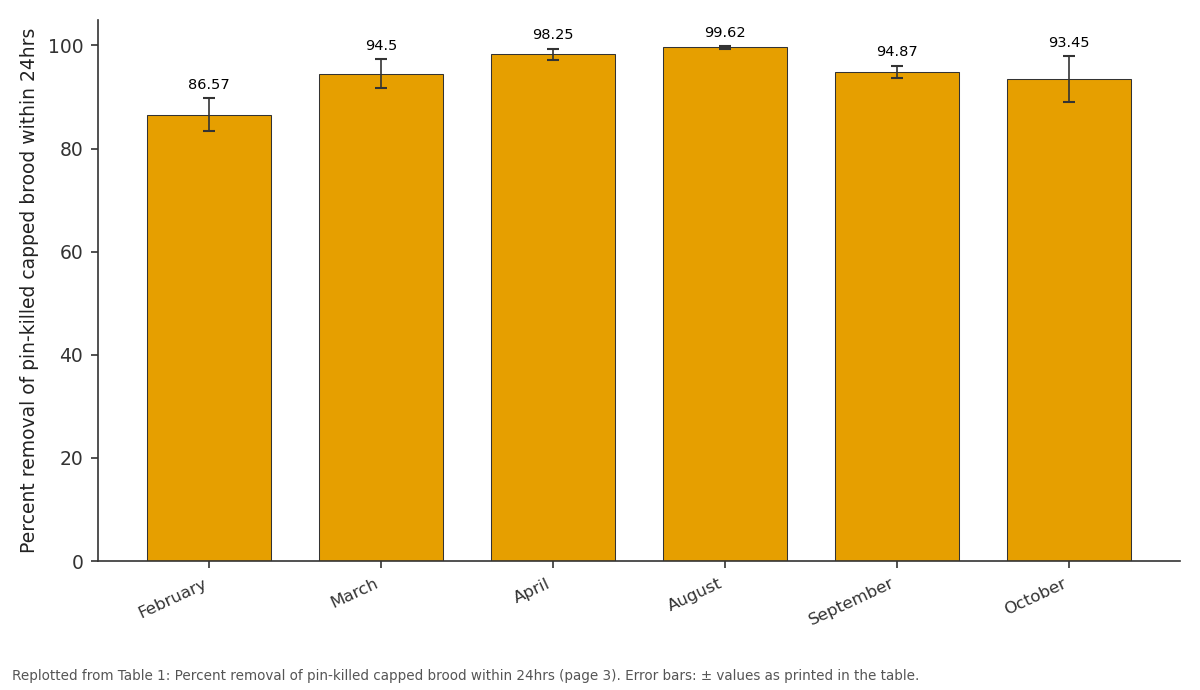
Removal of pin-killed brood (Mean+ SD): February vs March vs April vs August vs September
Replotted from Table 1 (page 3) of the original paper. Every bar is the paper's own table value.
View source evidence ↗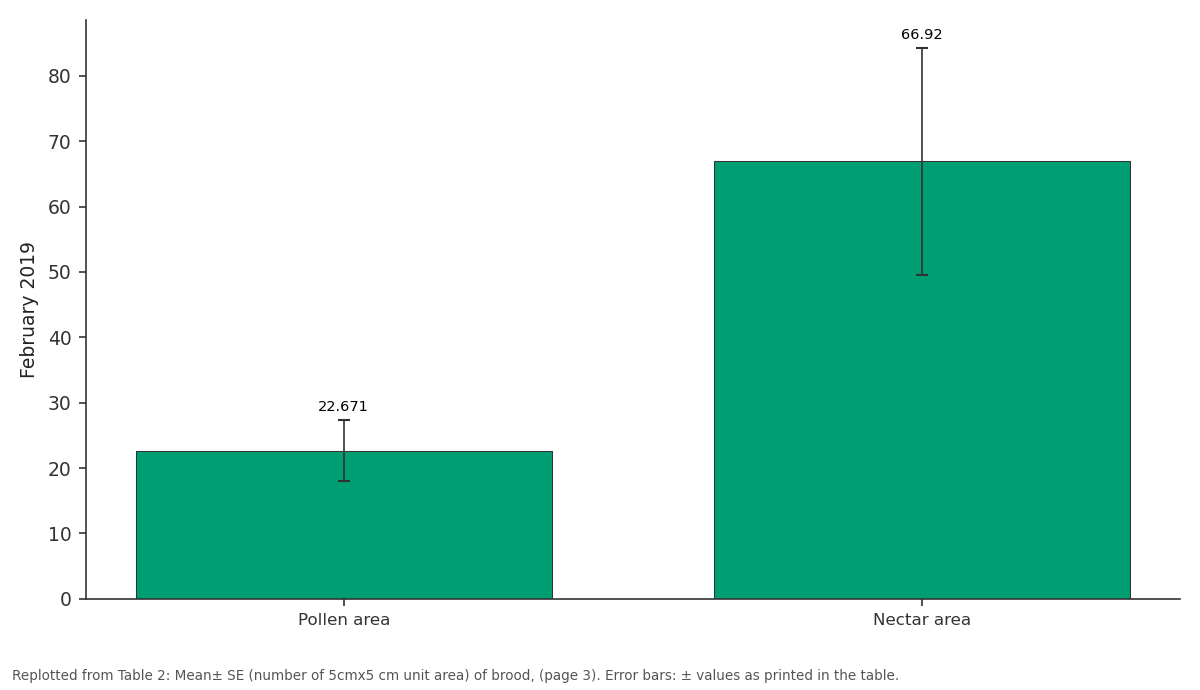
February 2019: Pollen area vs Nectar area
Replotted from Table 2 (page 3) of the original paper. Every bar is the paper's own table value.
View source evidence ↗Figures & tables
From the original paper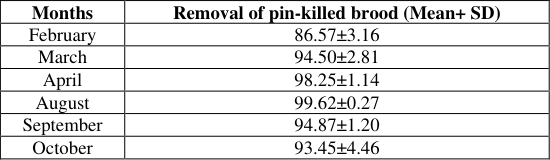 Table 1
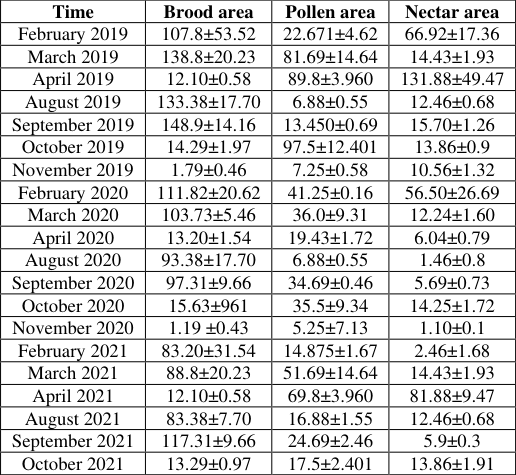 Table 2
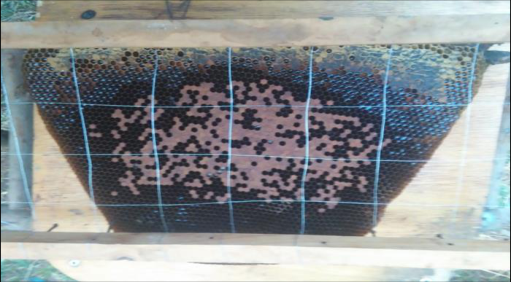 Figure 3
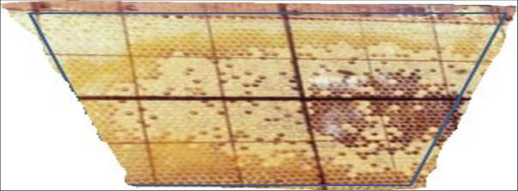 Figure 2
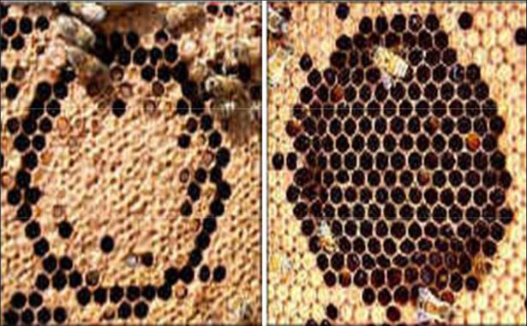 Figure 1
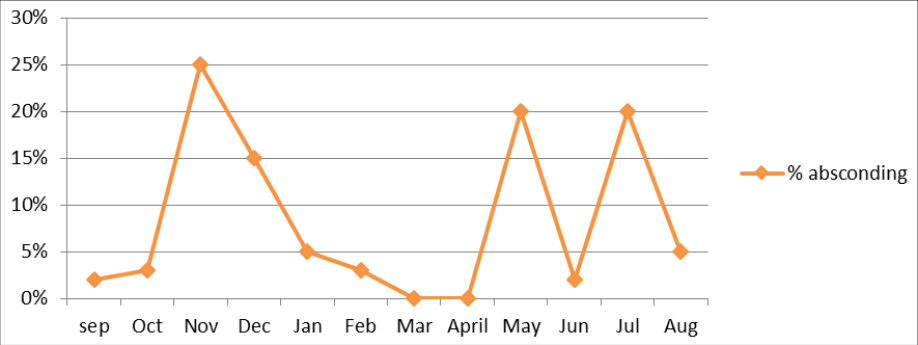 Figure 2
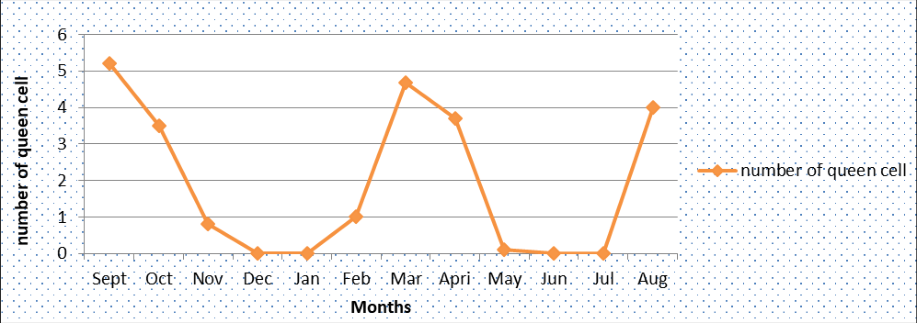 Figure 4
Introduction
For a successful beekeeper, beekeeping production depends on the selection of better performing honey bee colonies. Thus, selection aims and criteria are important tools in bee breeding program for a beekeeper in an apiary. Colonies in an apiary could be selected on the basis of some of the of most important measurable characteristics viz. spring colony development, gentleness and a tendency to remain calm on the comb, over wintering ability, honey production and resistance against diseases (Gregorc A and Vzreja, 2005) [7] . In honeybees as social insect, the colony is the level of selection, but most of the functions are performed by individual workers in the colony (Fewell and Page Jr, 2000) [4] . The various production activities of colonies are greatly influenced by the population of adult bees that forms each bee colony. Colonies with larger populations usually perform better than those with smaller populations. Hence, strength of bees in a colony affects productivity because of high level of correlation between hive strength and honey production. There are some of the important factors which affect colony strength viz. egg laying rate, viability rate, brood care, brood development time and life span (Gregorc and Lokar, 2010) [8] . Although, the worker population of each honey bee colony also depends on food availability (nectar and pollen), oviposition capacity is very important for the generation of populous hives (Rakesh K and Pramod, 2018) [10] . The effective defiance mechanism against disease is one of the most important functions of the worker bees in a colony. The individual bee's immune system functions in a similar way to that of vertebrate animals, although the most effective defense mechanism that can lead to self-healing of the bee colony is the social behavior of removing as many pathogen agents or parasites as possible from the bee colony. This behavioral defense (entrance reduction and/or stinging) prevents parasites from penetrating the bee colonies, or their killing or removal. Disease resistance is known to correlate with the "hygienic behavior" of worker bees. This is the ability of workers to recognize dead brood and then remove infected or damaged brood. This characteristic has been found to be regulated by two pairs of recessive genes. The queen honey bee is an important member to a colony's survival and functions. The longevity of a queen in a colony depends on its reproductive potential, and its permanence in the colony is related to its oviposition capacity, which affects colony viability and vitality. The queen is naturally replaced when the spermatozoa stored in its sperm theca are depleted (Hatjina F et al., 2020) [14] . Egg-laying capability "is not the only measure of a queen's performance. Queens produce pheromones that greatly affect the activities, especially foraging activity of workers. Pheromone production diminishes in quality and quantity as queen age. In peak season, a queen laid about 2000 eggs (Gary, 2010) [15] . Brood solidness is also an important trait of a colony. Brooding pattern/solidness of a colony could be erratic or solid. Brood solidness of a comb is expressed by the percentage of empty worker cells in a brood patch of a given area. Whether, an acceptable level of empty cells in a comb should be usually less than 10% (Delaplane et al., 2013) [3] . In the light of above facts regarding the importance of selection of better performing colonies, those colonies having all these important traits will be selected in breeding yard for further breeding programmed for improvement of the stock. Therefore, the aim of this work was to evaluate productive potentiality trait of local honeybee colonies for further colonies multiplication purpose.
Materials and Methods
Materials and Methods
Description of the Study area and source of experimental colonies
This study was conducted at Dilla apiary of Hawassa agricultural research center, south nation, nationality, people regional state, Ethiopia from October 2019 to November 2021 for two and half consecutive years. Twenty Model beekeepers were purposively selected in Dilla zuriya woreda. One strong colony per beekeepers was selected by examined via internal and external observation for their efficiency and purchased and collected in to study site. Finally the collected colony transferred to improved hive in experimental apiary site. Twenty experimental colonies of honeybees used for this experiment to evaluate the performance. The necessary seasonal colony management activities were undertaken throughout the study period. Performance evaluations of the colonies were studied through the following different parameters.
Data Collection 2.2.1 Evaluation of Hygienic Behavior
Hygienic behavior was determined by a pin-killed brood assay in which the time was recorded for colonies to detect and remove dead brood from a comb section containing 100 cells (containing approximately 100 capped pupae) on one side of the comb. This section of the comb was marked by removing one entire row of cells surrounding the 100 cells. The number of empty cells within the section was counted and recorded. Then every capped pupa within the section was pin-killed and placed back in to the hive of the test colony. After 24hrs the frame with the section will be taken out and then, the numbers of remaining dead brood and removed was recorded. This test was repeat five times for all the colonies to be tested for the hygienic behavior. Finally, the percent of removal of dead brood will calculated as follows the formula used by Kebede, 2006 [17] .
Where: R = Percent removal of dead brood within 24hrs K = Number of dead brood removed within 24hrs E = Number of empty cell within the section insert before test C = Number of brood cell remained capped after 24hrs T = Total number of brood within the section of an insert
Evaluation of Brood Area, Pollen and Nectar Storage
The total brood area was measured during the study periods to determine the brood population using 5cm x 5cm gridded wooden frame and placed over each side of the brood combs. The total brood unit area was calculated from the area occupied by the brood. In addition to this, the comb area occupied by pollen and nectar stores was also measure in the same way.
Number of queen cells produced (Swarming Behavior)
Swarming tendency of the colonies was evaluated by counting the number of queen cells constructed from all colonies under the study. These counted cells were remove immediately to avoid double counting.
Evaluation of Absconding Tendency
Absconding tendency was assessed by the ratio of colonies evacuating to the total number of colonies used for the experiment provided that all the colonies are kept under uniform environmental condition.
Data Management and Statistical Analysis
Data collected will be entered into Microsoft excel 2007 and analyzed using SPSS version 23. Normality of the data will check and they are transformed on Arcsine transformation when necessary. One-way analysis of variance (ANOVA) will run and Tukey's student test (HSD) at 5% level of significance will used to make mean separation, whenever significant results will encountered.
Results and Discussion
Results and Discussion
Evaluation of Hygienic Behavior
The result of the hygienic behavior of twenty colonies in terms of removing successive pin killed capped brood in 24hrs in different seasons is shown in (Table 1). In this test, the mean percent removal per colony varied from 86.57 (February) to 99.62 (August). This indicated that there was a significant effect of test time (month) on performance of A. m. scutellata honeybee colonies in hygienic behavior. This is in line with the finding of Tadele Alemu et al. (2014) [12] who reported that there was a significant effect of test time (month) on performance of A.m. scutellata honeybee colonies in hygienic behavior. The mean percent removal per colony varied from 86.57 (June) to 99.62 (December) in Guji zone.
| Months | Removal of pin-killed brood (Mean+ SD) |
|---|---|
| February | 86.57±3.16 |
| March | 94.50±2.81 |
| April | 98.25±1.14 |
| August | 99.62±0.27 |
| September | 94.87±1.20 |
| October | 93.45±4.46 |
Table text extracted from the original PDF; superscript letters are shown inline. The original table image is below.
View original table image
Evaluation of Brood, Pollen and Nectar Area
Brood Area: The total brood area was measured during the study periods to determine the brood population using 5cm x 5cm gridded wooden frame and placed over each side of the brood combs. The results indicated that the highest brood rearing activity was observed in September and March that covered up to 148.9±14.16 unit areas while the least was observed during November (1.19±0.43) unit area. This results dis agrees with Tesfa Mossie and Kasabiratu (2019) [13] who had reported that the highest brood rearing activity was observed from May to June that covered with a mean of 231.63±161.8 and 252.19±143.43 unit areas of 5cm x5cm per colony in Jimma Zone. The brood rearing pattern of A. m. scutellata honeybee colonies showed fast buildup of population between December and February. The storage of nectar and pollen grains by A.m. scutellata honeybees showed a significant variation in different seasons (Table 2). The highest nectar and pollen grain storage was recorded in March and April while the least nectar was stored between Novembers. This is due to the availability of different bee forage species and seasonal variation. Similarly, different authors reported that the honey and pollen collection depends on gene pool of foragers bees significantly affected by environmental conditions (Rakesh K and Pramod M, 2018) [10] .
| Time | Brood area | Pollen area | Nectar area |
|---|---|---|---|
| February 2019 | 107.8±53.52 | 22.671±4.62 | 66.92±17.36 |
| March 2019 | 138.8±20.23 | 81.69±14.64 | 14.43±1.93 |
| April 2019 | 12.10±0.58 | 89.8±3.960 | 131.88±49.47 |
| August 2019 | 133.38±17.70 | 6.88±0.55 | 12.46±0.68 |
| September 2019 | 148.9±14.16 | 13.450±0.69 | 15.70±1.26 |
| October 2019 | 14.29±1.97 | 97.5±12.401 | 13.86±0.9 |
| November 2019 | 1.79±0.46 | 7.25±0.58 | 10.56±1.32 |
| February 2020 | 111.82±20.62 | 41.25±0.16 | 56.50±26.69 |
| March 2020 | 103.73±5.46 | 36.0±9.31 | 12.24±1.60 |
| April 2020 | 13.20±1.54 | 19.43±1.72 | 6.04±0.79 |
| August 2020 | 93.38±17.70 | 6.88±0.55 | 1.46±0.8 |
| September 2020 | 97.31±9.66 | 34.69±0.46 | 5.69±0.73 |
| October 2020 | 15.63±961 | 35.5±9.34 | 14.25±1.72 |
| November 2020 | 1.19 ±0.43 | 5.25±7.13 | 1.10±0.1 |
| February 2021 | 83.20±31.54 | 14.875±1.67 | 2.46±1.68 |
| March 2021 | 88.8±20.23 | 51.69±14.64 | 14.43±1.93 |
| April 2021 | 12.10±0.58 | 69.8±3.960 | 81.88±9.47 |
| August 2021 | 83.38±7.70 | 16.88±1.55 | 12.46±0.68 |
| September 2021 | 117.31±9.66 | 24.69±2.46 | 5.9±0.3 |
| October 2021 | 13.29±0.97 | 17.5±2.401 | 13.86±1.91 |
Table text extracted from the original PDF; superscript letters are shown inline. The original table image is below.
View original table image
Evaluation of swarming and absconding tendency Swarming (Number of queen cells produced) tendency
Swarming tendency of the colonies were evaluated by counting the number of queen cells constructed from all colonies under the study and number of swarms produced during the normal honeybees' reproduction season. The average numbers of queen cells in colony per 21-day period were found to be 5.2 -0 queen cells. As indicated in Fig. 4, bee colonies built a higher average number of queen cells for five months (September, October, March, April and August). Higher numbers of queen cells and peak reproductive swarming tendencies for local honey bees were recorded during September and March. These results are totally consistent with the previous reports of (Amssalu Bezabeh 2002 [16] ; Ahmad et al., 2017) [1] that declared tropical honeybees generally have a strong reproductive swarming impulse and tendency to increase population very quickly leading to rapid multiplication of colonies. Am. scutellata had higher tendency to reproductive swarming than A.m. Jemenitica and A.m. woyi-gambella as 36.6% of the populations of the former race swarm every year and issuing multiple swarms commonly 3 to 6 per colony per annum. flowering plant as a source of pollen and nectar; and during rainy season (June to July), as the pollen of the flowering plants is diluted and the nectar is washed by the rain and is referred to as dearth period. This result correlates with Schneider S (1990) [11] results, who reported that absconding was very serious among the tested colonies due to frequent disturbances, pest attacks, shortage of bee forage in the rainy season which might be due to dearth or pesticide application used for crop production in the area.
Conclusion and Recommendations
It may be concluded from the present study that the different traits of colonies were tested. This study revealed that A. m. scutellata honeybee colonies in Gedeo had generally different behavioral and productive performances. The colonies had remarkable hygienic performance in removing pin-killed capped brood that reached up to 99.62% cleaning of dead broods within 24hrs in colonies. This high level of hygienic performance could be important in disease, varroa mite, pests, wax moth and bee beetle resistance. The colony strength associated with the performance of colonies and affect productivity of the high level of correlation between brood rearing time, nectar and pollen collection. The highest brood rearing activity was observed in September and March that covered up to 148.9±14.16 unit areas while the least was observed during November (1.19±0.43) unit area. On average 25% of absconding was observed at study site over the last two years of the study period at the time of pollen and nectar shortage mainly November and May. Therefore, it is recommended to investigate its detail behavioral aspects whether it is due to environmental or genetically factor for future selection and improvement.
Acknowledgement
AcknowledgementsI greatly acknowledge South Agricultural Research Institute, Hawassa Agricultural Research center for the material, logistics and financial support.
Figures and tables from the paper
References
17 in the original paper- Ahmad A Al-Ghamdi, Nuru Adgaba, Yilma Tadesse, Awraris Getachew, Anwer A Al-Maktary. Comparative study on the dynamics and performances of Apis mellifera jemenitica and imported hybrid honeybee colonies in southwestern Saudi Arabia, Saudi Journal of Biological Sciences. 2017 Jul 1;24(5):1086-1093.
- Amssalu B. Multivariate Morphometric Analysis and Behaviour of honeybees (Apis mellifera L.) in the Southern Regions of Ethiopia. PhD Thesis, Rhodes University, South Africa, 2002, 109-214.
- Delaplane KS, Van der Steen J, Guzman E. Standard methods for estimating strength parameters of Apis mellifera colonies. In V Dietemann; J D Ellis; P Neumann (Eds) The Coloss Bee book, Volume I: standard methods for Apis mellifera research. Journal of Apicultural Research, 2013 Jan 1;52(1):1-2.
- Fewell JH, Page Jr. RE. Colony-level selection effects on individual and colony foraging task performance in honeybees, Apis mellifera L. Behav. Ecol. Sociobiol. 2000 Aug;48(3):173-181.
- Hatjina F, Costa C, Büchler R, Uzunov A, Drazic M, Filipi J. Population dynamics of European honey bee genotypes under different environmental conditions Population dynamics of European honey bee genotypes under different environmental conditions. Advances in Bioscience and Bioengineering. 2020;8(3):42-46.
- Gary. Bee My Valentine. Honey bee hobbyist: The care and keeping of bees (Hobby Farm), 2011 Apr 5, 177.
- Gregorc A, Vzreja Čebeljih matic (Apis mellifera carnica). Žirovnica -Čebelarska zveza Zgornje Gorenjske, 2005, 48.
- Gregorc A, Lokar V. Selection criteria in an apiary of carniolan honey bee (Apis mellifera Carnica) colonies for queen rearing. Journal of Central European Agriculture. 2010;11(4):401-408.
- Abebe BA, Megerssa AT. Assessment of post-harvest handling and quality of honeybee products along the value chain in SNNPR, Ethiopia. Int. J Agric. Food Sci. 2021;3(2):28-35. DOI: 10.33545/2664844X.2021.v3.i2a.54
- Rakesh K, Pramod M. Important traits for the selection of honey bee (Apis mellifera L.) colonies. Journal of Entomology and Zoology Studies. 2018;6(3):906-909.
- Schneider SS. Nest characteristics and recruitment behavior of absconding colonies of the African honeybee, Apis mellifera scutellata, in Africa." Journal ofInsect Behavior, 1990 Mar;3(2):225-240.
- Tadele A, Gemechis L, Zewdu A. Performance Evaluation of Honeybee (Apis mellifera scutellata) in Guji Zone Gary. International Journal of Innovation and Applied Studies. 2014 Dec;9(4):1987-1993.
- Tesfa Mossie, Kasabiratu. Performance evaluation of local honey bee races under in -situ and ex-situ agroecological zones of Ethiopia, Academic Journal of Entomology. 2019;12(1):09-13.
- Büchler R, Uzunov A, Kovačić M, Prešern J, Pietropaoli M, Hatjina F, et al. Summer brood interruption as integrated management strategy for effective Varroa control in Europe. Journal of Apicultural Research. 2020 Oct 19;59(5):764-73.
- Gary RA, Dunbar SB, Higgins MK, Musselman DL, Smith AL. Combined exercise and cognitive behavioral therapy improves outcomes in patients with heart failure. Journal of psychosomatic research. 2010 Aug 1;69(2):119-31.
- Bezabeh A. Multivariate morphometric analysis and behaviour of Honeybees (Apis mellifera L.) in the Southern Regions of Ethiopia (Doctoral dissertation, PhD dissertation, Rhodes University, South Africa), 2002.
- Kebede D. Testing colonies of India honey bees Apis cerana for hygienic behavior, (MSc Thesis). Bangalore: Department of Apiculture of Agricultural Science, 2006, 26-28.
Cited by 2
From OpenAlex, OpenCitations and reference lists read by Scinovex
- EVALUATION OF PRODUCTIVE AND REPRODUCTIVE PERFORMANCE OF HONEYBEE COLONIES (Apis mellifera monticolla) IN SOUTH WOLLO, AMHARA, ETHIOPIA ↗
Wubalem Alebachew, Berhan Tamir, Tadesse Amare 3 and Amssalu Bezabh4 · Agrobiological Records · 2024
Despite the country's potential for apicultural resources, native races, productive and reproductive performances are at relatively low levels.Numerous factors, including environmental factors and honeybee races, may be to blame for this.As a result, this study was carried out to assess local honeybee race performance and choose the best colonies in the various agro ecologies of the study area.For this purpose,…
❝ 3PDF - Evaluation of Absconding Rate, Foraging and Defensive Behaviour in Apis mellifera monticola ↗
Wubalem Alebachew, Berhan Tamir, Tadesse AMARE, Amssalu Bezabh · Indian Journal of Entomology · 2024
Honey bee colonies display a wide range of behavioural variations based on their genetic origin and environmental factors. It is crucial to evaluate the absconding, foraging, and defensive behaviour of different honey bee races to lay the groundwork for future selection and improvement in Ethiopia. For this study, we kept 90 colonies of Apis mellifera monticolla, with 30 colonies/ agroecology,…
❝ 0PDF