
Research article · 2022 · Full text
International Journal of Statistics and Applied MathematicsMonetary policy transmission mechanism and the performance of manufacturing sector in U.S.A
Volume 7(4) · Pages 119–127 · DOI: 10.22271/maths.2022.v7.i4b.855 ↗
Research areasEnergy, Environment, Economic Growth
Abstract
Author-writtenThis paper empirically investigates monetary policy transmission channels and manufacturing sector performance in the United States using the Autoregressive Distributed Lag Model. 30 years of World Development Indicators time series data spanning from 1990 to 2020 were utilized despite numerous challenges. In the analysis, there are numerous findings. The results of the unit root test reveal that all transmission channel variables are stationary after the first difference. Consequently, the order series of variables are integrated at I (0) and I (1). This, of course, allowed the study to proceed with the co-integration test using the ARDL Bounds test, which demonstrated a long-term relationship between monetary policy transmission channels and manufacturing sector performance in the United States. Because the variables under consideration are co-integrated, the researchers estimated the long-run test using the ARDL method and the ECM. The baseline result of the ECM model indicates that the money supply and manufacturing sector performance in the United States has a significant positive short-run relationship. In contrast, the other variables utilised in this study have a significant negative short-run relationship. The study suggests that the Federal Reserve of the United States employ an expansionary monetary policy to increase the money supply to the real sectors and improve the performance of the US economy. The Federal Reserve should reduce the MPR to attract low-interest rates that will increase credit and boost productivity across all US industries. Different monetary policy instruments affect industrial outputs in the United States, as demonstrated by the findings. Under guided deregulation, the Federal Reserve should employ a distinct set of monetary policy guidelines for each sector of the United States. The imposition of CRR on financial institutions, particularly Deposit Money Banks, would impede economic growth.
Summary
Source-checkedPlain-language reading of the full paper, prepared with AI and checked against the text. Each point links to the authors' own words.
Why it matters
- Manufacturing is a critical driver of economic growth in the United States, accounting for 12% of the economy. View evidence ↗
- The monetary policy transmission mechanism describes the specific processes through which central bank decisions actually impact the real economy. View evidence ↗
The question
- The study aims to investigate how the Federal Reserve's monetary policy transmission mechanism affects the U.S. manufacturing sector. View evidence ↗
What they did
- The researchers used 30 years of time series data from the World Development Indicators, covering the period from 1990 to 2020. View evidence ↗
- The study analyzed manufacturing sector output (MSO) as the dependent variable against independent variables including the Monetary Policy Rate (MPR), Cash Reserve Ratio (CRR), Treasury Bill Rate (TBR), and Exchange Rate. View evidence ↗
- The analysis employed the Augmented Dickey-Fuller (ADF) test for stationarity, the ARDL bounds test for co-integration, and an Error Correction Model (ECM) for estimation. View evidence ↗
What they found
- Unit root tests showed that variables were stationary at either order I(0) or I(1), justifying the use of the ARDL bounds test. View evidence ↗
- The ARDL bounds test yielded an F-statistic of 5.271975, which exceeded the critical bounds at both 5% and 10% levels, indicating a long-term relationship between the variables. View evidence ↗
- In the long run, money supply had a positive and significant effect, where a one-unit increase led to a 0.0475-unit increase in manufacturing performance. View evidence ↗
- The Treasury Bill Rate was found to have a statistically significant negative relationship with manufacturing sector performance in the long term. View evidence ↗
- Short-run results from the ECM showed that the Monetary Policy Rate (MPR) has a significant negative impact, with a one-unit increase causing a 0.139917 decrease in manufacturing performance. View evidence ↗
- The Cash Reserve Ratio (CRR) also showed a significant negative short-run link, where a unit increase resulted in a 0.098595 decline in production. View evidence ↗
- The system corrects short-run disequilibrium in manufacturing sector output to long-run equilibrium at a rate of 111% per quarter. View evidence ↗
What it means
- The authors recommend that the Federal Reserve use expansionary monetary policy, specifically increasing money supply and reducing the MPR, to boost industrial productivity. View evidence ↗
- The authors suggest that removing the Cash Reserve Ratio (CRR) requirement for deposit money banks could help prevent the inhibition of economic progress. View evidence ↗
Visual summary
1 visualsIllustrations explain the paper; charts are replotted from the paper's own table values.
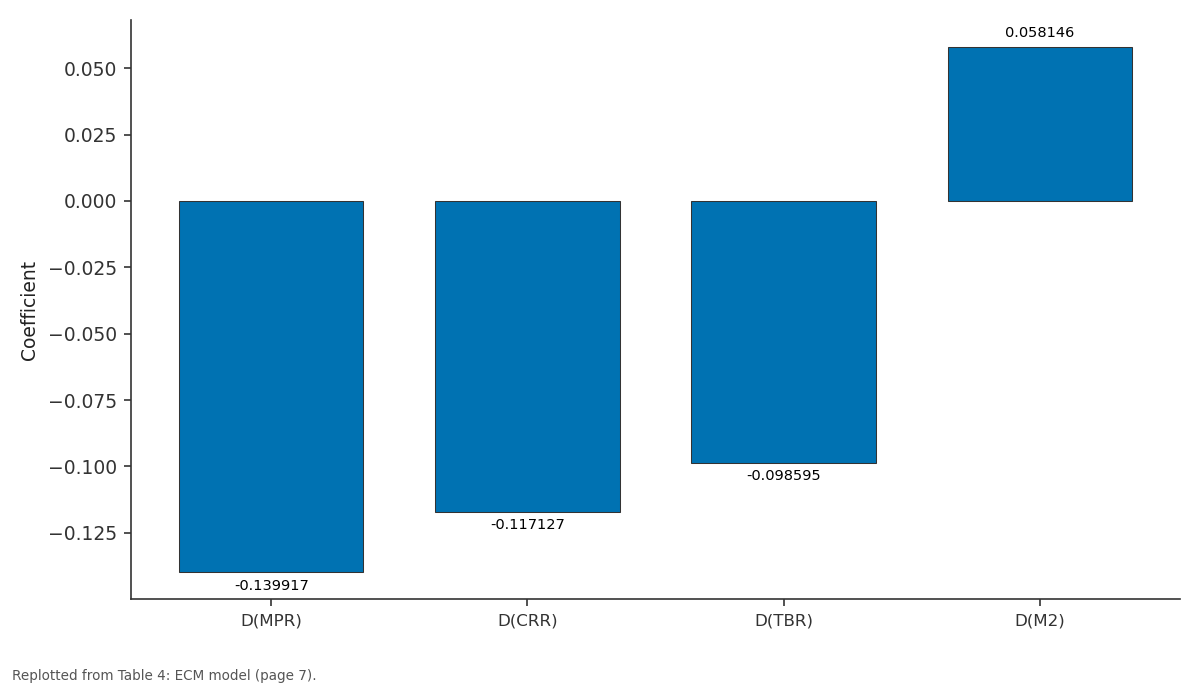
Coefficient: D(MPR) vs D(CRR) vs D(TBR) vs D(M2)
Replotted from Table 4 (page 7) of the original paper. Every bar is the paper's own table value.
View source evidence ↗Figures & tables
From the original paper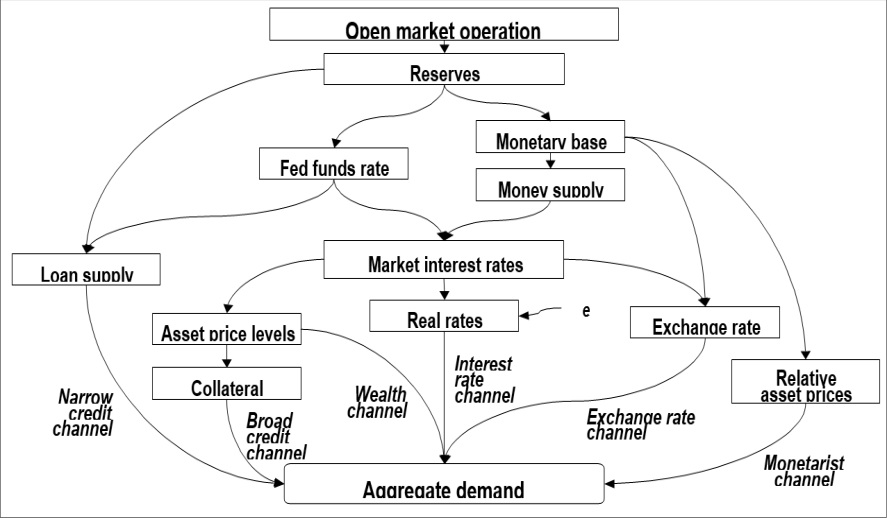 Figure 1
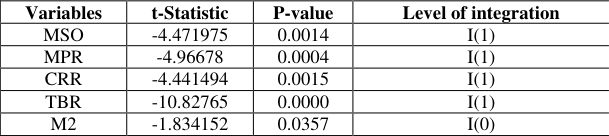 Table 1
 Table 2
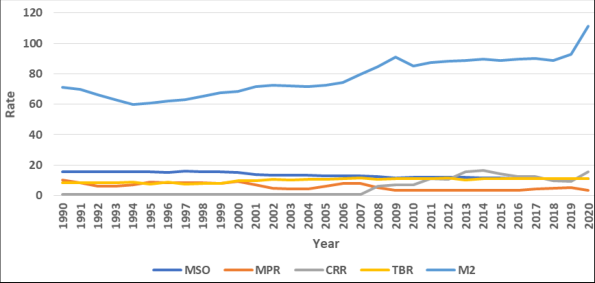 Figure 2
 Table 3
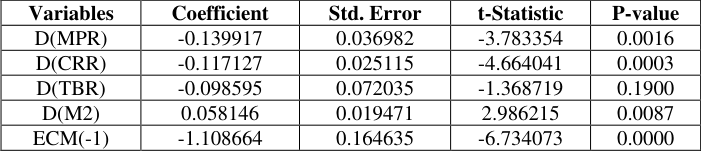 Table 4
Introduction
A significant majority of today's industrialized economies have developed expertise in "manufacturing," which refers to the process of transforming raw materials into finished goods. This has a connection to industrialization, which Adekunle, Alalade, and Okulenu (2016) [1] explain as a strategy for fostering economic growth and development by the explanations provided by economic development theories. As a direct consequence of this, there are policies in place that are intended to encourage the expansion of the manufacturing sector and, by extension, industrialization. In the context of the industrialization process, monetary policy is undeniably an important instrument. The term "monetary policy" refers to the management instruments that are developed by the monetary authority of a country, which is typically the central bank, to regulate the availability, value, supply, and cost of credit/money in the economy to achieve macroeconomic objectives or targets (Akomolafe et al., 2015) [3] . It is a term that simply refers to the management of the total amount of money that is available in a particular economy as well as the channels through which it is distributed (Charisma, Lucky, and Matthew, 2018) [22] . The most widely used monetary policy instruments are known as Open Market Operations (OMO), the discount rate, reserve requirements, and interest on reserves. The increase in factory production that has taken place over many years in the United States has been a significant driver of economic growth. According to the statistics, manufacturing makes up 12 per cent of the economy in the United States and is supported by the robust demand for goods.
According to Egbulonu and Ukwuoma (2018) [25] , the operators who use mechanical, physical, or chemical processes to transform raw materials into finished goods make up a portion of the manufacturing sector in the United States. People who assemble new and innovative products from their parts are also included. Manufacturing activities in the United States include, but are not limited to: the production of food and beverages; the manufacturing of petroleum and chemical products; the production of transportation machinery and machinery equipment; the production and manufacturing of metals and minerals; the production of computer, electronic, and electric equipment and componentry; the production of textiles, apparel, and other mills and manufacturing; and other manufacturing activities (Khaysy and Gang 2017) [35] . According to the statistics for the secondary market in the United States, the manufacturing sector contributed 2.27 trillion dollars to the country's GDP (gross domestic product) in 2020, with the chemical products industry providing the highest contribution at 401.5 billion dollars. The sale of computers and electronic goods brought in $310.8 billion, which was followed by the sale of food and beverage products at $273.5 billion, machinery at $154.8 billion, petroleum and coal products at $100.9 billion, electrical equipment, appliances, and components at $63.5 billion, etc. Transmission of monetary policy is the term used to describe the processes and procedures that are responsible for the effects of monetary policy on the economy (McCallum 2000) [40] . Figure 1 is a schematic representation of the monetary policy transmission process, which focuses on the primary channels by which monetary policy is communicated to the real economy. Starting the process is the transmission of open market activities through the reserves market to market interest rates. From there, it transmits through one or more of the wealth channels, interest rate channels, monetarist channels, narrow credit channels, broad credit channels, and exchange rate channels to the real economy, which is represented by aggregate demand. The primary objective of this study is to investigate the processes through which the monetary policy of the Federal Reserve affects the manufacturing sector of the economy in the United States.
Aim of the study
The primary goal of this research is to investigate how the United States' manufacturing sector has been affected by the monetary policy transmission mechanism. The general goal was broken down into smaller goals as follows: Objectives To investigate the impact of monetary policy rates on the performance of the manufacturing sector in the United States. To investigate the impact of money supply on the performance of the manufacturing sector in the United States. To investigate the impact of the cash reserve ratio on the performance of the manufacturing sector in the United States. To investigate the impact of the Treasury bill rate on the performance of the manufacturing sector in the United States.
Review of relevant literature 2.1 Conceptual framework 2.1.1 Monetary transmission mechanism
The monetary transmission mechanism has been defined in many ways by various authors. According to Peek and Eric (2010) [47] , the monetary transmission mechanism is the process by which various monetary decisions influence an economy, particularly the price level. According to Bjornland and Jacobson (2010) [12,13,14,15,16,17,18] , the monetary policy transmission mechanism is the process by which monetary policy decisions influence the values of assets and the economic activities of a country. Such decisions are made, in the opinion of Demary (2010) [23] , in order to impact aggregate demand, interest rates, and the quantity of money available for expenditure in an economy. Korobilis (2013) [36] , has it that monetary policy decisions determine the amount of credit available to the economy agent, which has an impact on the economy's overall performance. The classic monetary transmission mechanism is the interest rate channel, which influences interest rates, borrowing costs, investment levels, and aggregate demand. Gelain and Lansing (2013) [27] opines that the monetary policy transmission mechanism connects monetary policy and aggregate demand. Ncube and Ndou (2011) [45] stated that the loan channel can also be a factor of aggregate demand on this basis. According to Guerrieri and Iacoviello (2013) [29] , the government uses monetary policy, among other policies, to regulate the activities of an economy through the apex bank in a country, which in the case of the United States is the Federal Reserve, in order to achieve economic stability and improve the economy's growth rate. According to Balcilar, Gupta, and Miller (2015) [4,6,8,10] , monetary policy is the government's effort, through the country's central bank, to regulate the volume of money supply, cost of credit, size of credit, and direction of credit to influence the performance and activities of the economy to achieve the desired outcome. According to Gupta et al. (2012) [30] , there are two sorts of monetary policies that the government can deploy through the central bank to control the money supply in an economy. The expansionary and contractionary monetary policies are the following: (Bjornland and Jacobson, 2010) [12,13,14,15,16,17,18] . The objective of an expansionary monetary policy, according to Liu, Wang, and Zha (2013) [37] , is to increase the money supply in an economy. The economy is marked by a low money supply, low money velocity, and low employment, all of which contribute to a low money velocity. To tackle the danger, the government will increase the money supply. Using the interest rate channel, Peek, Joe, and Eric (2010) [47] noted that the government will reduce interest rates through the central bank, which will encourage investors to borrow more to invest, leading to an increase in employment, which in turn leads to an increase in income and aggregate demand, resulting in a high money velocity (Gelain and Lansing, 2013) [27] . The apex bank also exploits the credit channel as noted by Zhou and Carroll (2012) [56] , where more credit is made available and interest rates are lower. When aggregate demand is low in comparison to aggregate supply, an expansionary monetary policy is appropriate. When the supply of money is lowered, money income will rise slowly, causing investment expenditures to rise slowly, resulting in a decrease in aggregate investment.
Monetary Transmission Channels
Monetary policy is broadcast through five channels: The Interest rate channel, the credit channel, the Exchange rate channel, the Balance sheet channel, the Expectations channel, and the Asset price channel. Below are descriptions of the Credit and Interest rate channels.
Money Supply
The total amount of money in circulation at any given time in a specific nation is referred to as the money supply, according to Banbura, Giannone, and Reichlin (2010) [5,7,9,11] . According to Ncube and Ndou (2011) [45] , the money supply is the total amount of cash and other liquid assets present in an economy on the measurement date. Cash and deposits with a cash equivalent make up the majority of the money supply. According to the United States Federal Reserve, three different categories make up the total money supply: M1, which includes currency in circulation plus current account deposits with commercial banks, M2, which includes M1 plus savings and time deposits, and M3, which includes M1 plus savings and time deposits. The central bank will raise interest rates to lessen the impact of deposit money banks. An expansionary monetary policy, however, will have the opposite effect (Alalade and Okulenu, 2016). The Federal Reserve's definitions of money are consistent with these categories of the money supply (Khaysy and Gang, 2017) [35] . The M3 money supply, according to Gurley Shaw, is made up of M2 plus near money. Over time, there has been a significant instability in the relationship between different measures of the money supply and various factors, including inflation and GDP growth (Charisma, Lucky and Matthew, 2018) [22] . As a result, financial metrics have lost importance in the United States (Egbulonu and Ukwuoma, 2018) [25] . The Federal Open Market Committee, the body responsible for setting monetary policy at the Federal Reserve System, continues to regularly review data on the money supply, according to Korobilis (2013) [36] . Money supply statistics are just one type of financial and economic data that policymakers take into account, though. The money supply, in Milton Friedman's view, determines both the long-term level of prices and inflation as well as important information about the economy's direction shortly. At times, central banks have relied heavily on measures of the money supply as a direction for monetary policy, most notably the Federal Reserve. Dollar bills and coins, which are produced by the Federal Reserve and the US Treasury, are included in the US money supply, according to Forni and Gambetti (2010) [41] . The public's various types of deposits held at commercial banks and other deposit money institutions like thrifts and credit unions make up the majority of the money supply in the United States, according to Canova and Paustian (2010) [26] . The Federal Reserve manipulates the economy's money supply to control the base money. Currency, coins that are not part of the banking system, and Federal Reserve bank deposits make up the money base, according to Dave, Dressler, and Zhang (2013) [20] . The money supply will be decreased by lowering the base money if the Federal Reserve decides there is too much money in circulation and a high velocity of money. To shrink the monetary base and limit the ability of deposit money institutions to print new currency, the Federal Reserve sells securities to banks and non-bank consumers. Canova and Paustian (2010) [26] also point out that the Federal Reserve can control the amount of money in circulation by raising the number of cash reserves that commercial/deposit banks are required to hold at the Federal Reserve. Peretti, Gupta, and Inglesia-Lotz (2012) [48] assert that deposit money banks' capacity to generate new money in the economy rises as their cash balance rises. The Federal Reserve aims to control inflation by monitoring the growth of deposit balances in deposit-taking institutions.
Monetary Policy Rate
According to Korobilis (2013) [36] , the monetary policy rate serves as the basis for all other interest rates, and it is also the factor that determines how freely money can move throughout an economy at any given moment. According to Zhou and Carroll (2012) [56] , the apex bank of a country, which in this case is the Federal Reserve, is the institution responsible for determining the interest rate that will be used for monetary policy. The ability of financial institutions to borrow money from the central bank is contingent on the short-term interest rate. When the Federal Reserve increases the rate at which it conducts monetary policy, the money supply will experience a contraction (Boivin, Kiley and Mishkin, 2010) [33] . When the Federal Reserve lowers the monetary policy rate, the situation will be exactly the opposite of what was described above. Because it is based on the monetary policy focus, the decision to tighten or loosen the money supply in an economy is made by the central bank that has the most power. The annual percentage rate of interest in the United States was 0.50 per cent in 2015, 0.75 per cent in 2016, 1.50 per cent in 2017, 2.50 per cent in 2018, and 1.75 per cent in 2019. This information comes from Statista. The monetary target was reportedly adopted as a monetary policy direction by several central banks around the world between the years 1970 and 1980, according to the history of this topic. According to the explanation provided by Ncube and Ndou (2011) [45] , a monetary target is an effort made by the central bank to determine the optimal stock of money that is available in an economy to accomplish the desired macroeconomic goals. On a theoretical basis, the decision between monetary aggregates and interest rate is typically the one to make regarding the target. According to Nakajima (2011) [44] , when the aggregate demand function is unstable, the interest rate is typically the desired objective; otherwise, the money stock becomes the optimal target (Khaysy and Gang, 2017) [35] . In the early 1990s, certain apex banks used numerical inflation or nominal GDP as guidance for monetary policy, which was different from the traditional choice of interest rate or money stock, as noted by Mian, Rao, and Sufi (2013) [42] . The traditional choice was to base monetary policy decisions on the interest rate or money stock. This shift was attributed by some notable economists (Muhammad, 2014; Ogunbiyi and Ihejirika, 2014) [43,46] to the inaccuracy of monetary aggregates as a guide for monetary policy.
Treasury bill rate
According to Ogunbiyi and Ihejirika (2014) [46] , the Treasury bill rate serves as a surrogate for the return on the government's debt instrument. According to Buysse (2002) [19] , high Treasury bill interest rates will increase commercial bank investment in government instruments. Alternatively stated, a high Treasury bill rate will encourage commercial banks to invest in government treasury bills, resulting in a positive correlation between the Treasury bill rate and bank investment. Additionally, a high Treasury bill rate is likely to reduce the amount of money available in commercial banks (Tregenna, 2015) [53] . Consequently, loan and advance interest rates would be substantial. According to Korobilis (2013) [36] , a Treasury bill is a short-term borrowing instrument used by the government to raise money through the Federal Reserve for one year or less. To attract investors' returns, Treasury bills are sold at a discount and redeemed at face (par) value (Antony, 2015).
Cash Reserve Ratio
The Cash Reserve Ratio is the proportion of total deposits that commercial banks, in this case, the Federal Reserve, must hold in the central bank (Dave, Dressler and Zhang, 2013) [20] . According to Ditimi, Wosa, and Olaiya (2011) [24] , the objective is to prevent a shortage of funds used to meet depositor demands. The bank's experience is crucial in determining the reserve amount (Gideon and Joseph, 2019) [28] . Since the sole objective of commercial banks is to maximize profits, the absence of the Cash Reserve Ratio would have prompted them to store more cash to extend more loans and increase profits. According to Ifionu and Akinpelumi (2015) [32] , this would lead to an excess of money in the economy, resulting in inflation. According to Gupta et al., this may cause a banking industry financial crisis (2012). To prevent this, the Federal Reserve implements the Cash Reserve Ration. The Cash Reserve Ratio, also known as the Statutory Reserve Ratio, is a legal requirement. As Liu and Morley point out, the Federal Reserve can reduce or increase the money supply in an economy using this ratio (2014). When economic conditions necessitate a contractionary monetary policy, the Federal Reserve would increase the Cash Reserve Ratio, which would result in higher interest rates, decreased physical investment, and consequently reduced aggregate demand. When the Federal Reserve adopts an expansionary monetary policy, the current state of affairs will reverse.
Manufacturing Sector Output
The manufacturing sector, as defined by the US government, includes companies that take part in the mechanical, physical, or chemical transformation of materials, substances, or parts into new products; businesses that assemble parts are not included in this definition. The manufacturing industry has long been a driving force behind the economic expansion in the US, to the point where productivity growth in import and export growth has been excessive (Chang and Andreoni, 2021) [21] . The increase in aggregate demand, employment, per-capita income, and foreign exchange earnings, as a result, have led to economic growth. According to Szirmai and Verspagen (2015) [52] , the manufacturing sector boosts investment capital more quickly than any other area of the economy because it promotes strong connections across sectors. The US has several policies in place to increase output and expand manufacturing exports, including those of electrical equipment, machinery, and computer and electronic products, as a result of its recognition of the advantages this sector offers (Marconi, Borja, and Arajo, 2016) [38] . The manufacturing industry employs approximately 8.51 per cent of the labour force in the United States, according to statistics. As of the most recent data, manufacturing contributed 11.39 per cent of the US economy's overall output in 2018.
Theoretical Framework
This study is based on Irving Fisher's 1920 publication, The Quantity Theory of Money, which states that the amount of money in an economy ultimately determines the price level or value of the currency. As a result, there is a proportionate relationship between the value of money and the amount of it in an economy; a change in the amount of money in circulation results in an exact proportionate change in the level of prices. According to Irving Fisher, "the value of money declines, ceteris paribus, as the amount of money in circulation rises, and the price level rises in direct proportion." The price level doubles with a doubling of the money supply and falls in value by a doubling and vice versa. It is crucial to understand that inflation is characterized as an increase in the general level of prices. According to the quantity theory of money, sticky interest rates can help with short-term monetary management, but real cash balance is what people want in terms of influence over time (Fisher 1932). Fisher also devised his own exchange equation, which is as follows:
MV=PT
Where: M= the actual money stock (money supply) V= the transaction velocity of circulation of money P= the average price level T= the number of transactions made per period V and T are assumed to be constant in the theory, therefore a change in M has a direct impact on P. To put it another way, when the money supply expands, the average price level tends to grow in lockstep with the impact on real economic activity. Thus, if the Federal Reserve (Fed) doubles the money supply in the United States, long-run prices in the economy will tend to rise, since more money would circulate in the system, resulting in increased consumer demand and spending, driving prices higher and causing inflation.
Empirical Review
The transmission process and performance of the industrial sector in the United States have been the subject of numerous empirical studies. Using an ex-post facto research design and secondary data from World Development Indicators and Statista, Hussain (2014) [31] investigated the impact of monetary policy on the performance of the manufacturing sector in the United States. The yield on Treasury bills, the cash reserve ratio, and the monetary policy rate were independent variables. The studies took place between 1990 and 2019. With the Phillip Perron, the diagnostic test was carried out, and it was discovered that it was stationary both at the level and after initial differencing. The model was estimated using ARDL as a data analysis technique. The significant short-and long-term effects of monetary policy tools have been found. The impact of monetary policy on the growth rate of Poland's manufacturing sector from 1985 to 2020 was also studied by Kapuscinski et al. (2015) [34] . The money supply and interest rate were used as dependent variables, and the exchange rate represented the external economy. The World Development Indicators were used in this study as a secondary data source. The Johansson cointegration test and the VECM were evaluated to see if they should be used for model estimation using the ADF test. The results show that the short-term growth of the manufacturing sector is significantly and positively influenced by the money supply. In contrast, there is a statistically significant inverse relationship between the exchange rate and the expansion of the manufacturing sector. It was found that interest rates had a weak and unimportant negative correlation with the expansion of Poland's manufacturing sector. Pesaran, Shin, and Smith (2001) [49] looked into the industrial effects of monetary policy transmission channels in the United States. GDP growth was the dependent variable, and the independent variables were an investment, monetary policy, exchange rate, money supply, and interest rates on loans. The Phillip Perron diagnostic test was then applied to these variables after he obtained these secondary data from Statista. The model was estimated using the ADF. According to the findings, there is a longterm relationship between the growth of real production in the industrial sector and monetary transmission channels in the US, and system disequilibrium is corrected at a rate of 65%. A further empirical study on the influence of monetary policy on the growth of the manufacturing sector in the US from 1998 to 2019 was carried out by Williams and Robinson (2014) [54] . Secondary data were used in this research project for WDI. The output of the manufacturing sector was the dependent variable, and the independent variables were the money supply, exchange rate, and interest rate. Data integration at orders 0 and 1 were revealed by the unit root test, demonstrating the suitability of the ARDL bounds test for cointegration. A stable relationship between the dependent and independent variables was demonstrated by the limits test. The manufacturing sector's output and the money supply have a significant and positive correlation, according to an analysis of the data using the ARDL model. Over the long and short terms, there was a negative and significant correlation between interest rates and manufacturing sector performance. Not least, the exchange rate continued to be statistically significant and negative.
Methodology
Research design, according to Ahuja (2010) [2] , is a framework for collecting and analyzing data for a study. The study used secondary data from the World Development Indicator for the United States of America and an ex-post facto research design. The independent variables are the monetary policy tools that transmit to the real economy to determine the direction of the manufacturing sector's performance in the United States, while the dependent variable is the manufacturing sector output (MSO). Among them are the Exchange Rate, the Cash Reserve Ratio (CRR), the Treasury Bill Rate (TBR), and the Monetary Policy Rate (MPR) (EXCR).
Model Specification
The econometric model that will be used in the investigation is described in this section. The model used in this study is based on the quantity theory of money, which states that the velocity at which money is distributed has macroeconomic consequences for an economy, and so monetary policy instruments have an impact on the manufacturing sector. This model can be expressed as follows with minor changes: MSO=f (MPR, CRR, TBR, M2) ……………………….1 Re-writing equation ( 1) in an econometric form, we have the equation as:
Method of Data Analysis
In this study, the data will be examined using both descriptive and econometric methods. Graphs and tables were used as descriptive tools. However, multiple regression will continue to be the main tool for data analysis. The stationarity of the data will be examined using the Augmented Dickey-Fuller (ADF) test. Based on the test results, the Autoregressive Distributive Lag (ARDL) bounds test for co-integration will be carried out, and the Error Correction Model will be specified and estimated to ascertain how quickly the equilibrium will be restored in the case of disequilibrium. Data analysis using E-views will use the ARDL short-run relationship. In the research period, the manufacturing sector's production declined over time, reaching a low point in 2019, and then rebounded in 2020, as shown in the Figure 2 above. Furthermore, there have been cyclical fluctuations in the monetary policy rate. The monetary policy rate peaked in 1990, and from 2009 to 2014, there were numerous low points. Similarly, the Cash Reserve Ratio has increased and decreased throughout the study. The Cash Reserve Ratio is shown on the graph at both its lowest point in 2007 and its highest point in 2014. The graph also demonstrates how the Treasury Bill Ratio has been steadily rising over time, peaking in 2012 after reaching a low point in 1997. Finally, there has been an increase in the money supply. This was because the Federal Reserve wanted to achieve macroeconomic goals by stabilizing the economy and boosting money velocity. Even though it hit a low point in 1993, the value of money has been increasing since then. The diagnostic test that followed the Augmented Dickey Fuller test is summarized in the table above. The variables were both level and after first differencing stationary, as seen above. Order zero I(0) and order one I(1) variables, to put it another way. The use of the ARDL limits test to determine if the variables are co-integrated is justified in this case. The US Monetary Policy Rate has a negative and statistically significant relationship with manufacturing sector output, according to long-term estimates. According to the coefficient, a one-unit increase in the Monetary Policy Rate reduces manufacturing sector output by 0.0623039 units. In addition, the coefficient of the Cash Reserve Ratio is negative and statistically insignificant. Similarly, the Treasury Bill Rate has a negative and statistically significant relationship with manufacturing sector performance over the long term. In the table above, the money supply demonstrated a positive and statistically significant correlation with manufacturing sector output. According to the coefficient, a one-unit increase in money supply will result in a 0.0475-unit increase in manufacturing sector performance. We perform the short-run test on this base. The findings suggest that the model is a good fit, as indicated by the R2 of 0.76 and an adjusted R2 of 0.67 in the table above. This implied that the independent variables account for 76 percent of the variation in the dependent variable (MSO). The Durbin Watson value of 1.99 in the ECM result also indicates that the model is free of autocorrelation. Furthermore, the ECM result revealed that the ECM coefficient is statistically significant and bears the right sign. The ECM coefficient of -1.108664 indicates that the evidence of long run relationships among variables is consistent, and it means that given any disequilibrium in manufacturing sector output, the system will correct itself from the short run to long run equilibrium at a rate of 111 percent every quarter.
Data presentation and analysis
Data presentation and analysis
Dependent variable: Manufacturing sector output (MSO)
Dependent variable: Manufacturing sector output (MSO)
Discussion of findings
Given the ECM result, the coefficient of the Monetary Policy Rate was -0.139917 and the probability value was 0.0016, it was determined that the monetary policy rate was negative and statistically significant. As a result, a unit rise in MPR will result in a 0.139917 drop in manufacturing sector performance. This conclusion is consistent with the a-priori expectation. Furthermore, from the ECM result, it was discovered that the Cash Reserve Ratio has a negative and statistically significant link with manufacturing sector production. The probability value of 0.0003 and the coefficient of -0.098595 indicate this. This suggests that for every unit increase in CRR, the manufacturing sector production will decline by 0.098595. The above-mentioned a-priori expectation appears to be met with this result. The Treasury Bill Rate was discovered to have a negative, statistically insignificant connection with manufacturing sector performance. The coefficient was -0.098595 and the probability value was 0.1900, confirming the insignificance threshold. Similarly, from the ECM result, it was discovered that money supply had a positive and statistically significant association with manufacturing sector production. The coefficient of 0.058146 indicated that a unit increase in money supply would result in a 0.058146 increase in manufacturing sector performance. The probability value, which was 0.0000, corroborated the level of significance. This conclusion is consistent with the a priori expectation. Overall, the findings showed that in the United States, monetary transmission channels have a long-run relationship with manufacturing sector performance, and system disequilibrium is corrected at a rate of 111 percent.
Conclusion and Recommendation 5.1 Conclusion
This article examined the monetary transmission mechanism and the industrial sector in the United States from 1990 to 2020. To achieve the stated objectives of the study, the Iven Fisher Quantity Theory of Money was applied. According to the findings, the performance of the manufacturing sector has been significantly affected by the monetary transmission mechanism. Specifically, the Monetary Policy Rate, Cash Reserve Ratio, and Money Supply had substantial effects on manufacturing sector performance, while the Treasury Bill Rate had a negligible effect. The results indicated that both the Monetary Policy Rate and the Cash Reserve Ratio were negative and statistically significant, whereas the Money Supply was positive and statistically significant and the Treasury Bill Rate was negative and statistically insignificant. Our findings largely confirm our a priori hypotheses and are consistent with the vast majority of research demonstrating a negative effect of MPR, CRR, and TBR on manufacturing sector performance and a positive effect of M2.
Recommendation
The US government should ensure that these monetary policies are implemented in order to achieve a more stable economy.
In addition, The Federal Reserve should continue to employ adjustments in its monetary policy rate as a policy technique to alter credit availability and accessibility by the productive sector of the economy. Changes in the credit market and institutions will occur as a result of such initiatives. Because of this process, interest rates and credit channels will have a favorable impact on the economy. The Federal Reserve of the United States should pursue an expansionary monetary policy that increases the money supply in the actual economy and boosts the performance of the US economy. The Federal Reserve should cut the MPR to attract lowinterest rates that will encourage credit and increase productivity across all U.S. industries. As demonstrated by the findings, the various monetary policy instruments have diverse effects on U.S. manufacturing outputs. The Federal Reserve should employ different sets of monetary policy directives for each sector in Nigeria under guided deregulation. Financial institutions, particularly Deposit Money Banks, should not be bound by CRR, as this could inhibit economic progress.
Figures and tables from the paper
| Variables | t-Statistic | P-value | Level of integration |
|---|---|---|---|
| MSO | -4.471975 | 0.0014 | I(1) |
| MPR | -4.96678 | 0.0004 | I(1) |
| CRR | -4.441494 | 0.0015 | I(1) |
| TBR | -10.82765 | 0.0000 | I(1) |
| M2 | -1.834152 | 0.0357 | I(0) |
Table text extracted from the original PDF; superscript letters are shown inline. The original table image is below.
View original table image
| Model | — | F-statistic |
|---|---|---|
| MSO=f(MPR, CRR, TBR,M2) | 5.271975 | |
| Critical values | Lower Bound | Upper Bound |
| 10% | 2.2 | 3.09 |
| 5% | 2.56 | 3.49 |
Table text extracted from the original PDF; superscript letters are shown inline. The original table image is below.
View original table image
| Variables | Coefficient | Std. Error | t-Statistc | P-value |
|---|---|---|---|---|
| MPR | -0.062039 | 0.045339 | -1.368326 | 0.1872 |
| CRR | -0.016207 | 0.022221 | -0.729392 | 0.4747 |
| TBR | -0.848025 | 0.087848 | -9.653327 | 0.0000 |
| M2 | 0.047555 | 0.012536 | 3.793564 | 0.0012 |
Table text extracted from the original PDF; superscript letters are shown inline. The original table image is below.
View original table image
| Variables | Coefficient | Std. Error | t-Statistic | P-value |
|---|---|---|---|---|
| D(MPR) | -0.139917 | 0.036982 | -3.783354 | 0.0016 |
| D(CRR) | -0.117127 | 0.025115 | -4.664041 | 0.0003 |
| D(TBR) | -0.098595 | 0.072035 | -1.368719 | 0.1900 |
| D(M2) | 0.058146 | 0.019471 | 2.986215 | 0.0087 |
| ECM(-1) | -1.108664 | 0.164635 | -6.734073 | 0.0000 |
Table text extracted from the original PDF; superscript letters are shown inline. The original table image is below.
View original table image
References
55 in the original paper- Adekunle OA, Alalade YSA, Okulenu SA. Macro-economic variables and its impact on Nigerian capital market growth: IIARD International Journal of Economics and Business Management. 2016;2(2):5-17.
- Ahuja Ram. Research Method, New Delhi: Rawat Publication, 2010, 125.
- Akomolafe KJ, Danladi JD, Babalola O, Abah AG. Monetary policy and commercial banks" performance in Nigeria: Public Policy and Administration Research. 2015;5(9)45-63.
- Balcilar M, Gupta R, Miller SM. Regime switching model of US crude Oil and stock market prices: 1859-2013. Energy Economics. 2015;49:317-327.
- Banbura M, Giannone D, Reichlin L. Large Bayesian vector auto regressions. Journal of Applied Econlogy. 2010;25:71-92.
- Balcilar M, Gupta R, Miller SM. Regime switching model of US crude Oil and stock market prices: 1859-2013. Energy Economics. 2015;49:317-327.
- Banbura M, Giannone D, Reichlin L. Large Bayesian vector auto regressions. Journal of Applied Econlogy. 2010;25:71-92
- Balcilar M, R, Miller SM. Regime switching model of US crude Oil and stock market prices: 1859-2013. Energy Economics. 2015;49:317-327.
- Banbura M, Giannone D, Reichlin L. Large Bayesian vector auto regressions. Journal of Applied Econlogy. 2010;25:71-92.
- Balcilar M, Gupta R, Miller SM. Regime switching model of US crude Oil and stock market prices: 1859-2013. Energy Economics. 2015;49:317-327.
- Banbura M, Giannone D, Reichlin L. Large Bayesian vector auto regressions. Journal of Applied Econlogy. 2010;25:71-92.
- Bjørnland HC, Jacobsen DH. The role of house prices in the monetary policy transmission mechanism in small open economies. Journal of Financial Stability. 2010;6:218-229.
- Bjørnland HC, Jacobsen DH. The role of house prices in the monetary policy transmission mechanism in small open economies. Journal of Financial Stability. 2010;6:218-229.
- Bjørnland HC, Jacobsen DH. The role of house prices in the monetary policy transmission mechanism in small open economies. Journal of Financial Stability. 2010;6:218-229.
- Bjørnland HC, Jacobsen DH. The role of house prices in the monetary policy transmission mechanism in small open economies. Journal of Financial Stability. 2010;6:218-229.
- Bjørnland HC, Jacobsen DH. The role of house prices in the monetary policy transmission mechanism in small open economies. Journal of Financial Stability. 2010;6:218-229.
- Bjornland HC, Jacobson DH. The role of house prices in the monetary policy transmission mechanism in small open economics. Journal of Financial Stability. 2010;6:218-229.
- Bjornland HC, Jacobson DH. House prices and stock prices: Different Roles in the U.S. monetary transmission mechanism. The Scandinavian Journal of Economics. 2010;115:1044-1106.
- Buysse KDL. Human Capital and Growth in OECD Countries: The Role of Public Expenditure on Education. In The impact of Fiscal Policy; Banca d'Italia, Research Department, Public Finance Workshop: Perugia, Italia, 2002.
- Dave C, Dressler SJ, Zhang L. The Bank Lending Channel: A FAVAR Analysis Journal of Money, Credit, and Banking. 2013;45:1705-1720.
- Chang HJ, Andreoni A. Bringing Production Back into Development: An introduction. Eur. J. Dev. Res. 2021;33:165-178.
- Charisma GESI, Lucky T, Matthew B. Impact of money supply on some macroeconomic variables on the Nigerian economy: Journal of Business Management and Economic Research. 2018;2(5)23-54.
- Demary M. The interplay between output, inflation, interest rates and house prices. International Evidence Journal of Property Research. 2010;27(1):1-17.
- Ditimi A, Wosa PI, Olaiya SA. An Appraisal of Monetary Policy and Its Effect on Economic Growth in Nigeria? Asian Economic and Financial Review. 2011;3(5):5-46.
- Egbulonu KG, Ukwuoma CC. Impact of monetary policy on the growth of the Nigerian manufacturing sector: International Journal of Scientific & Engineering Research. 2018;9(9):2-58.
- Canova F, Paustian M. Measurement with Some Theory: A New Approach to Evaluate Business Cycle Models Barcelona Economics Working Paper Series Working Paper, 2010, 511.
- Gelain P, Lansing KJ. House prices, expectations and time-varying fundamentals. Federal Reserve Bank of San Francisco Working Paper. 2013-03
- Gideon TA, Joseph SO. Liquidity and the profitability of manufacturing firms in Nigeria: Applied finance and accounting. 2019;5(2):9-57.
- Guerrieri L, Iacoviello M. Collateral constraints and macroeconomic asymmetries. Mimeo, Boston College, 2013.
- Gupta R, Jurgilas M, Miller SM, Van Wyk D. Financial market liberalization, monetary policy and housing sector dynamics. International Business and Economics Research Journal. 2012;11(1):69-82.
- Hussain SI. Monetary Transmission Mechanism inPakistan: Credit Channel or Interest Rate Channel, JISR-MSSE. 2014;12(2):1-12.
- Ifionu E, Akinpelumi OF. Macroeconomic variables and money supply: Evidence from Nigeria. An International Multidisciplinary Journal. 2015;9(4):288-307.
- Boivin J, Kiley M, Mishkin F. How Has the Monetary Transmission Mechanism Evolved Over Time? NBER Working Paper, 2010.
- Kapuscinski M, Kociecki A, Kowalczyk H, Lyziak T, Przystupa J, Stanislawska A, et al et al. Monetary Policy Transmission Mechanism in Poland. What do we know in 2015? NBP Working Paper, 2015, 249.
- Khaysy S, Gang S. The impact of monetary policy on economic development: Evidence from Lao PDR: Global Journal of Human-Social Science: E Economics. 2017;17(2):10-21.
- Korobilis D. Assessing the transmission of monetary policy using time-varying parameter dynamic factor models. Oxford Bulletin of Economics and Statistics. 2013;75(2):157-179.
- Liu Z, Wang P, Zha T. Land-price dynamics and macroeconomic fluctuations. Econometrica. 2013;81:1147-1184.
- Marconi N, de Borja Reis CF, de Araújo EC. Manufacturing and economic development: The actuality of Kaldor's first and second laws. Struct. Chang. Econ. Dyn. 2016;37:75-89.
- Barigozzi M, Conti AM, Luciani M. Do Euro Area Countries Respond Asymmetrically to the Common Monetary Policy Oxford Bulletin of Economics and Statistics, 2013;76:693-714.
- McCallum Bennett S. Theoretical analysis regarding a zero lower bound on nominal interest rates. Journal of Money, Credit and Banking. 2000;32(4):870-904.
- Forni M, Gambetti L. The Dynamic Effects of Monetary Policy: A Structural Factor Model Approach Journal of Monetary Economics. 2010;57:203-216.
- Muhammad S. Effect of inflation and unemployment on economic growth in Pakistan. Journal of Economics and Sustainable Development. 2014;5(15):7.
- Nakajima J. Time-varying parameter VAR model with stochastic volatility: An overview of methodology and empirical applications. Monetary and Economic Studies, 2011, 107-142.
- Ncube M, Ndou E. Monetary policy transmission, house prices and consumer spending in South Africa: An SVAR approach. Working Paper 133, African Development Bank, 2011.
- Ogunbiyi SS, Ihejirika PO. Interest rates and deposit money banks profitability nexus: The Nigerian experience: Arabian Journal of Business and Management Review (OMAN Chapter). 2014;3(1):13-27.
- Peek Joe, Eric Rosengren S. The Role of Banks in the Transmission of Monetary Policy, in The Oxford Handbook of Banking, Allen Berger, Philip Molyneux, and John Wilson, eds. (Oxford: Oxford University Press), 2010.
- Peretti V, Gupta R, Inglesi-Lotz R. Do house prices impact consumption and interest rate in South Africa? Evidence from a Time Varying Vector Autoregressive model. Economics, Financial Markets and Management. 2012;4:101-120.
- Pesaran MH, Shin Y, Smith RJ. Bounds Testing Approaches to the Analysis of Level Relationships. Journal of Applied Econometrics. John Willey and Sons Ltd, 2001.
- Brady R. Consumer Credit, Liquidity, and the Transmission Mechanism of Monetary Policy, Economic Inquiry. 2011;49:246-263.
- Fry R, Pagan A. Sign Restrictions in Structural Vector Autoregressions: A Critical Review Journal of Economic Literature, 2011;49:938-960.
- Szirmai A, Verspagen B. Manufacturing and economic growth in developing countries, 1950-2005. Struct. Chang. Econ. Dyn. 2015;34:46-59.
- Tregenna F. Deindustrialization, structural change and sustainable economic growth. In MERIT Working Papers; Maastricht Economic and Social Research Institute on Innovation and Technology (MERIT), United Nations University: Maastricht, The Netherlands, 2015.
- Williams C, Robinson W. Evaluating the Transmission Mechanism of Monetary Policy in Jamaica: A Factor-Augmented Vector Autoregressive (FAVAR) Approach with Time Varying Coefficients. Research and Economic Programming Division, Bank of Jamaica, 2014, 1-22.
- Liu Y, Morley J. Structural Evolution of the Postwar U.S. Economy. Journal of Economic Dynamics and Control. 2014;42:50-68.
- Zhou X, Carroll CD. Dynamics of wealth and consumption: new and improved measures for U.S. states. The B.E. Journal of Macroeconomics. 2012;12:1-44.