
Research article · 2022 · Full text
International Journal of Statistics and Applied MathematicsApproach to hedonic model and analyzing factors affecting real estate prices in Hanoi
Volume 7(4) · Pages 101–104 · DOI: 10.22271/maths.2022.v7.i4b.849 ↗
Research areasHousing Market and Economics
Abstract
Author-writtenIn real estate valuation techniques and housing market research, real estate prices are often analyzed using The Hedonic model based on factors that affect real estate prices. The Hedonic model shows the factors that affect real estate prices. The determinants of real estate prices in Hanoi in this article use 240 observations. The variables that have the greatest influence on real estate prices are the location of the property, the area of the land, the area of the house, the distance from the property to the city center, and the distance from the property to the street frontage.
Summary
Source-checkedPlain-language reading of the full paper, prepared with AI and checked against the text. Each point links to the authors' own words.
Why it matters
- Real estate serves as both a primary shelter and a critical investment asset for many households. View evidence ↗
- Apartment values significantly influence household savings and consumption, making home prices a key concern for developers, banks, and policymakers. View evidence ↗
- The Hedonic model is a valuation technique used to identify the specific factors that influence real estate prices. View evidence ↗
The question
- The study aims to determine the factors affecting real estate prices in Hanoi using a sample of 240 observations. View evidence ↗
What they did
- The researchers studied 240 apartment samples randomly collected from six main routes in Hanoi. View evidence ↗
- Data was collected between April 1, 2021, and December 31, 2021, to reduce the impact of macroeconomic market fluctuations. View evidence ↗
- The analysis used a regression model with 10 variables: five related to position (location, distance to center, distance to frontage, facade width, and use) and five related to quality (land area, house area, floors, terrace, and shape). View evidence ↗
What they found
- Properties located on the street frontage are typically 84.68% more expensive than those located in alleys. View evidence ↗
- For properties in alleys, every additional meter of distance from the street frontage results in an average price decrease of 0.12%. View evidence ↗
- On average, the price of real estate decreases by 8.4% for every 1 km increase in distance from the city center. View evidence ↗
- An increase in land area of 1 square meter is associated with a 1.46% increase in property price. View evidence ↗
- Initial modeling showed multicollinearity and autocorrelation between the 'USE' and 'LOCATION' variables, with a correlation coefficient of 0.78. View evidence ↗
- The 'TERRACE' variable was removed from the model due to low statistical significance and a coefficient sign that contradicted expectations. View evidence ↗
What it means
- The authors conclude that land area, house area, and location-based distances (to center and frontage) are the most critical factors affecting property prices in Hanoi. View evidence ↗
Visual summary
1 visualsIllustrations explain the paper; they do not show study data.
Factors Influencing Hanoi Property Prices
AI-generated conceptual illustration (Urban residential buildings in Hanoi city). It explains the idea and does not show study data.
View source evidence ↗Figures & tables
From the original paper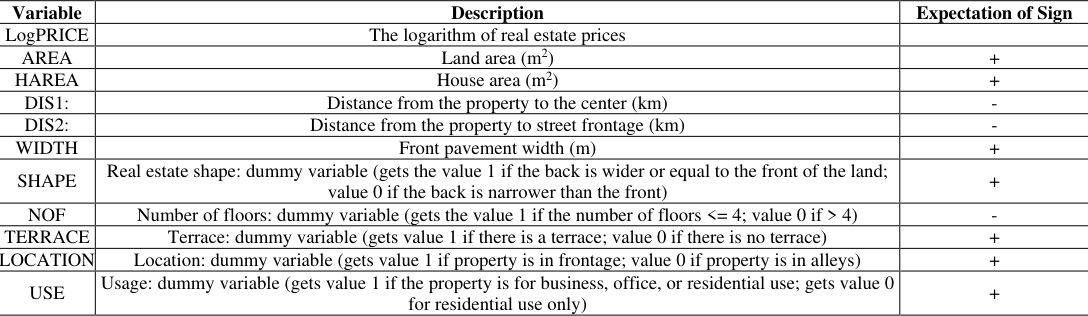 Table 1
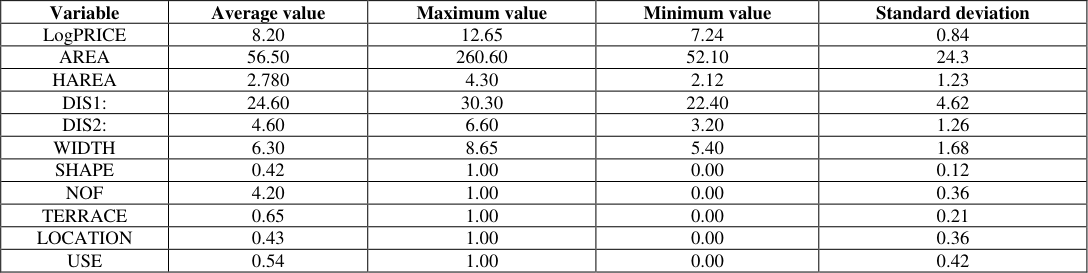 Table 2
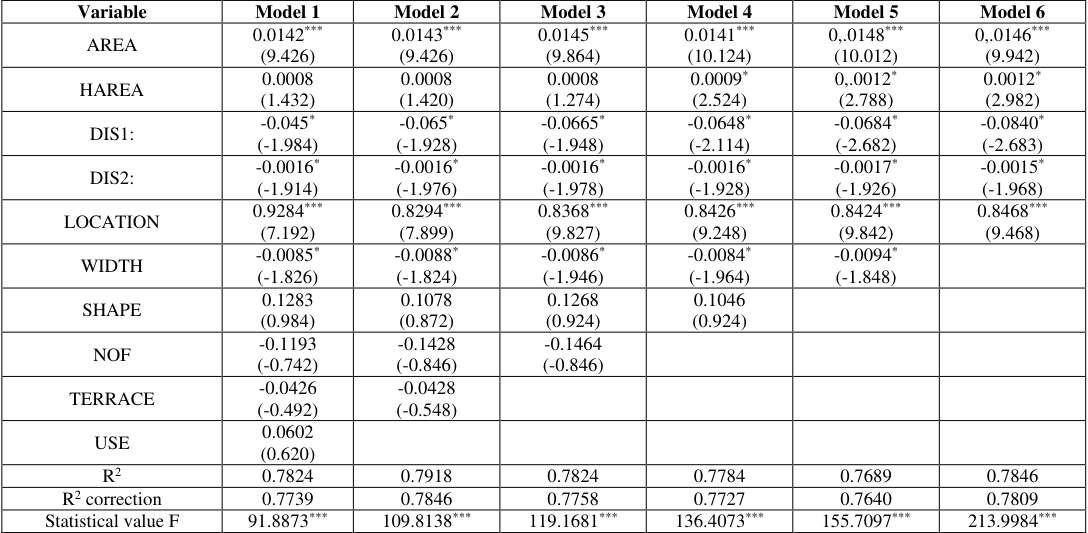 Table 3
Introduction
For many households, housing not only provides them shelter, but it is also a major asset. Real estate is one of the most important assets in the investment and buying and selling portfolio of households. Indeed, in industrialized countries, real estate is the asset that makes up the largest share of affluent households. As a result, the value of their apartments has a great impact on consumption, household savings and the supply-demand mechanism. Thus, home prices are of great concern to property developers, banks, policy makers or the general public as well as existing and potential owners (Ustaoilu, E. 2003) [10] . The real estate market can be influenced by macroeconomic variables, spatial differences, community structural features and properties of real estate. Real estate valuation is necessary to provide a quantitative measure of the benefits and liabilities accrued from ownership of real estate. Valuations are performed by real estate agents, appraisal and inspection specialists, mortgage lenders, brokers, property developers, investors and fund managers, lending companies, market researchers, analysts, consultants and other professionals.
The Hedonic model and experimental studies
The Hedonic model is one of the oldest techniques of economic valuation developed by Lancaster (1966), Ridker (1967) [7] , Grilihces (1971), Rosen (1974) and others. Originally used to study the relationship between air pollution reductions and property values, the Hedonic model became an important study in the second half of the 1970s and throughout the 1980s. During this period, the Hedonic pricing method has become a very important tool for academic research, used in theoretical and experimental studies to determine the monetary value of goods in relation to the environmental and physical characteristics of the property. The first basic Hedonic model was presented by Ridker (1967) [7] : 𝑃 𝑖 = 𝑓(𝑆 1𝑖 , . . . , 𝑆 𝑘𝑖 ; 𝑁 1𝑖 , . . . , 𝑁 𝑚𝑖 , 𝑍 1𝑖 , 𝑍 2𝑖 , . . . . , 𝑍 𝑛𝑖 )
In which: P i is the house price; S is the structural characteristics of the house (1 2 … k) such as the area of the house, the number of rooms, the type of construction and some other factors. N is neighborhood characteristics (1….m), such as distance to workplace, quality of school, local crime rate and other factors. [8] , in a study applying the Hedonic model to evaluate the adverse environmental effects of "odor" emitted from a wastewater treatment plant in Brasilia (a city of Brazil). He identified 20 variables and built 4 models to analyze the influence of the atmospheric environment on the prices of apartments. The model results show that "air quality has an effect on apartment value", meaning that the closer the apartment is located to the wastewater treatment plant, the lower the value. In Selim S.'s study (2008) [9] about the intrinsic elements of the house made in Turkey, he built a house model as follows:
The results of the Hedonic regression model show that the area of the house, the number of rooms, the type of house, the water system, the swimming pool, the location characteristics and the type of the building are the most important variables affecting the house price. This model is continued and extended by Selim. H (2009) [2] . With two types of approaches, the models used in the analysis are: The Hedonic and ANN regression models. The results of the regression model show that water system, swimming pool, house type, number of rooms, house size, location characteristics and building type are the most important variables affecting house price. It can be seen that house prices in urban areas are 26.26% higher than that in rural areas. By comparing the predictive performance between Hedonic regressions and ANN models, this study demonstrates that ANNs can be a better alternative to Turkish house price predictions. Research results of Gabriel K. B (2011) [1] also show that external factors affecting real estate also affect the price of that real estate. He uses the Hedonic model considering factors such as: distance from property to church, distance from property to workplace, security, parking spaces. The model is as follows:
The results of the regression model show that external factors affecting the church have a negative effect on real estate prices. The further away the property is from the church, the higher the price. In addition, there are a number of studies on real estate prices in Vietnam, which are also based on Hedonic regression model. According to the recently developed Status -Quality Trade-off theory, Authors Hoang Huu Phe and Patrick Wakely (2000) [3] , have given some suggestions to orient the construction of a scientific basis and method of real estate valuation in line with market economic institutions. The study shows that real estate prices depend on quality and status factors: Y = f(CL, VT). Regression results show that the variable campus area has the strongest influence on real estate prices, followed by the variables of distance to the center of the city, number of building floors, location of houses being in the frontage or in alleys. In addition, Kim (2007) [4] also considers the legal impact on house prices in Ho Chi Minh City. In Ho Chi Minh City and Hanoi, the author builds a model with legal representative variables such as legal documents, house owner certificates, certificate of land use rights, and related legal rights.
Description of variables and regression models
In this article, 240 apartment samples are studied within Hanoi on 6 routes: Nguyen Chi Thanh, Tran Duy Hung, Nguyen Trai, Tay Son, Huynh Thuc Khang, Truong Chinh (data collected by the authors). The method of using regression according to Hedonic model and Status -Quality Trade-off Theory is extended to fit the variables and data of this article. Sampling process was randomly collected on 6 routes. The above routes are all part of the main route of the city, which has been formed for a long time and is the place where busy business and trade activities take place. The sample in the article has all the documents: land use rights, blueprints, and registration fee records. Due to the volatility of the real estate market, the relatively short survey period from April 1, 2021 to December 31, 2021 helped minimize macro fluctuations in the market, such as fluctuations in capital investments, interest rates, and exchange rates. The regression model is thus as follows: Log P = βx + u, in which P is the house price, β is the regression coefficient, x is the explanatory variables and u is the random error. Regression model with 10 explanatory variables, including 5 position variables of real estate: the location of the property, the distance from the property to the center (Hanoi), the distance of the property to the street frontage, the width of the facade and the intended use of the property (for business or for residence). At the same time, 5 additional variables are considered for real estate quality: land area, house area, number of floors, terrace, shape. The model we study is:
Model 1 has multicollinearity between variables and autocorrelation between USE and LOCATION, because the correlation coefficient between these two variables is 0.78. At the same time, the USE variable was not statistically significant, so the USE variable was excluded from model 1.
Figures and tables from the paper
| Variable | Description | Expectation of Sign |
|---|---|---|
| LogPRICE | The logarithm of real estate prices | |
| AREA | Land area (m2) | + |
| HAREA | House area (m2) | + |
| DIS1: | Distance from the property to the center (km) | - |
| DIS2: | Distance from the property to street frontage (km) | - |
| WIDTH | Front pavement width (m) | + |
| SHAPE | Real estate shape: dummy variable (gets the value 1 if the back is wider or equal to the front of the land; value 0 if the back is narrower than the front) | + |
| NOF | Number of floors: dummy variable (gets the value 1 if the number of floors <= 4; value 0 if > 4) | - |
| TERRACE | Terrace: dummy variable (gets value 1 if there is a terrace; value 0 if there is no terrace) | + |
| LOCATION | Location: dummy variable (gets value 1 if property is in frontage; value 0 if property is in alleys) | + |
| USE | Usage: dummy variable (gets value 1 if the property is for business, office, or residential use; gets value 0 for residential use only) | + |
Table text extracted from the original PDF; superscript letters are shown inline. The original table image is below.
View original table image
| Variable | Average value | Maximum value | Minimum value | Standard deviation |
|---|---|---|---|---|
| LogPRICE | 8.20 | 12.65 | 7.24 | 0.84 |
| AREA | 56.50 | 260.60 | 52.10 | 24.3 |
| HAREA | 2.780 | 4.30 | 2.12 | 1.23 |
| DIS1: | 24.60 | 30.30 | 22.40 | 4.62 |
| DIS2: | 4.60 | 6.60 | 3.20 | 1.26 |
| WIDTH | 6.30 | 8.65 | 5.40 | 1.68 |
| SHAPE | 0.42 | 1.00 | 0.00 | 0.12 |
| NOF | 4.20 | 1.00 | 0.00 | 0.36 |
| TERRACE | 0.65 | 1.00 | 0.00 | 0.21 |
| LOCATION | 0.43 | 1.00 | 0.00 | 0.36 |
| USE | 0.54 | 1.00 | 0.00 | 0.42 |
Table text extracted from the original PDF; superscript letters are shown inline. The original table image is below.
View original table image
References
9 in the original paper- Gabriel Kayode Babawale. The Impact of Neighbourhood Churches on House Prices, Journal of Sustainable Development. 3/2011;4(1):246-253.
- Hasan Selim. Determinants of house prices in Turkey: Hedonic regression versus artificial neural network, Expert Systems with Applications. 2009;36:2843-2852.
- Hoàng Hữu Phê, Patrick Wakely. Vị thế, chất lượng và sự lựa chọn khác: Tiến tới một lý thuyết mới về vị trí dân cư đô thị, tạp chí Đô thị học, xuất bản tại Vương quốc Anh. 1/2000;37:1.
- Kim. North Versus South: The Impact of Social Norms in the Market Pricing of Private Property Rights in Vietnam, World Development. 2007;35(12):2079-2095.
- Nguyễn Trọng Hoài, Phùng Thanh Bình, Nguyễn Khánh Duy. Dự báo và phân tích dữ liệu trong kinh tế và tài chính, NXB Thống kê, 2009.
- Ridker Ronald G, John Henning A. The Determinants of Residential Property Values with Special Reference to Air Pollution, The Review of Economics and Statistics. 1967;49(2):246-57.
- Sérgio AB, et al. Economics of Air Pollution: Hedonic Price Model and Smell Consequences of Sewage Treatment Plants in Urban Areas, Economics of Air Pollution. 8/2002;234:1-25.
- Sibel Selim. Determinants of house prices in Turkey: Hedonic regression model, Doðuþ niversitesi Dergisi, 2008, 65-76.
- Ustaoðlu E. Hedonic Price Analysis of Office Rents: A Case Study of the Office Market in Ankara, Middle East Technical University, Unpublished MSc, Thesis, 2003.
Cited by 2
From OpenAlex, OpenCitations and reference lists read by Scinovex
- An empirical case study on the effect of Al Aweer sewage plant odours on housing prices in Dubai’s International City ↗
Nada Karim Abou-Gad, Matt Myers, Eric Nimako Aidoo · International Journal of Housing Markets and Analysis · 2025
Purpose This study aims to investigate the impact of proximity to the Al Aweer sewage treatment plant (STP) on residential property values in Dubai’s International City. It hypothesises that properties closer to the plant experience greater value diminution due to odour emissions. Design/methodology/approach The research uses traditional hedonic pricing models to analyse the impact of odour emissions on property values.…
❝ 1 - The Impact of Market Activity on Property Valuations in Digital Real Estate Through a Quantitative Analysis of Bidding and Sales Dynamics ↗
Jeffri Prayitno Bangkit Saputra · International Journal Research on Metaverse. · 2024
This study investigates the impact of market activities, specifically the number of bids and sales, on property prices in digital real estate markets. With the rise of virtual environments and digital assets, understanding the factors that drive property valuations in these markets has become increasingly important. Utilizing a dataset of 2,000 property transactions, this research employs correlation and regression analyses…
❝ 1PDF