
Research article · 2022 · Full text
International Journal of Advanced Biochemistry ResearchComparative study of serum calcium, serum phosphorus and alkaline phosphatase between prediabetes and type-2 diabetes mellitus
Volume 6(1) · Pages 79–83 · DOI: 10.33545/26174693.2022.v6.i1a.93 ↗
Research areasAlkaline Phosphatase Research StudiesLiver Disease Diagnosis and TreatmentPancreatitis Pathology and Treatment
Abstract
Author-writtenBackground: Diabetes mellitus, a group of metabolic disorder with multiple etiologies is characterized by chronic hyperglycaemia, induced by deficiency of insulin production and insulin action. Prediabetes is a type of hyperglycemia in which glycemic indices are higher than normal but lower than the diabetes threshold. Objective: This study aims to assess the impact of bone markers (serum calcium, phosphorus and alkaline phosphatase) on prediabetic and type 2 diabetes mellitus patients. Material and Methods: This study was carried out during 2021 from January to December, in Department of Biochemistry, Teerthanker Mahaveer Hospital, and Moradabad. Comparative levels of serum calcium, serum phosphorus and alkaline phosphatase between 65 Prediabetic and 65 Type2 diabetes mellitus patients were measured using automated method. Results: Serum ALP and serum phosphorus were significantly higher in the diabetic patients than that in the pre diabetic group (p
Summary
Source-checkedPlain-language reading of the full paper, prepared with AI and checked against the text. Each point links to the authors' own words.
Why it matters
- Diabetes mellitus is a group of metabolic disorders defined by chronic high blood sugar caused by issues with insulin production or action. View evidence ↗
- Prediabetes is a state of hyperglycemia where blood sugar levels are above normal but have not yet reached the threshold for a diabetes diagnosis. View evidence ↗
- Evidence suggests that type 2 diabetes mellitus may lead to a loss of bone mass and poor bone quality. View evidence ↗
The question
- The study aimed to evaluate how bone markers, specifically serum calcium, phosphorus, and alkaline phosphatase, differ between patients with prediabetes and type 2 diabetes mellitus. View evidence ↗
What they did
- The research was conducted between January and December 2021 at the Department of Biochemistry, Teerthanker Mahaveer Hospital in Moradabad. View evidence ↗
- Data were analyzed using mean and standard deviation, with comparisons performed via student's t-test and Pearson's correlation, defining significance as p < 0.05. View evidence ↗
What they found
- Serum alkaline phosphatase (ALP) levels were significantly higher in patients with diabetes mellitus (163.15±123.07 IU/L) compared to the prediabetic group (107.30±29.40 IU/L), with p < 0.001. View evidence ↗
- Serum phosphorus levels were significantly higher in diabetic patients (4.5±1.36 mg/dl) than in prediabetic patients (3.80±1.37 mg/dl), with p < 0.004. View evidence ↗
- Plasma glucose levels were significantly higher in the diabetic group (140.55±42.10 mg/dl) than in the prediabetic group (106.49±20.81 mg/dl), with p < 0.001. View evidence ↗
- HbA1c levels were significantly higher in patients with diabetes mellitus (9.26±2.45%) compared to the prediabetic group (5.94±0.26%), with p = 0.001. View evidence ↗
- The study found a negative correlation (r = -0.249) between fasting plasma glucose levels and serum calcium levels. View evidence ↗
What it means
- The authors conclude that serum calcium, phosphorus, and ALP can serve as independent predictors for diagnosing diabetes, and early detection may help prevent complications. View evidence ↗
- The authors state that type 2 diabetes can be avoided through lifestyle changes, including dieting and avoiding obesity. View evidence ↗
Visual summary
3 visualsIllustrations explain the paper; charts are replotted from the paper's own table values.
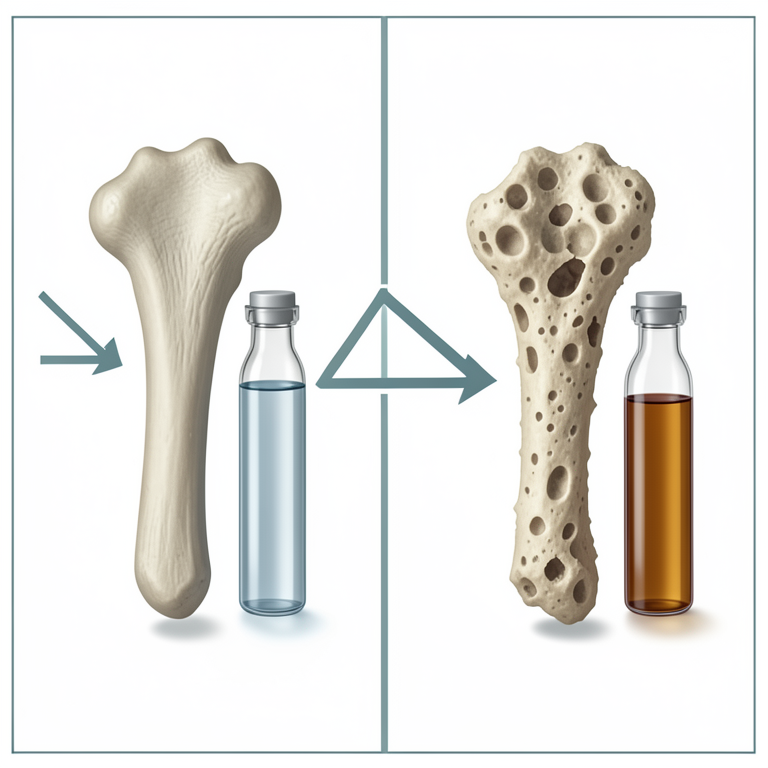
Comparison of Bone Markers
AI-generated conceptual illustration (Human blood serum and bone tissue). It explains the idea and does not show study data.
View source evidence ↗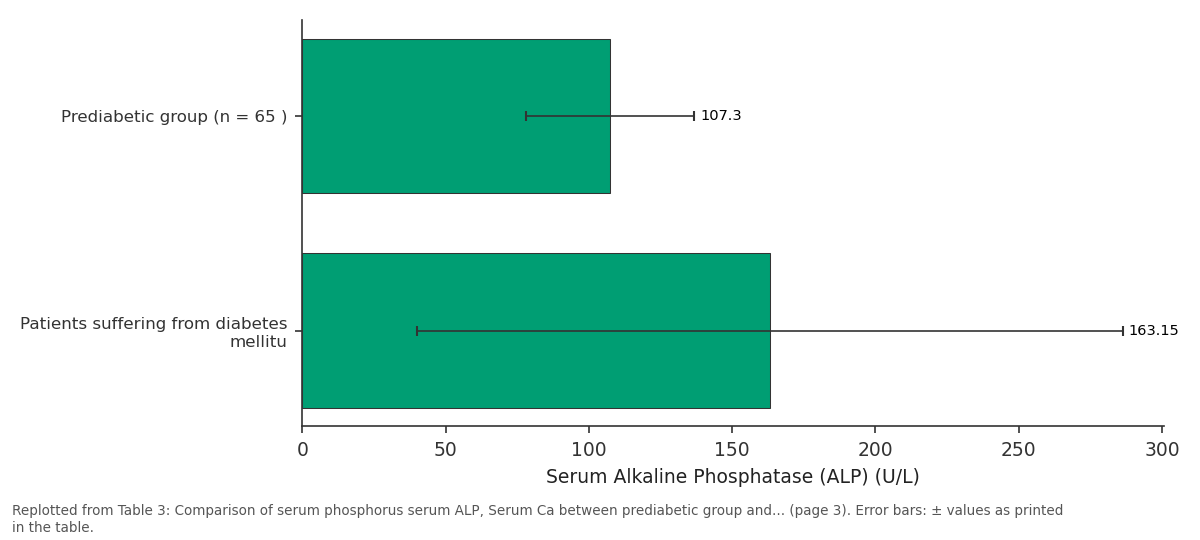
Serum Alkaline Phosphatase (ALP) (U/L): Prediabetic group (n =... vs Patients suffering from...
Replotted from Table 3 (page 3) of the original paper. Every bar is the paper's own table value.
View source evidence ↗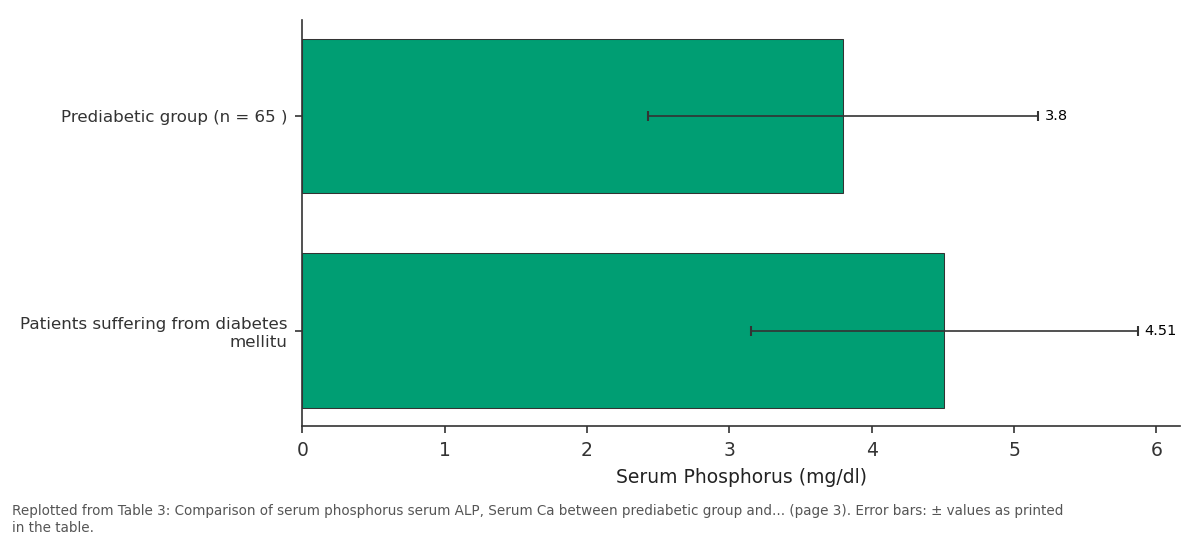
Serum Phosphorus (mg/dl): Prediabetic group (n =... vs Patients suffering from...
Replotted from Table 3 (page 3) of the original paper. Every bar is the paper's own table value.
View source evidence ↗Figures & tables
From the original paper Table 1
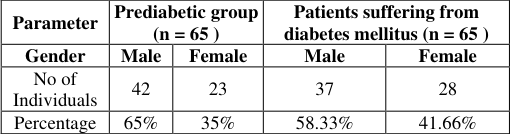 Table 2
 Table 3
 Table 4
 Table 5
Introduction
Diabetes mellitus is the most common metabolic disease. It was initially reported 3000 years ago in Egyptian manuscripts and the distinction between type 1 and type 2 diabetes mellitus was established in 1936 [1,2] . Diabetes mellitus is a worldwide pandemic disease that occurs in more than 150 million individuals. In 2030, globally the number of adults suffering from diabetes will reach to 439 million, with the majority of cases being type 2 diabetes mellitus. Diabetes mellitus is a one of the main cause of illness and mortality in the United States [3] . Diabetes mellitus refers to a group of metabolic disorder with a multiple etiologies that are defined by chronic hyperglycemia and includes lipid, protein and carbohydrate metabolic abnormalities induced by insulin production and insulin action [4] . Insulin, an anabolic hormone that causes metabolic irregularities in carbohydrate, lipids, minerals and a variety of others substances. Low insulin secretion, decrease glucose utilization and elevated glucose synthesis are all variables that contribute to hyperglycemia depending on etiology of diabetes mellitus [5,6] . According to the ICMR INDIAB India had 62.4 million diabetic patients in 2011 and is anticipated to have 101.2 million by 2030 [7] . The American Diabetes Association proposed by the classical categorization of type 1 diabetes mellitus, type 2 diabetes mellitus & gestational diabetes mellitus and it is the most often used classification by the ADA [8] . Type1 diabetes characterized by inappropriate insulin secretion which is predominantly caused due to the loss of cells of the pancreas as well as destruction and tendency to ketoacidosis [9] . Type 1 diabetes affects 5-10% of diabetes patients and it is due to the loss of beta cells in the pancreas. In children &adolescents, it contributes for 80-90% of diabetes cases [10] . In 1988, type 2 diabetes mellitus was known as the primary component of metabolic syndrome. In 2011, 366 million people were expected to have diabetes mellitus by 2030 that number will have risen to 552 million [11,12] . Non-insulin-dependent diabetes mellitus, also known as type 2 diabetes is a condition with elevated blood glucose levels (hyperglycemia) insulin resistance and may combined with a deficiency of insulin [13] . Insulin resistance and beta dysfunction characterized type 2 diabetes mellitus which affects 5.9% of adult worldwide and covering 8% of developing countries [14] . The American Diabetes Association, on the other side employs the same IGT cut off value (140 to 200 mg/dl) but has a reduced IFG cut-off value (100-125mg/dl) and incorporates additional hemoglobin A1C based criteria for the classification of prediabetes at a level of 5.7 to 6.4% [15] . Prediabetes is characterized by blood glucose concentration raised than average. However, the level is not high enough to be diagnosed with diabetes [16] . A s a result, based on evidences that type 2 diabetes mellitus can lead to poor bone quality and bone loss. Also, few studies have suggested that various bone indicators levels were found to be such as serum calcium, serum phosphorus and serum alkaline phosphate [17] . The hydrolytic enzyme alkaline phosphate is found in the liver, bile duct, kidney, intestinal mucosa, and placenta among other places many diabetics may also have been shown to have elevated levels of serum alkaline phosphatase [18] . Calcium is found in bones and teeth, where it serves as a structural component of metabolism. Calcium is essential for insulin-mediated intracellular activities in insulinresponsive tissues such as skeletal muscle and adipose tissue, but only in a very limited range does insulin activity change. Calcium variations in the major insulin target tissue contribute to insulin action modifications [19] . Phosphorus is an essential nutrient and adults should consume between range from 550-700 mg per day with a tolerable top limit or 4000 mg per day. In recent years, phosphorus consumption has raised in the population, whereas type 2 diabetes incidences have increased alarmingly [20] . Hence, this study will be directed to determine the importance and to compare the levels of in serum calcium, phosphorus and alkaline phosphatase (ALP) between type 2 diabetes mellitus and prediabetic patients. This research will also look into the relationship between these factors and plasma fasting glucose and HbA1c level.
Materials and Methods
Hospital-based observational and comparative study was conducted in the Department of Biochemistry at TMMC &RC Moradabad. Total 130 patients were included in this study and were divided into two groups. Group II (controls): Consisted of 65 pre-diabetic patients, who have fasting plasma glucose between 101 to 125mg/dl and HbA1c between 5.7-6.4%.
Exclusion criteria [21] 1. Smokers 2. Heavy alcoholics 3. Chronic infection affecting bone 4. Chronic renal failure 5. Bone tumours 6. Drugs that may affect bone metabolism Statistical analysis SPSS version 28.0 for data analysis and Microsoft Word and Excel for graph generation. Mean and standard deviation was assessed & comparison was done using student's t-test & Pearson's coefficient correlation (r-value). Significant is evaluated as a p-value of less than 0.05. [S] Highly significant is described as a p-value of less than 0.001 [HS].
Results
This study included one hundred and thirty individuals divided into two groups: group I: prediabetic individuals (n=65) 42 (65%) males and 23 (35%) females. Their ages were ranged between 30 to 60 years with mean 43.72±7.39 years. Already diagnosed diabetic individuals (n=65) 37 (58.33%) males and 28 (41.66%) female was included in group II. Their ages were ranged 30to 60 years with mean 45.12±5.90 years. The independent Students t-test showed no statistically significant difference between mean ages of control group and patients with suffering from diabetes mellitus Patients suffering from diabetes mellitus is, 58.33% male and 41.66% female and in prediabetic group in 65% in male and 35% in female. In this study, we observed that 28% of patients were male and 22% of patients were female among diabetes mellitus and observed that 32% were male and 18% were female among prediabetic. There was a statistically significant difference (p<0.001) found between prediabetic group and patients suffering from diabetes mellitus. There was a significant difference (p<0.001) found between prediabetic group & patients suffering from diabetes mellitus.
Graph 4: Comparison of mean and SD HbA1c between prediabetes group and diabetes group.
Discussion
Diabetes mellitus is a metabolic disorder. It is a group and various degrees of carbohydrate, lipid and protein metabolism impairment [22] . Diabetes mellitus can have a variety of causes and etiologies, but it usually involves aberrant insulin secretion & response at some point throughout the disease's evolution. Type 1 diabetes (autoimmune diabetes) and type 2 diabetes mellitus are the two most frequent types of diabetes mellitus both are characterized by hyperglycemia, insulin resistance and relative insulin shortage [13] . Therefore, this research was conducted to assess the impact of bone markers (calcium, phosphorus and alkaline phosphatase) on prediabetic & Type 2 diabetes mellitus patients & also found a possible correlation of these bone markers with fasting blood sugar (FBS) and HbA1c in our study most patients were male & higher diabetic prevalence were seen in the age group of 30-60 years and patients suffering from diabetes mellitus female patients were about 22% of the total.
In table 1 we found that the comparison of age between prediabetic group and diabetic group were in the age group of 30-60 years & mean was 43.72±7.39 in prediabetic group and 45.12±5.90 mean in diabetic group. There were no significant changes in the age group of prediabetic and diabetic group.
In table 2 we have seen that the comparison of percentage of gender between prediabetic male was 42 (60%) and female was 23 (35%) and among include in our study diabetic group male was 37(58%) and female was 28 (41%) include in our study.
| Parameter | Prediabetic group (n = 65 ) | — | Patients suffering from diabetes mellitus (n = 65 ) | — |
|---|---|---|---|---|
| Gender | Male | Female | Male | Female |
| No of Individuals | 42 | 23 | 37 | 28 |
| Percentage | 65% | 35% | 58.33% | 41.66% |
Table text extracted from the original PDF; superscript letters are shown inline. The original table image is below.
View original table image
In figure 3 we compared overall gender distributions between prediabetic and diabetic group, in which male were 32% and female were 18% prediabetic group and 28% male and 22% female in diabetic group.
In table 3 we compared serum calcium level in prediabetes and diabetes mellitus patients. We found that the mean value of serum calcium (7.98±0.91 mg/dl) in diabetes patients were significantly (p<0.001) decreased when compared with prediabetes patients (8.53±0.84 mg/dl). We found that the mean value of serum phosphorus (4.51±1.36 mg/dl) in diabetes patients were highly significantly (p<0.001) increased when compared with prediabetes group (3.80±1.37 mg/dl). We found that the comparison of serum alkaline phosphatase level in prediabetic group (107.30±29.40 IU/L) and diabetes mellitus group (163.15±123.07 IU/L) were highly significant than the prediabetic patients.
| Parameter | Prediabetic group (n = 65 ) | Patients suffering from diabetes mellitus (n = 65 ) | p - Value |
|---|---|---|---|
| Serum Phosphorus (mg/dl) | 3.80±1.37 | 4.51±1.36 | 0.004 |
| Serum Alkaline Phosphatase (ALP) (U/L) | 107.30±29.40 | 163.15±123.07 | 0.001 |
| Serum Calcium (mg/dl) | 8.53±0.84 | 7.98±0.91 | 0.001 |
Table text extracted from the original PDF; superscript letters are shown inline. The original table image is below.
View original table image
In table 4 we compared plasma glucose in prediabetes and diabetes mellitus patients. We found that the value of glucose (140.55±42.10 mg/dl) in diabetic patients were (p<0.001) increased when compared with prediabetic individual (106.49±20.81 mg/dl).
In table 5 we compared of serum HbA1c in prediabetes and diabetes mellitus were found that the value of HbA1c (9.26±2.45%) in diabetic patients were (p<0.001) increased when compared with prediabetic group (5.95±0.26%). In this study we found that plasma glucose & HbA1c level is increased significantly in case then healthy controls. This agrees with study done by Kanchana N, et al. 2014 [19] they observed that serum level of calcium with mean value of (9.4±0.38 mg/dl) was significantly decreased in type 2 diabetes mellitus patients then controls and also found a negative correlation between fasting plasma glucose and serum calcium concentration, that prove increased glucose levels was associated with decreased calcium levels. Our study also correlated with above finding with mean value of serum calcium (7.98±0.91 mg/dl) in diabetic patients and (8.53±0.84 mg/dl) in prediabetic patients that shows a significant decrease, we were also observed a negative correlation between fasting plasma glucose level and serum calcium level r=-0.249. According to the researcher Abdulrehman Ibrahim H, et al. 2019 [23] they found that serum level of calcium with mean value (7.54±1.21 mg/dl) in case of type 2 diabetes mellitus patients when compared with mean of reference value (9.45 mg/dl) and were shown on the mean value of Random blood glucose was (273.40±126.08) with mean of reference value (170 mg/dl), their study concluded that the level of serum calcium was reduced among diabetic patients. In our study also correlated with these finding with mean value of serum calcium (7.98±0.91 mg/dl) in diabetic patients and (8.53±0.84 mg/dl) in prediabetic patients that shows a significant decreased. Ruaa, et al. 2020 [24] who reported raised level of serum alkaline phosphatase with mean (90.36±30.37 IU/L) in case significantly increased as compared to (78.76±25.87 IU/L) healthy controls. In our study we found that the mean value of serum alkaline phosphatase in prediabetic group (107.30±29.40 IU/L) and diabetes mellitus group (163.15±123.07 IU/L) in this study it is concluded that ALP level is higher in diabetic patients as compared with healthy or prediabetic subjects.
According to the Butola LK, et al. 2020 [25] in the year 2020 found that the level of serum calcium in diabetic patients (6.41±1. [26] observed that the mean levels of serum phosphate was (4.2±0.4 mg/dl) and controls was (3.2±0.3 mg/dl) and serum calcium mean value was (9.5±0.6 mg/dl) with controls (9.5±0.5 mg/dl). They determined the differences between diabetics and nondiabetics individuals and observed high serum phosphate then compared controls and observed similar serum calcium levels.
Conclusion
Diabetes mellitus is the century's epidemic and diabetes will continue to rise unless effective diagnostic procedures are developed at an early stage.
The current study indicated that the most effective diagnostic methods and criteria for diagnosing prediabetes and diabetes are focused on the type of diabetes and its criteria, as well as the types of diabetes and their criteria.
Prediabetes is a type of hyperglycemia that is intermediate in severity. Diabetes and type 2 diabetes mellitus are metabolic diseases that can be avoided by changing one's lifestyle, controlling overweight and dieting, and avoiding obesity.
The results of this study revealed alterations in parameters of diabetes mellitus. Serum calcium was decreased, whereas Serum P and Serum ALP were increased in patients of diabetes mellitus. However, these parameters do not show any significant change in the prediabetic condition. Hence this study observed that these parameters can be considered as independent predictors for the diagnosis of diabetes, and their early treatment could be beneficial to prevent further complications. Diabetes mellitus is the century's epidemic and diabetes will continue to rise unless effective diagnostic procedures are developed at an early stage.
The current study indicated that the most effective diagnostic methods and criteria for diagnosing prediabetes and diabetes are focused on the type of diabetes and its criteria, as well as the types of diabetes and their criteria.
Prediabetes is a type of hyperglycemia that is intermediate in severity. Diabetes and type 2 diabetes mellitus are metabolic diseases that can be avoided by changing one's lifestyle, controlling overweight and dieting, and avoiding obesity.
The results of this study revealed alterations in the parameters of diabetes mellitus. Serum calcium was decreased, whereas Serum P and Serum ALP were increased in patients with diabetes mellitus. However, these parameters do not show any significant change in the prediabetic condition. Hence this study observed that these parameters can be considered independent predictors for the diagnosis of diabetes, and their early treatment could be beneficial to prevent further complications.
Acknowledgement
AcknowledgementI am grateful to all the faculty members and technical staff of the Biochemistry department and laboratory for their kind support.
References
20 in the original paper- Baynes HW. Classification, pathophysiology, diagnosis and management of diabetes mellitus. Diabetes & Metabolism Journal. 2015;6(5):1-9.
- Olokoba AB, Obateru OA, Olokoba LB. Type 2 diabetes mellitus: A review of current trends. Oman Medical Journal. 2012;27(4):269.
- Ali A, Iqbal F, Taj A, Iqbal Z, Amin MJ, et al. Prevalence of Microvascular complications in newly diagnosed patients with type 2 diabetes. Pakistan Journal of Medical Sciences. 2013 Jul;29(4):899-902.
- Galtier F. Definition, Epidemiology, risk factor. Diabetes & Metabolism Journal. 2010;36(7):638-651.
- Singh PS, Sharma H, Khwaja S. prevalence of type2 diabetes mellitus in rural population of India a study from Western Uttar Pradesh. International Journal of Research in Medical Sciences. 2017;5(4):1363.
- Anjana RM, Pradeep R, Deepa M. Prevalence of diabetes and prediabetes (impaired fasting glucose and /or impaired glucose tolerance) in urban and rural India: phase I result of the Indian Council of Medical Research India Diabetes study. Diabetologia. 2011;54:3022-7.
- American Diabetes Association. Diagnosis and classification of diabetes mellitus. Diabetes care 2014;37(1):81-90.
- Maahs DM, West NA, Lawrence JM. Epidemiology of type 1 diabetes. Endocrinology and Metabolism Clinics of North America. 2010;39:481-497.
- Patlak M. New weapons to combat an ancient disease: treating diabetes. Federation of American Societies for Experimental Biology Journal. 2002;16(14):1853. 12. Global burden of diabetes. International diabetes federation. Diabetic atlas fifth edition Brussels; c2011.
- Agrawal P, Arora S, Singh B. Association of macrovascular complications of type 2 diabetes mellitus with serum magnesium levels. Diabetes & Metabolic Syndrome. 2011;5(1):41-44.
- Bansal N. Prediabetes diagnosis and treatment: a review. World Journal of Diabetes. 2015;6(2):296-303.
- Thakur AK, Dash S. Estimation of Bone Mineral among Type2 Diabetes Mellitus Patientsvin western Odisha. International Journal of Research in Medical Sciences. 2018;10(1):03-18.
- Sharma U, Pal D, Prasad R. Alkaline phosphatase: an overview. Indian Journal of Clinical Biochemistry. 2014;1(3):269-278.
- Kanchana N, Saikumar P. Serum calcium levels in type 2 diabetes mellitus. Journal of Dental and Medical Sciences (IOSR-JDMS). 2014;13(8):01-3.
- Mancini FR, Affret A, Dow C, Bonnet F, BoutronRuault CM, Fagherazzi G. high dietary phosphorus intake is associated with an increased risk of type 2diabetes in the large prospective E3N cohort study. Clinical Nutrition. 2018;37(5):1625-1630.
- Hamad AN, Eltayeb LB, Brair SL, Bakheit KH, Hamdan HZ, Omer WH. A clinical study of serum calcium, phosphorus and alkaline phosphatase level in type 2 Diabetes mellitus among Sudanese population in Khartoum state 2012. Al Neelain Medical Journal. 2013;3(10):42-50.
- Ahmed AM. History of diabetes mellitus. Saudi Medical Journal. 2002;23(4):373-78.
- Hus Al, Tahleel B, Hasan AEI, Albagir EH, Mohammad MA, Salah S, et al. Serum Calcium level in Type 2 Diabetes Mellitus in Khartoum State. Journal of Clinical Microbiology. 2019;8(5):332.
- Ruaa Al-Saraj N, Al-Ameen A. Serum Alkaline Phosphatase level in newly Diagnosed type 2 Diabetes Mellitus. 2020;9(12):248-257.
- Raikou VD, Kyriaki D, Gavriil S. Importance of serum phosphate in Elderly patients with diabetes mellitus. World Journal Diabetes. 2020;11(10):416-424.