
Research article · 2022 · Full text
International Journal of Statistics and Applied MathematicsOn the contribution of information and communication technology (ICT) sector to economic growth in Nigeria: Vector error correction modelling approach
Volume 7(3) · Pages 143–151 · DOI: 10.22271/maths.2022.v7.i3b.834 ↗
Research areasEconomic Growth and Development
Abstract
Author-writtenThe Information and Communication Technology (ICT) has been the major front- runner in addressing the needs and industries of low- income communities in countries likes Nigeria. However, it was in the last fifteen years that the awareness for the importance of the ICT’s role in widening the economic break through was identified. Thus, this study examined the impact of ICT sector on economic growth in Nigeria using vector error correction model for the period 1981-2020. The data for the study were collected from National Bureau of statistic. The ADF test, Johansen Co-Integration Test and Vector Error correction model was used to test the stationarity, long run relationship and short run relationship between GDP and ICT sector. The results from the data analysis indicates that all the variables were not stationary; however, become stationary after first difference. The Johansen co-integration test result showed the existence of long run relationship between the GDP and ICT sector. The study also found that LNMPSRM has positive and significant effect on GDP, also LNTIS has negative and significant effect on GDP. The ECT coefficient of 0.251 indicates that a deviation from the long run equilibrium level of the contribution of ICT sector in one year is corrected by 25.1 percent over the following year. The Granger Causality result indicates a bi-directional relationship between LNMPSRM and LNGDP; and independent relationship between LNPUB, LNTIS, LNBRD and LNGDP. In order to ensure sustainable economic growth, the study recommends that Nigeria as a country should increase her investments in ICT sector as this will enable all the sub-sectors to contribute positively toward GDP of the Country.
Summary
Source-checkedPlain-language reading of the full paper, prepared with AI and checked against the text. Each point links to the authors' own words.
Why it matters
- Information and Communication Technology (ICT) is a primary tool for meeting the needs of low-income communities and industries in Nigeria. View evidence ↗
- Specific ICT sub-sectors, such as motion pictures and sound recording, contributed approximately 0.8% of Nigeria's GDP, totaling 1.27 Trillion Naira in 2020. View evidence ↗
- The telecommunications industry's contribution to Nigeria's GDP grew from 7.7% in 2012 to 10.43% by mid-2018. View evidence ↗
The question
- The study aimed to examine the impact of the ICT sector on Nigeria's economic growth between 1981 and 2020 using a vector error correction model. View evidence ↗
What they did
- The analysis employed the Augmented Dickey-Fuller (ADF) test for stationarity, the Johansen Co-Integration Test for long-run relationships, and the Vector Error Correction Model (VECM) for short-run relationships. View evidence ↗
- The study analyzed GDP in relation to four ICT sub-sectors: broadcasting (LNBRD), motion pictures and sound recording (LNMPSRM), publishing (LNPUB), and telecommunication and information services (LNTIS). View evidence ↗
What they found
- Initial data for all variables were non-stationary, but they became stationary after the first difference was applied. View evidence ↗
- The Johansen test indicated four co-integration equations, confirming a long-run relationship between GDP and the four ICT sub-sectors. View evidence ↗
- The first period lag of motion pictures and sound recording (MPSRM) had a positive and significant effect on GDP, with a coefficient of 0.7054. View evidence ↗
- The first period lag of telecommunication and information services (TIS) had a negative and significant effect on GDP, with a coefficient of -0.7342. View evidence ↗
- The Error Correction Term (ECT) showed that 25.1% of any deviation from the long-run equilibrium of ICT's contribution is corrected in the following year. View evidence ↗
- The VECM model's adjusted R-squared of 0.8519 indicates that ICT explained 85.2% of the variations in Nigeria's GDP. View evidence ↗
- Granger causality tests revealed a bi-directional relationship between GDP and motion pictures/sound recording, while other ICT sub-sectors had an independent relationship with GDP. View evidence ↗
What it means
- The authors concluded that the ICT sector contributes positively to the gross domestic product of Nigeria. View evidence ↗
- To ensure sustainable growth, the authors recommend that Nigeria increase investments in the ICT sector to allow all sub-sectors to contribute positively to the GDP. View evidence ↗
Visual summary
2 visualsIllustrations explain the paper; charts are replotted from the paper's own table values.

Impact of ICT Sub-sectors on GDP
AI-generated conceptual illustration (The Nigerian economy and ICT infrastructure). It explains the idea and does not show study data.
View source evidence ↗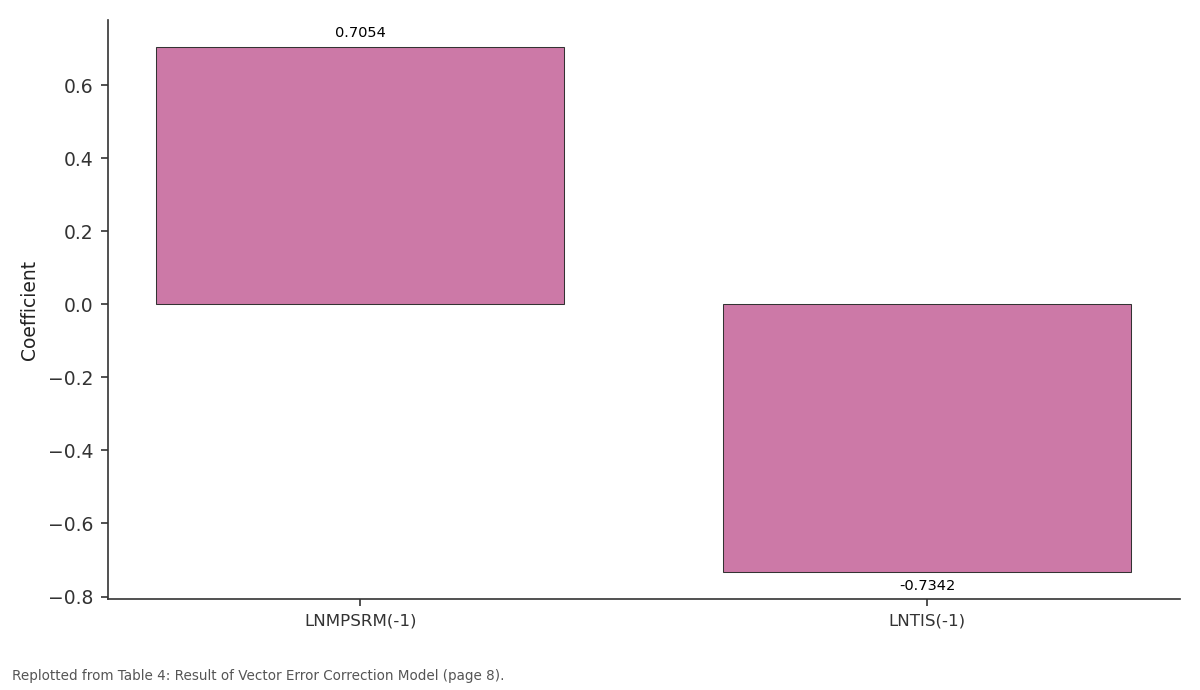
Coefficient: LNMPSRM(-1) vs LNTIS(-1)
Replotted from Table 4 (page 8) of the original paper. Every bar is the paper's own table value.
View source evidence ↗Figures & tables
From the original paper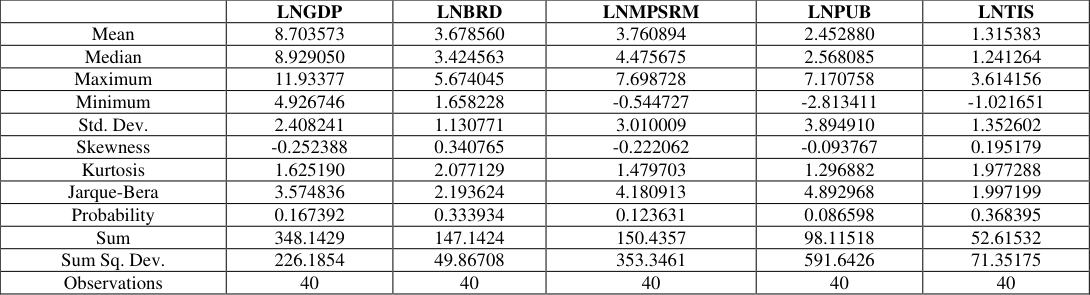 Table 1
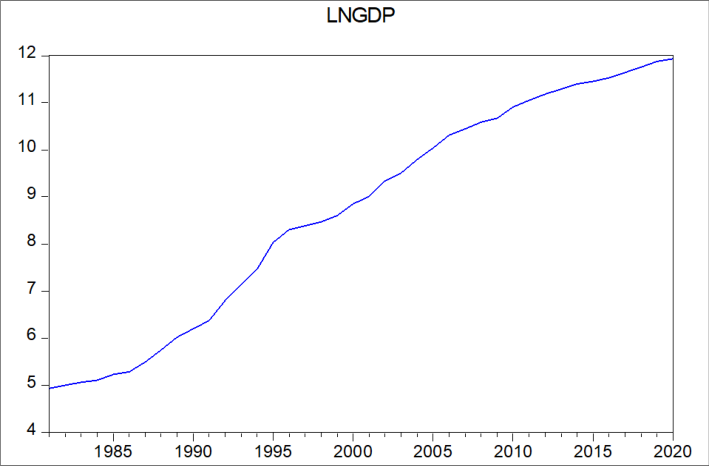 Figure 1
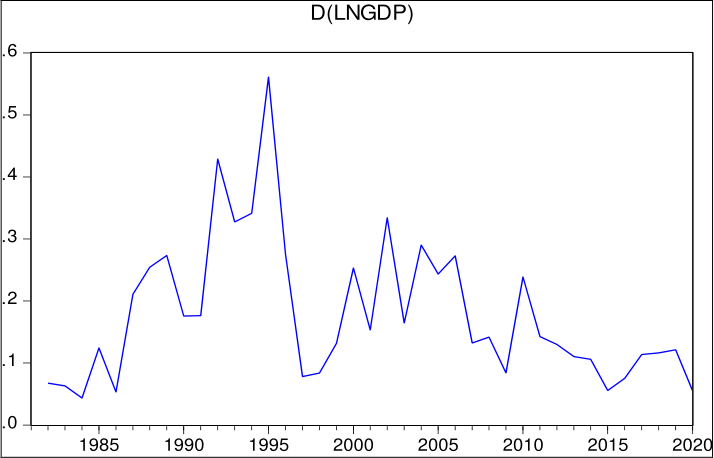 Figure 2
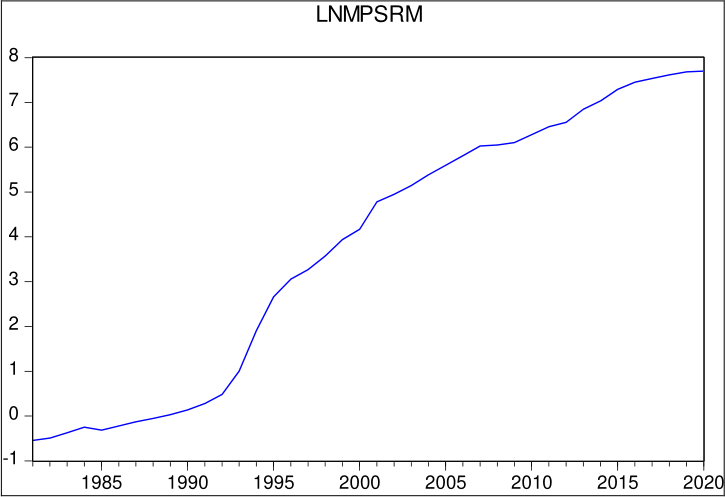 Figure 3
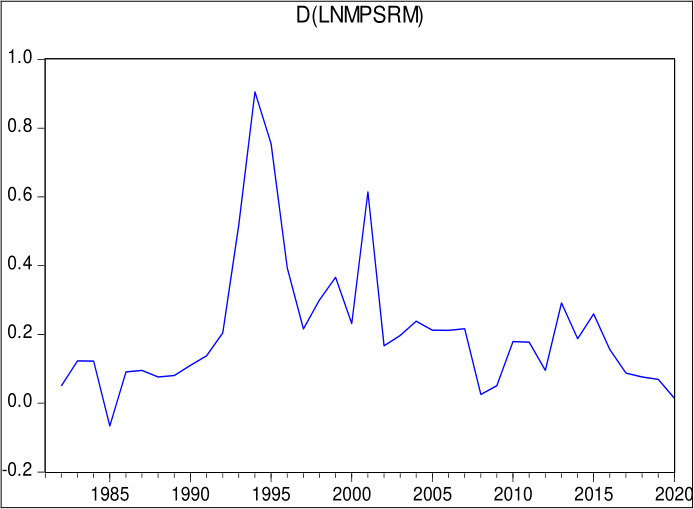 Figure 4
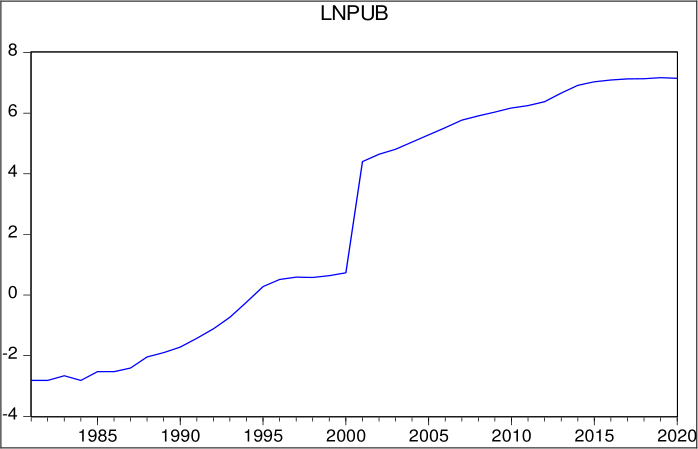 Figure 5
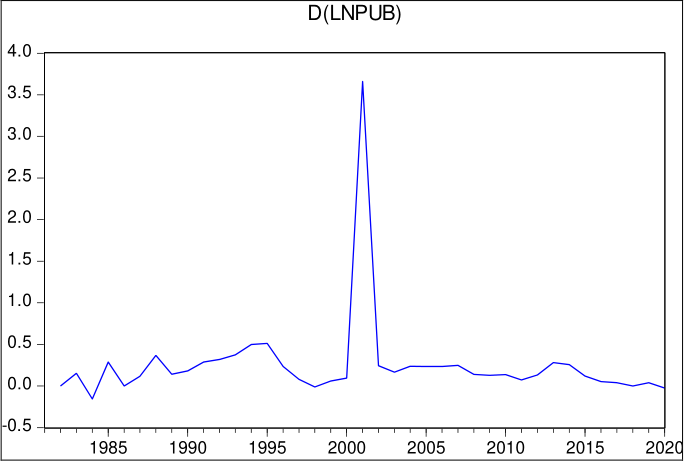 Figure 6
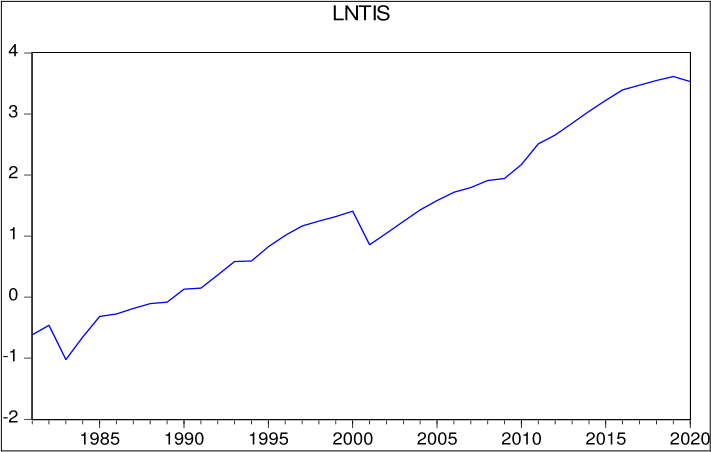 Figure 7
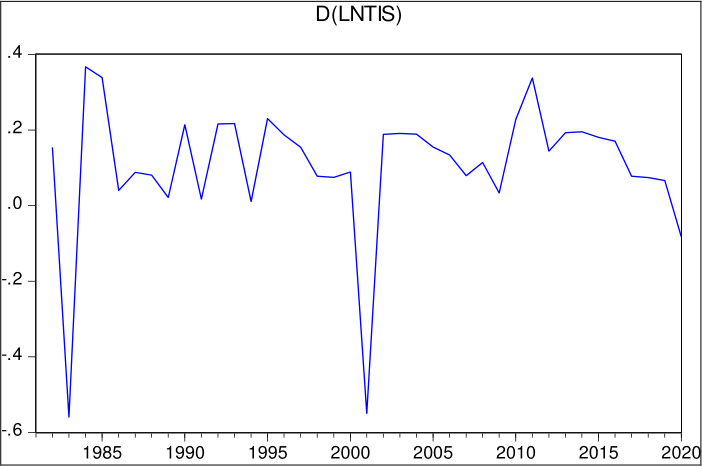 Figure 8
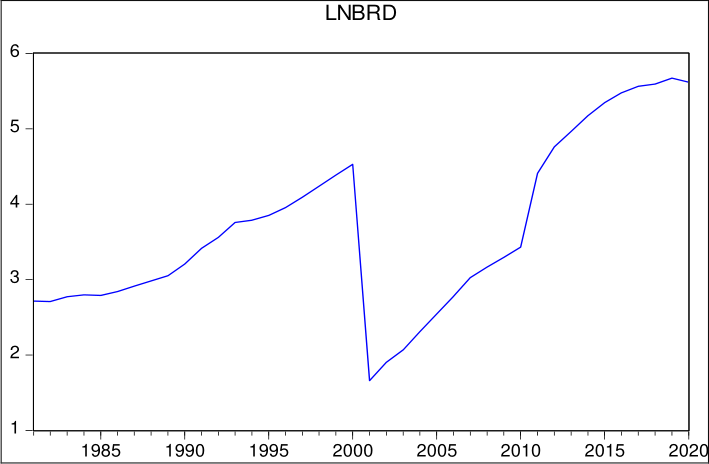 Figure 9
 Table 2
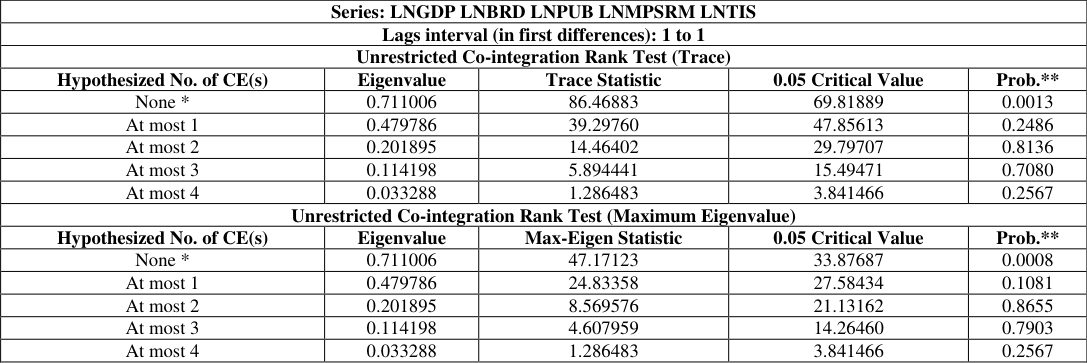 Table 3
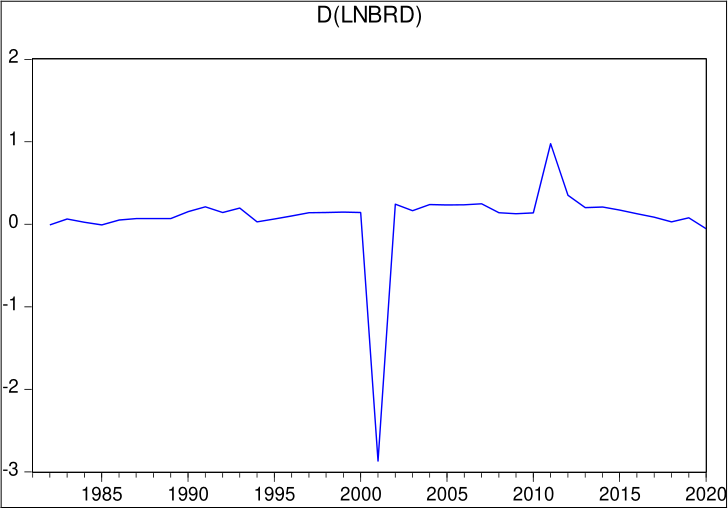 Figure 10
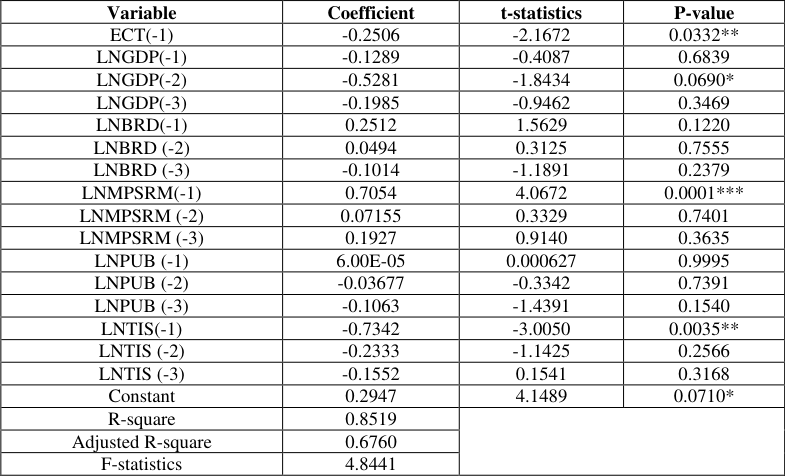 Table 4
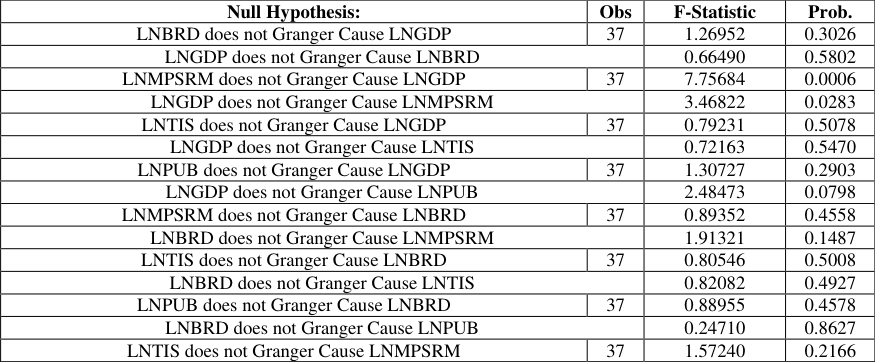 Table 5
Introduction
The Federal Government of Nigeria has swiftly embarked on a drive towards the provision of more effective and efficient services in the nation by privatizing and deregulating policies which have led to the realization of National Telecommunication policy in the last quarter of 2021. Researcher have revealed that only a handful industries in the economy that have adopted the ICTs, however, there has not been a very serious study to ascertain the level of adoption of impact on the effectiveness and efficiency of the industries and consequent impact of the National Economy (David, 2021) [4] . The establishment of motion picture and sound recording system has long been assisting in the area of information and recording storage since early 1990 which has the beginning and birth of the technology devices in information processing. In Nigerian for example, about 0.8 percent of GDP is generated by the industries of motion pictures, sound recording, and music production and about 1.27 Trillion Naira of the Nation's GDP was realized by this sector in 2020. Nigeria as a country, has an enormous film industry Hollywood, which produces the highest number of movie titles in English-speaking African countries. The Information and Communication Technology has been the major front-runner in addressing the needs and industries of low-income communities in countries likes Nigeria. However, it was in the last fifteen years that the awareness for the importance of the ICT's role in widening the economic break through was identified (Kramer, 2007) [8] . Most advance societies invested highly intensively on ICTs to breath sustainable long-term growth via production of ICT systems (Alani, 2012) [1] . For many years now ICT has been an active sector for investment because of its declining cost of services and equipment especially with the breakthrough in cloud computing and the investment into ICT such as computers, their peripherals, software and telecommunication gadgets (Hodrab et al, 2016) [6] . An extensive survey that has been conducted by the International Telecommunication United states revealed that Nigeria is one of the countries with high population density and the sector of wires and wireless communication discovered to be the main sector that creates job opportunities especially in mobile phone sector (ITU, 2016) [7] . The Nigerian communication commission (NCC) revealed that the telecommunication industry contribution to GDP was 7.7% as at 2012 as against 10.43% in the mid 2018 (NCC, 2018) [9] . This revealed the great deal contribution of the telecommunication industry to the country's GDP. On empirical evidence, Oladimeji and Folayan (2017) [10] carried out a study to identify the achievement that ICT sector provided and it impact on the Nigeria economy. The findings of the study revealed that ICT provides economic opportunities to the both urban and rural populations. The study also established that ICT increases productivity and makes the market work more efficiency. Ukwuoma (2019) [11] investigated the effect of ICT on Economic growth in Nigeria and found that increase in inflation, population and GDP per-capita have negative effect on number of internet users thereby affecting the economic growth of the Country. Waqar (2015) [13] conducted a study which aimed at understanding the impact of ICT on Country's economic output using 41 European Countries from 1996-2010 and found that ICT have strong positive correlation and causal relationship with GDP. Similarly, Billan, Mishchuk, Samoliuk and Grshnova (2019) [3] evaluate the impact of ICT on economic growth at the different hierarchical levels in Ukraine. The study established that CT development can enforce new impulse of economic progress. Albiman (2016) [2] reviewed the long run effect of ICT on economic growth in Sub-Saharan African region (1990-214) before the MDGs (1990-1999) and during MDGs (2000-2014). The study examined the non-linear effect of ICT in the economic growth and their threshold values. It was found that mobile phone and internet were found to have triggered economic growth. From the literature reviewed, the researchers observed that there are scanty studies that investigated the contribution of ICT sector to economic growth, especially in assessing the contribution of the sub sectors of ICT such as the broadcasting; motion, pictures and sound recording; publishing; telecommunication and information services. Thus, this paper therefore seeks to examine the contributions of output from these sub-sectors of ICT to economic growth of Nigeria using.
Material and Methods
Material and Methods
Materials
Documentary data was used in this study. The data were collected from National Bureau of Statistics (NBS) for the period of forty years (1981 to 2020).
Methods
Johansen Co-integration test and Vector Error Correction Model were employed in analyzing the data of the study.
Johansen Co-integration test
The Johansen Co-integration test was used to test for the existence of long run equilibrium between the dependent variable (GDP) and independent variables (ICT sub-sector). This was necessary due to the non-stationary nature of the variables employed in the study. The maximum Eigen values statistic test the null hypothesis of r co-integrating relations against the alternative of r +1 cointegrating relationship for r = 0, 1, 2, …, n-1. This test statistic is computed as:
Where 𝜆 ̂ is the computed maximum Eigen values and T stands for the sample size. At the other hand, the Trace statistic examine the null hypothesis of r co-integrating relations against the alternative of n cointegrating relations. Here, n is the number of variable in the system for r = 0, 1, 2, …, n-1. It is computed according to the following formula:
Vector Error Correction Model
The vector error correction model (VECM) was employed to examine the short run relationship between the variables under study. This approach is capable of taking into account the short-term adjustments of the variables as well as the speed of adjustment of the coefficient. Therefore, the VECM measures the speed at which gross domestic product will revert to its equilibrium following a short term shock to each of them.
In order to use the VECM, the below condition must hold: i. The variables must be stationary at first difference ii. The co-integration between the variables must exist.
According to Pfaff (2008), the following VECM specifications usually exist:
Where Γ 𝑖 matrices contain the cumulative long run impacts, thus, this VECM specification is signified by long run form. Π =∝ 𝛽 𝑇 is of reduced rank. The dimension of ∝ 𝑎𝑛𝑑𝛽 is 𝑘 × 𝑟 is the co-integration rank, that is, the number of co-integrating equation that exist between the variables. Also, ∝ is the loading matrix and the coefficients of the long-run relationships are contained in 𝛽 Granger Causality Test M Finally, Granger Causality was employed to determine the direction of the causality among ICT variables and gross domestic product which is given as follows:
Where GDP: Gross Domestic Product, LNBRD, LNMPSRM, LNPUB and LNTIS are the sub-sectors of ICT, 𝑉 𝑡 = 𝑒𝑟𝑟𝑜𝑟𝑡𝑒𝑟𝑚,t = current period, t-1 = lag period.
Unit Root Test
The study employed Augmented Dickey Fuller (ADF) to test the stationarity of data. Here, the parametric correction for higherorder correlation are constructed by assuming that the time series data follow an autoregressive of order p process and adding p lagged difference terms of the dependent variables y to the right hand side of the test regression as follows:
Where 𝑥 𝑡 are optional exogenous regression which may consist of constant or constant and trend.
The null hypothesis to be tested is given by: 𝐻 0 : 𝜃 = 0, implying that the data needs to be difference to make it stationary. Against the alternative hypothesis: 𝐻 1 : 𝜃 < 0, Implying that the data is trend stationary and needs to be analyzed by means of using time trend in the regression model instead of differencing the data.
The test statistics is conventional t-ratio for a:
Where 𝑎 ⏞ is the estimate of a, and 𝑠𝑒(𝑎) ⏞ is the coefficient standard error The Table 2 presents the results of ADF stationarity test of the time series data. The result indicates that all the variables of original log transformed data were not stationary. This is evidence by the critical values which were found to be less than the ADF statistics and also p-values greater than 0.05. However, after first difference, all the variables become stationary at 5% and 10% critical values (Critical values greater than the ADF statistic) also, p-value less than 0.05. Since, all the variables were stationary after first difference, the researcher when ahead to test for the existence of long run relationship using Johansen Co-integration test. The result for co-integration rank test were presented in table 3. Both Trace and Max-eigen value test indicates 4 co-integration equations at 0.05 level of significance. This implies that there is a long run relationship between LNGDP and log of information and communication variables (LNMPSRM, LNTIS, LNPUB, LNBRD). 4 presents the results of VECM used in establishing the dynamic short-run effect of the information and communication Technology on gross domestic product. The first and second period lag of broadcasting (BRD) has positive and significant effect on gross domestic product with coefficient 0.2512 and 0.0494 with p-values 0.1220 and 0.7555 > 0.05. However, the third period lag of BRD has negative and insignificant effect on GDP. The results of the analysis also indicate that the first period lag of motion, picture and sound recording (MPSRM) has positive and significant effect on GDP with a coefficient of 0.7054. This implies that increase in MPSRM in the previous year tend to increase GDP by 0.7054. However, the second and third period lags of MPSRM has positive and insignificant effect on GDP. In addition to the above, the first period lag of log publicity (PUB) has positive and insignificant effect on GDP with coefficient 6.00E-05 and the second and third period lag of Log PUB has negative and insignificance effect on GDP. This implies that increase in the log publicity in the two previous years tend to decrease log of GDP. Furthermore, the first period lag of telecommunication and information service (TIS) has negative and significance effect on GDP with coefficient -0.7342 implying that increase in TIS in the previous section tend to decrease GDP by 0.7342. However, the second and third period lag of TIS has negative and insignificant effect on GDP. The Error Correction Term (ECT) has a negative and significant value (ECT (-1) = -0.2506, p-value = 0.0332 < 0.05). This indicates that the ECT follows the theoretical expectation. The significance of the Error Correction Mechanism affirms the existence of long-run relationship between the variables under study. This coefficient indicates that a deviation from the long run equilibrium level of information and communication technology in one year is corrected by 25.1% over the following year. The Adjusted R-squared of Error Correction Model is 0.8519. This implies that information and communication technology explained 85.2% of the variations in gross domestic product. The overall significant of the model was tested using the F-statistic. The F-statistic which gives a value of 4.8441 indicates that the model is significant implying that at least one of the independent variables have significant effect on gross domestic product in Nigeria. 5 presents the result for Granger causality test. It was revealed that LNMPSRM and LNGDP have a bi-directional relationship. However, there was independent relationship between LNPUB, LNTIS, LNBRD and LNGDP. This implies absent of causality between these variables.
| Series: LNGDP LNBRD LNPUB LNMPSRM LNTIS | — | — | — | — |
|---|---|---|---|---|
| Lags interval (in first differences): 1 to 1 | ||||
| Unrestricted Co-integration Rank Test (Trace) | ||||
| Hypothesized No. of CE(s) | Eigenvalue | Trace Statistic | 0.05 Critical Value | Prob.** |
| None * | 0.711006 | 86.46883 | 69.81889 | 0.0013 |
| At most 1 | 0.479786 | 39.29760 | 47.85613 | 0.2486 |
| At most 2 | 0.201895 | 14.46402 | 29.79707 | 0.8136 |
| At most 3 | 0.114198 | 5.894441 | 15.49471 | 0.7080 |
| At most 4 | 0.033288 | 1.286483 | 3.841466 | 0.2567 |
| Unrestricted Co-integration Rank Test (Maximum Eigenvalue) | ||||
| Hypothesized No. of CE(s) | Eigenvalue | Max-Eigen Statistic | 0.05 Critical Value | Prob.** |
| None * | 0.711006 | 47.17123 | 33.87687 | 0.0008 |
| At most 1 | 0.479786 | 24.83358 | 27.58434 | 0.1081 |
| At most 2 | 0.201895 | 8.569576 | 21.13162 | 0.8655 |
| At most 3 | 0.114198 | 4.607959 | 14.26460 | 0.7903 |
| At most 4 | 0.033288 | 1.286483 | 3.841466 | 0.2567 |
Table text extracted from the original PDF; superscript letters are shown inline. The original table image is below.
View original table image
| Variables | Level | — | — | — | First Difference | — | — | — |
|---|---|---|---|---|---|---|---|---|
| ADF Statistic | 5% Critical Value | 10% Critical Value | P-value | ADF Statistic | 5% Critical Value | 10% Critical Value | P-value | |
| LNGDP | -1.3228 | -2.9390 | -2.6079 | 0.6093 | -3.3197 | -2.9412 | -2.6091 | 0.0209 |
| LNBRD | -1.0079 | -2.9390 | -2.6079 | 0.7410 | -6.0882 | -2.9412 | -2.6092 | 0.000O |
| LNPUB | -0.6670 | -2.9390 | -2.6079 | 0.8433 | -5.9884 | -2.9412 | -2.6091 | 0.0000 |
| LNMPSRM | -1.0857 | -2.9411 | -2.6033 | 0.7115 | -2.7384 | -2.9412 | -2.6091 | 0.0470 |
| LNTIS | -0.0147 | -2.9390 | -2.6080 | 0.9514 | -6.6821 | -2.9412 | -2.6091 | 0.0000 |
Table text extracted from the original PDF; superscript letters are shown inline. The original table image is below.
View original table image
Results and Discussion
Results and Discussion
Conclusion and Recommendations
The main purpose of this study is to examine the long and short run relationship between gross domestic product and information and communication sectors for the period 1981 -2020. Johansen co-integration test, vector error correction model and Granger Causality test were employed to analyzed the data. The stationarity test for the variables under study was conducted through the application of ADF test, and the results showed that all the variables were not stationary at level; however, become stationary after first difference. Furthermore, the result of the Johansen co-integration test revealed that significant long run relationship exists between GDP and ICT sectors of the economy. Similarly, the result of the VECM revealed that LNMPSRM at first lag has positive and significant effect on GDP, also LNTIS at first lag has negative and significant effect on GDP. The Granger Causality result indicates a bi-directional relationship between LNMPSRM and LNGDP; and independent relationship between LNPUB, LNTIS, LNBRD and LNGDP. The ECT coefficient indicates that a deviation from the long run equilibrium level of the contribution of ICT sector in one year is corrected by 25.1 percent over the following year. It was concluded that information and communication technology sector contribute positively to gross domestic product in Nigeria. In order to ensure sustainable economic growth, the study recommends that Nigeria as a country should increase her investments in ICT sector as this will enable all the subsectors to contribute positively toward GDP of the Country.
Figures and tables from the paper
| — | LNGDP | LNBRD | LNMPSRM | LNPUB | LNTIS |
|---|---|---|---|---|---|
| Mean | 8.703573 | 3.678560 | 3.760894 | 2.452880 | 1.315383 |
| Median | 8.929050 | 3.424563 | 4.475675 | 2.568085 | 1.241264 |
| Maximum | 11.93377 | 5.674045 | 7.698728 | 7.170758 | 3.614156 |
| Minimum | 4.926746 | 1.658228 | -0.544727 | -2.813411 | -1.021651 |
| Std. Dev. | 2.408241 | 1.130771 | 3.010009 | 3.894910 | 1.352602 |
| Skewness | -0.252388 | 0.340765 | -0.222062 | -0.093767 | 0.195179 |
| Kurtosis | 1.625190 | 2.077129 | 1.479703 | 1.296882 | 1.977288 |
| Jarque-Bera | 3.574836 | 2.193624 | 4.180913 | 4.892968 | 1.997199 |
| Probability | 0.167392 | 0.333934 | 0.123631 | 0.086598 | 0.368395 |
| Sum | 348.1429 | 147.1424 | 150.4357 | 98.11518 | 52.61532 |
| Sum Sq. Dev. | 226.1854 | 49.86708 | 353.3461 | 591.6426 | 71.35175 |
| Observations | 40 | 40 | 40 | 40 | 40 |
Table text extracted from the original PDF; superscript letters are shown inline. The original table image is below.
View original table image
| Variable | Coefficient | t-statistics | P-value |
|---|---|---|---|
| ECT(-1) | -0.2506 | -2.1672 | 0.0332** |
| LNGDP(-1) | -0.1289 | -0.4087 | 0.6839 |
| LNGDP(-2) | -0.5281 | -1.8434 | 0.0690* |
| LNGDP(-3) | -0.1985 | -0.9462 | 0.3469 |
| LNBRD(-1) | 0.2512 | 1.5629 | 0.1220 |
| LNBRD (-2) | 0.0494 | 0.3125 | 0.7555 |
| LNBRD (-3) | -0.1014 | -1.1891 | 0.2379 |
| LNMPSRM(-1) | 0.7054 | 4.0672 | 0.0001*** |
| LNMPSRM (-2) | 0.07155 | 0.3329 | 0.7401 |
| LNMPSRM (-3) | 0.1927 | 0.9140 | 0.3635 |
| LNPUB (-1) | 6.00E-05 | 0.000627 | 0.9995 |
| LNPUB (-2) | -0.03677 | -0.3342 | 0.7391 |
| LNPUB (-3) | -0.1063 | -1.4391 | 0.1540 |
| LNTIS(-1) | -0.7342 | -3.0050 | 0.0035** |
| LNTIS (-2) | -0.2333 | -1.1425 | 0.2566 |
| LNTIS (-3) | -0.1552 | 0.1541 | 0.3168 |
| Constant | 0.2947 | 4.1489 | 0.0710* |
| R-square | 0.8519 | ||
| Adjusted R-square | 0.6760 | ||
| F-statistics | 4.8441 |
Table text extracted from the original PDF; superscript letters are shown inline. The original table image is below.
View original table image
| Null Hypothesis: | Obs | F-Statistic | Prob. |
|---|---|---|---|
| LNBRD does not Granger Cause LNGDP | 37 | 1.26952 | 0.3026 |
| LNGDP does not Granger Cause LNBRD | 0.66490 | 0.5802 | |
| LNMPSRM does not Granger Cause LNGDP | 37 | 7.75684 | 0.0006 |
| LNGDP does not Granger Cause LNMPSRM | 3.46822 | 0.0283 | |
| LNTIS does not Granger Cause LNGDP | 37 | 0.79231 | 0.5078 |
| LNGDP does not Granger Cause LNTIS | 0.72163 | 0.5470 | |
| LNPUB does not Granger Cause LNGDP | 37 | 1.30727 | 0.2903 |
| LNGDP does not Granger Cause LNPUB | 2.48473 | 0.0798 | |
| LNMPSRM does not Granger Cause LNBRD | 37 | 0.89352 | 0.4558 |
| LNBRD does not Granger Cause LNMPSRM | 1.91321 | 0.1487 | |
| LNTIS does not Granger Cause LNBRD | 37 | 0.80546 | 0.5008 |
| LNBRD does not Granger Cause LNTIS | 0.82082 | 0.4927 | |
| LNPUB does not Granger Cause LNBRD | 37 | 0.88955 | 0.4578 |
| LNBRD does not Granger Cause LNPUB | 0.24710 | 0.8627 | |
| LNTIS does not Granger Cause LNMPSRM | 37 | 1.57240 | 0.2166 |
Table text extracted from the original PDF; superscript letters are shown inline. The original table image is below.
View original table image
References
11 in the original paper- Alani J. Effects of technological progress and productivity on economic growth in Uganda. Procedia Economics and Finance. 2012 Jan 1;1:14-23.
- Albiman ZS. The role of ICT use to the economic growth in Sub Saharan African region (SSA). Journal of Science and Technology Policy Management. 2016;7(3):306-329
- Billan Y, Mishchuk H, Samoliuk N, Grshnova O. ICT and economic growth: Links and possibilities of engaging. Intellectual Economics. 2019;13(1):1-12.
- Heeks R. Understanding E-Governance for development. Government working paper series, Paper No 11, Manchester Institute for Development Policy and management. University of Manchester; 2001.
- Hodrab R, Maitah M, Lubos S. The effect of information and communication technology on economic growth: Arab World Case. International Journal of Economics and Financial Issues. 2016;6(2):765-775.
- ITU. Internet users; c2016. Available at https://www.itu.int/. Accessed at 23 rd February, 2022.
- NCC. Industry Statistics; c2018. Available at: http:// www.ncc.gov.ng. Accessed: 23 rd February, 2022.
- Oladimeji T, Folayan GB. ICT and its impact on national development in Nigeria. Journal of Engineering and technology. 2017. ISSN: 2319-9873.
- Ukuoma HC. The effect of ICT on economic growth in Nigeria. International journal of Management, technology and engineering, 2019;9(2):2292-302.
- Walter P. Information and Communication Technology (ICT) In Education in Sub-Saharan Africa: A Comparative Analysis of Basic E-Readiness in School, 2015.
- Waqar J. Impact of ICT on GDP per worker: A new approach using confidence in justice system as an instrument, Evidence from 41 European Countries 19962010. MSc Thesis submitted to Stockholm, Sweden, 2015.