
Research article · 2022 · Full text
International Journal of Statistics and Applied MathematicsPerformance criteria of modified multihalver technique for detecting outlying values of body mass index (BMI): A higher risk factor and prognosis of COVID-19 infections
Volume 7(2) · Pages 99–104 · DOI: 10.22271/maths.2022.v7.i2b.800 ↗
Research areasCOVID-19 Pandemic ImpactsCOVID-19 epidemiological studies
Abstract
Author-writtenThe detection of outlier (s) is often thought of as a means to eliminate such aberrant observation(s) from a set of data to avoid anomalies or further analysis. But outliers can be interesting observations in themselves as they can be leading information to certain abnormal condition(s) just like the case of the recent discovery of obesity being a higher risk factor and prognosis to the novel COVID-19 pandemic. This study is focused on detecting outlying values of Body Mass Index (BMI) which are higher risk factors and prognosis of COVID-19 infections using the modified Multihalver technique for detecting outliers. The data of weights in kilogram (kg) and heights in meter (m) was collected from the records of a hospital and the Body Mass Index (BMI) was calculated as weight in kilogram divided by height in meter squared. The distribution of the computed BMI was fitted to the robust criteria of the modified Multihalver technique and the outlying values which are indices of underweight, overweight and obesity were detected as outliers. The study encourages obesity prevention at all ages and recommendation is on appropriate dieting to stay off the possible underlying diseases and in particular the novel COVID-19 pandemic.
Summary
Source-checkedPlain-language reading of the full paper, prepared with AI and checked against the text. Each point links to the authors' own words.
Why it matters
- Obesity and being overweight are significant risk factors for several chronic conditions, including cardiovascular disease, stroke, and type 2 diabetes. View evidence ↗
- Individuals with obesity and related conditions like hypertension and diabetes face a higher risk of COVID-19 infections. View evidence ↗
- Body Mass Index (BMI), calculated as weight in kilograms divided by height in meters squared, is the standard measure for overweight and obesity prevalence. View evidence ↗
The question
- The study aims to use the modified Multihalver technique to detect outlying BMI values, which serve as risk factors and prognostic indicators for COVID-19. View evidence ↗
What they did
- The researchers collected weight and height data from 93 inpatients and outpatients at Alpha Hospital in Nasarawa. View evidence ↗
- The Modified Multihalver Technique (MMT) was employed as a robust parametric method to detect multiple outliers while avoiding masking and swamping effects. View evidence ↗
- BMI values were computed using a health calculator based on the formula of weight in kilograms divided by height in meters squared. View evidence ↗
What they found
- The detected outlying BMI values were those that fell outside the normal range of 18.5 to 29.9. View evidence ↗
- Out of the 93 patients analyzed, the MMT identified 23 individuals as having outlying BMI values. View evidence ↗
- Among the outliers, 10 individuals (10.75% of the total sample) were classified as underweight. View evidence ↗
- Among the outliers, 10 individuals (10.75% of the total sample) were classified as overweight. View evidence ↗
- Among the outliers, 3 individuals (2.2% of the total sample) were classified as Obese class I. View evidence ↗
- The 23 outlying BMI values detected by the MMT were in 100% agreement with the World Health Organization's BMI classification system. View evidence ↗
What it means
- The authors conclude that the Modified Multihalver Technique is an efficient method for detecting multiple outliers without the issues of masking, swamping, or thresholds. View evidence ↗
- The authors recommend adopting the Modified Multihalver Technique in public health as a tool for risk detection. View evidence ↗
Visual summary
2 visualsIllustrations explain the paper; charts are replotted from the paper's own table values.
MMT Outlier Detection Workflow
AI-generated conceptual illustration (human body silhouettes of varying sizes). It explains the idea and does not show study data.
View source evidence ↗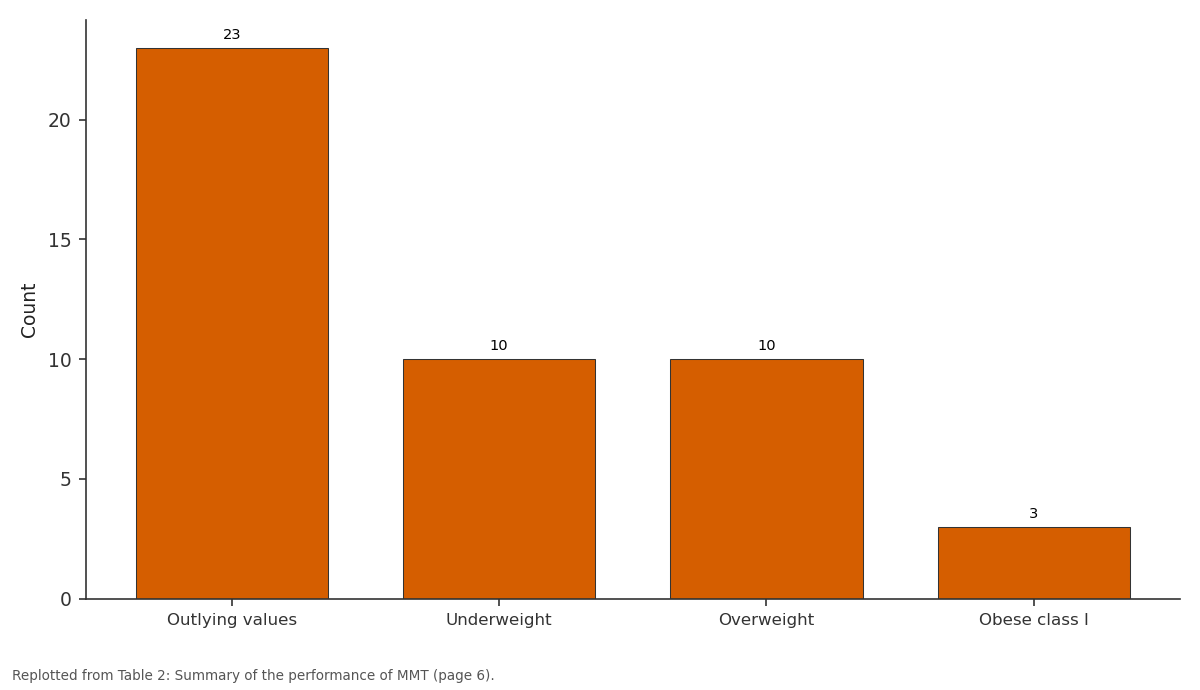
Count: Outlying values vs Underweight vs Overweight vs Obese class I
Replotted from Table 2 (page 6) of the original paper. Every bar is the paper's own table value.
View source evidence ↗Figures & tables
From the original paper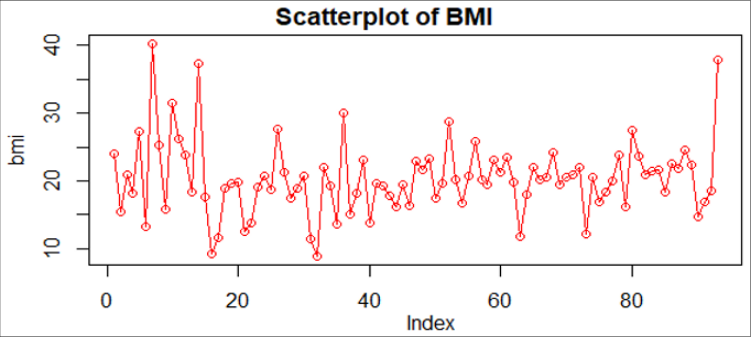 Figure 1
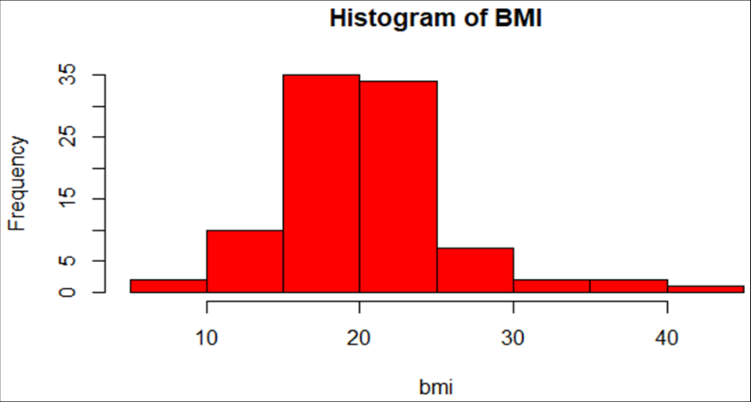 Figure 2
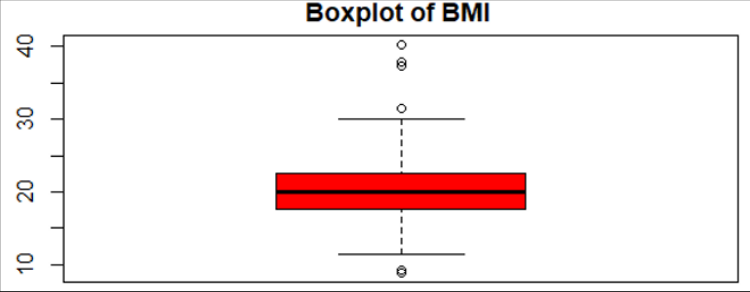 Figure 3
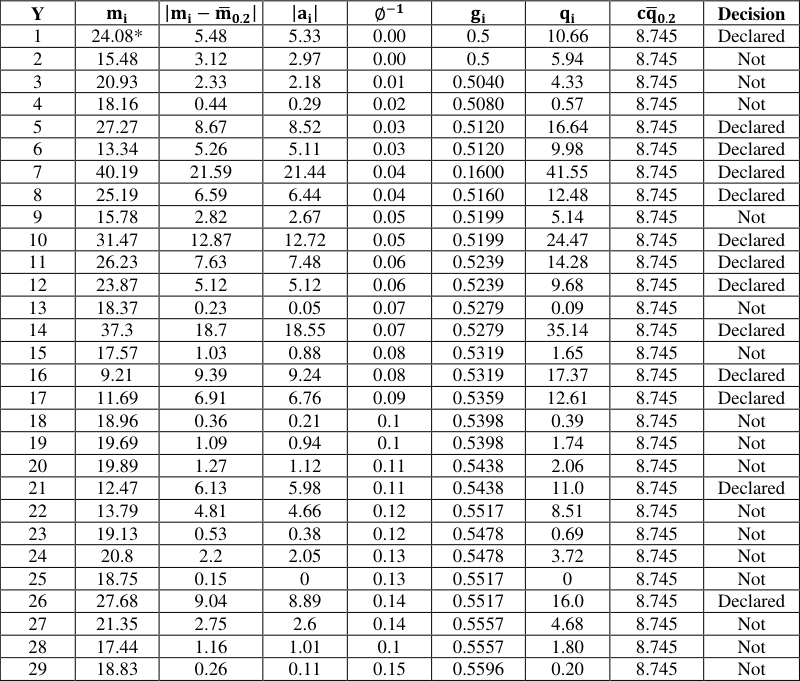 Table 1
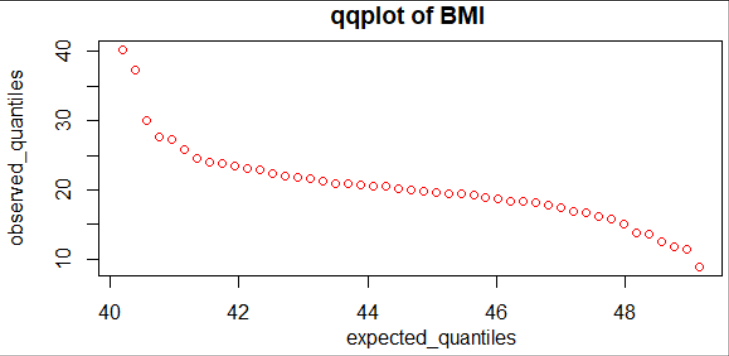 Figure 4
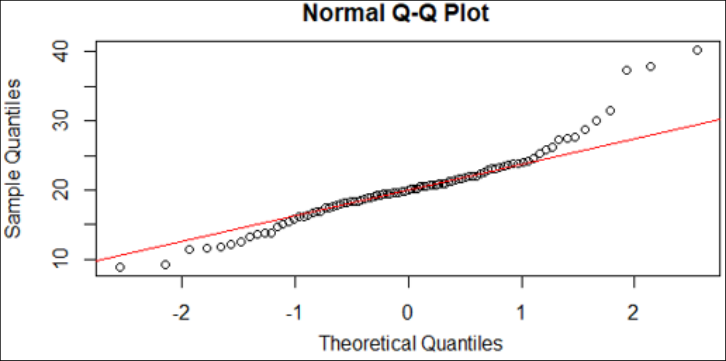 Figure 5
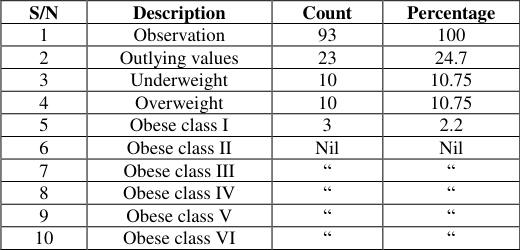 Table 2
Introduction
Worldwide, there are more than one billion overweight adults; at least three million of them are obese. Obesity and overweight poses a major risk for chronic diseases such as type 2 diabetes, cardiovascular disease, hypertension, stroke and certain forms of cancer (Williams et al. 2015) [12] . The main causes of higher Body Mass Index (BMI) are increased consumption of energy dense foods high in saturated fats and sugars and reduced physical activity. The prevalence of overweight and obesity is usually measured by using BMI defined as the weight in kilograms divided by the square of the height in meters (kg/m 2 ). A BMI of over 25 kg/m 2 is defined as overweight, and a BMI of over 30 kg/m 2 as obesity class I. BMI over 35 kg/m 2 as obesity class. II. BMI over 40 kg/m 2 as obesity class. III. Or severe obesity. BMI over 40 kg/m 2 as morbid obesity and BMI over 45 kg/m 2 classified as super obesity. However, BMI between 18 kg/m 2 -25 kg/m 2 are considered normal and people with a BMI below 18.5 kg/m 2 tend to be under nutrition and are associated with ill health. These markers provide common benchmarks for assessment but the risks of disease in all populations can increase progressively from lower BMI levels. BMI is an indicator of the healthiness of an individual or otherwise on the nutrition scale (Astrup and Pedersen, 2011; Fock and Khoo, 2013) [1,2] . BMI increases amongst middle-aged and elderly people, who are at the greater risk of health problems. In countries undergoing nutrition transition, over-nutrition often co-exists with under-nutrition. The distribution of BMI is shifting upwards in several populations. Recently, it has been shown that people who were undernourished in early life and then became obese in adulthood, tend to develop conditions such as high blood pressure, heart disease and diabetes at an earlier age and in more severe form than those who were never undernourished (Fock and Khoo, 2013) [2] . Obesity is a major contributor to the global burden of chronic diseases and disability often co-exist in developing nations with under nutrition, a complex condition with serious social and psychological dimensions, affecting virtually all ages and socioeconomic groups. The consequences range from increased risk of premature death, to serious chronic conditions that reduce the overall quality of life. Of especial concern is the increasing incidence of child obesity which was not the case in the past. The rising epidemic reflects the profound changes in society and behavioral patterns of communities over recent decades. While genes are important in determining a person's susceptibility to weight gain; energy balance is determined by calorie intake and physical activity. Therefore, societal changes and worldwide nutrition transition are driving the obesity epidemic. Economic growth, modernization, urbanization and globalization of food markers are just some of the forces thought to underlie the epidemic. As the income rises and populations become more urban, diet high in complex carbohydrates has given way to more varied diets with a higher proportion of fats, saturated fats and sugars. At the same time, there are large shifts towards less physically demanding work have been observed worldwide. Moves towards less physical activity are also found in the increasing use of automated transport, technology in the home, and more passive leisure pursuits (Fock and Khoo, 2013) [2] . [5] confirmed that the history of human corona viruses began in 1965 and first characterized in the 1960s. The current scientific consensus is that the virus is most likely of zoonotic origin, from bats or another closelyrelated mammal. The study of Karina CP, et al. (2020) [4] on Body Mass Index and prognosis of COVID-19 infections carried out a systematic review in order to investigate a possible association between body weight and prognosis among patient diagnosed with COVID-19. The outcome of their study shows that obesity is a higher risk factor and prognosis of COVID-19 infections. This study therefore is focused on detecting outlying values of BMI which are higher risk factors and prognosis of COVID-19 infections using the modified Multihalver technique for detecting outliers. The detection of outlier(s) is often thought of as a means to eliminate such aberrant observation(s) from a set of data to avoid anomalies or further analysis. But outliers can be interesting observations in themselves as they can be leading information to certain abnormal condition(s) just like the case of the recent discovery of the outlying values of BMI as a higher risk factor and prognosis to the novel COVID-19 pandemic. The study is aimed on detecting outlying values of BMI in a given distribution of BMI computed from a set of data on weights and heights of in -patients and out patients collected from Alpha Hospital, Nasarawa by using the robust criteria of modified Multihalver technique.
Materials and Method 2.1 The Modified Multihalver Technique (MMT)
The MMT is a robust parametric technique for detecting multiple outliers' in a large sample without masking and swamping effect (Usman and Shittu, 2013; Usman, 2015; Usman and Shittu, 2015) [7,8,10] . It is a modification of the Multihalver method of nominating outlier by Fernholz et al., (2004) [13] . Multihalver method comes with myriads of limitations such as: Rigorous algorithm to detect outliers Perform well when sample size is small and even numbered. If sample is large it will required been broken into smaller sample sizes to function adequately
with the sequence of Gaussian quantiles: The constant C = 1.5 is the reasonable multiplier of the critical value
Data Collection
The data set on weights (kg) and heights (m) of 93 in/outpatients of the Alpha Hospital, Nasarawa used for this research was collected from the records and statistics section of the hospital. The computation of BMI was done using health calculator. BMI is a person's weight in kilogram divided by the square of the height in meters. The health calculator was employed for the purpose of speed and accuracy.
Determination of underweight, overweight and obesity
The body mass index (BMI) is currently the choice of measurement by many physicians and researchers studying obesity. The BMI uses a mathematical formula that accounts for both a person's weight and height. The BMI equals a person's weight in kilograms divided by height in meters squared (𝐵𝑀𝐼 = 𝑘𝑔 𝑚 2 ) ⁄ . It is important to understand what "healthy weight" means. Healthy weight is defined as a body mass index equals to or greater than 19 and less than 25 among all people 20 years of age or over. Generally obesity is defined as a BMI equal to or greater than 30. The World Health Organization uses a classification system using BMI to define overweight and obesity as stated in the introduction and to be more specific as follow:
(https://www.euro.who.int/en/health-topics/disease-prevention/nutrition/a-healthy-lifestyle/body-mass-index-bmi) A BMI of 15 to 18 is defined as underweight (irrespective of age and gender) A BMI of 18.5 to 24.9 is defined as normal. A BMI of 25 to 29.9 is defined as a "pre-obese' (overweight) A BMI of 30 to 34.99 is defined as "obese class I" A BMI of 35 to 39.99 is defined as "obese class II" A BMI of or greater than 40.00 is defined as obese class III" A BMI of 45 to 50 is defined as "obese class IV" (morbidity obese)
A BMI of 50 to 60 is defined as "obese class V" (super obese) A BMI of or greater than 60 is defined as "obese class VI" (hyper-obese)
Result and Discussion
The plots of the distribution of the BMI generated from the sets of data on weights and heights of patients are shown in in
Conclusion
The performance of the robust criteria of Modified Multihalver Technique was ascertained in this study. The twenty three (23) outlying values of Body Mass Index (BMI) detected by MMT were 100% in agreement with World Health Organization's classification system of BMI as defined. The Modified Multihalver Technique is no doubt an efficient method of multiple outlier detection without threshold, masking and swamping effect.
Recommendation
The Modified Multihalver Technique should be adopted in the field of public health as risk detector because of its efficiency as proven in this study. Persons who are obese as discussed in this paper are recommended to be conversant with the safety protocols of COVID-19 since obesity have been confirmed to be a risk factor of COVID-19 and a predictor of mortality. To avoid higher BMI, Discipline and control of diet with high proportion of fats, saturated fats, sugar and involvement in regular physical activity is highly recommended.
Figures and tables from the paper
| Y | 𝐦 𝐢 | |𝐦 𝐢−𝐦̅ 𝟎.𝟐| | |𝐚| 𝐢 | ∅−𝟏 | 𝐠 𝐢 | 𝐪 𝐢 | 𝐜𝐪̅ 𝟎.𝟐 | Decision |
|---|---|---|---|---|---|---|---|---|
| 1 | 24.08* | 5.48 | 5.33 | 0.00 | 0.5 | 10.66 | 8.745 | Declared |
| 2 | 15.48 | 3.12 | 2.97 | 0.00 | 0.5 | 5.94 | 8.745 | Not |
| 3 | 20.93 | 2.33 | 2.18 | 0.01 | 0.5040 | 4.33 | 8.745 | Not |
| 4 | 18.16 | 0.44 | 0.29 | 0.02 | 0.5080 | 0.57 | 8.745 | Not |
| 5 | 27.27 | 8.67 | 8.52 | 0.03 | 0.5120 | 16.64 | 8.745 | Declared |
| 6 | 13.34 | 5.26 | 5.11 | 0.03 | 0.5120 | 9.98 | 8.745 | Declared |
| 7 | 40.19 | 21.59 | 21.44 | 0.04 | 0.1600 | 41.55 | 8.745 | Declared |
| 8 | 25.19 | 6.59 | 6.44 | 0.04 | 0.5160 | 12.48 | 8.745 | Declared |
| 9 | 15.78 | 2.82 | 2.67 | 0.05 | 0.5199 | 5.14 | 8.745 | Not |
| 10 | 31.47 | 12.87 | 12.72 | 0.05 | 0.5199 | 24.47 | 8.745 | Declared |
| 11 | 26.23 | 7.63 | 7.48 | 0.06 | 0.5239 | 14.28 | 8.745 | Declared |
| 12 | 23.87 | 5.12 | 5.12 | 0.06 | 0.5239 | 9.68 | 8.745 | Declared |
| 13 | 18.37 | 0.23 | 0.05 | 0.07 | 0.5279 | 0.09 | 8.745 | Not |
| 14 | 37.3 | 18.7 | 18.55 | 0.07 | 0.5279 | 35.14 | 8.745 | Declared |
| 15 | 17.57 | 1.03 | 0.88 | 0.08 | 0.5319 | 1.65 | 8.745 | Not |
| 16 | 9.21 | 9.39 | 9.24 | 0.08 | 0.5319 | 17.37 | 8.745 | Declared |
| 17 | 11.69 | 6.91 | 6.76 | 0.09 | 0.5359 | 12.61 | 8.745 | Declared |
| 18 | 18.96 | 0.36 | 0.21 | 0.1 | 0.5398 | 0.39 | 8.745 | Not |
| 19 | 19.69 | 1.09 | 0.94 | 0.1 | 0.5398 | 1.74 | 8.745 | Not |
| 20 | 19.89 | 1.27 | 1.12 | 0.11 | 0.5438 | 2.06 | 8.745 | Not |
| 21 | 12.47 | 6.13 | 5.98 | 0.11 | 0.5438 | 11.0 | 8.745 | Declared |
| 22 | 13.79 | 4.81 | 4.66 | 0.12 | 0.5517 | 8.51 | 8.745 | Not |
| 23 | 19.13 | 0.53 | 0.38 | 0.12 | 0.5478 | 0.69 | 8.745 | Not |
| 24 | 20.8 | 2.2 | 2.05 | 0.13 | 0.5478 | 3.72 | 8.745 | Not |
| 25 | 18.75 | 0.15 | 0 | 0.13 | 0.5517 | 0 | 8.745 | Not |
| 26 | 27.68 | 9.04 | 8.89 | 0.14 | 0.5517 | 16.0 | 8.745 | Declared |
| 27 | 21.35 | 2.75 | 2.6 | 0.14 | 0.5557 | 4.68 | 8.745 | Not |
| 28 | 17.44 | 1.16 | 1.01 | 0.1 | 0.5557 | 1.80 | 8.745 | Not |
| 29 | 18.83 | 0.26 | 0.11 | 0.15 | 0.5596 | 0.20 | 8.745 | Not |
Table text extracted from the original PDF; superscript letters are shown inline. The original table image is below.
View original table image
| S/N | Description | Count | Percentage |
|---|---|---|---|
| 1 | Observation | 93 | 100 |
| 2 | Outlying values | 23 | 24.7 |
| 3 | Underweight | 10 | 10.75 |
| 4 | Overweight | 10 | 10.75 |
| 5 | Obese class I | 3 | 2.2 |
| 6 | Obese class II | Nil | Nil |
| 7 | Obese class III | “ | “ |
| 8 | Obese class IV | “ | “ |
| 9 | Obese class V | “ | “ |
| 10 | Obese class VI | “ | “ |
Table text extracted from the original PDF; superscript letters are shown inline. The original table image is below.
View original table image
References
10 in the original paper- Flock, Khoo. Diet and Exercise in management of obesity and overweight. Journal of Gastroenterology and Hepatology. 2013;28(4):59-63.
- Jerry RB. Obesity. 2019. http://www.medicinenet.com/obesity_wieght_loss/article. htm
- Karina CP, Racheal R, Ana LCM, Laura SW, Lucas LC. Body Mass index and Prognosis of COVID-19 Infection. A systematic Review. 2020;11:562.
- Khan JS. History and recent advances in Corona virus Discovery. The Pediatric infectious diseases Journal. 2005;24(11):5223-5227.
- Printable Medical Forms, Letters & Sheets. 2019. https://www.bestmedcalforms.com/bmi-charts.html.
- Usman YB, Shittu OI. On Detection of Multiple Outliers in a Univariate Data Set: Commonwealth Association of Polytechnics (CAPA) Scientific Journal. 2015;3(1):1-10.
- Usman YB, Shittu OI, Adepoju KA. Performance of Modified Multihalver distribution for detecting aberrant observations in time series. Nasara Journal of Science and Technology. 2014;4(1):1-22.
- Usman YB, Shittu OI. On the Sensitivity of the Modified Multihalver Criterion for detecting outliers in time series. NASARA Journal of Science and Technology. 2013, 3(1).
- Williams EP, Mesidor M, Winters K, Dubbert PM, Wyatt SB. Overweight and obesity prevalence, consequences, and causes of a growing public health problem. Current obesity Rep. 2015;(3):363-370.
- Jordan BA, Fernholz BD, Boussac M, Xu C, Grigorean G, Ziff EB, et al. Identification and verification of novel rodent postsynaptic density proteins. Molecular & Cellular Proteomics. 2004;3(9):857-871.