
Research article · 2022 · Full text
International Journal of Statistics and Applied MathematicsAgricultural sector and gross domestic product in Nigeria: Evidence from co-integration and vector error correction models
Volume 7(2) · Pages 159–164 · DOI: 10.22271/maths.2022.v7.i2b.810 ↗
Research areasEnergy, Environment, Economic GrowthEconomic Growth and DevelopmentMarket Dynamics and Volatility
Abstract
Author-writtenThe main objective of this study is to examined the relationship between agricultural sector and gross domestic product in Nigeria using co-integration and vector error correction model. The data used in this study covers a period 1981-2020 obtained from National Bureau of Statistics (NBS). The study employed Johansen co-integration test, Vector Error Correction Model and Granger Casualty test. The results of the Johansen co-integration test revealed three co-integrating equation indicating the existence of long run relationship between agricultural sector and GDP. The finding also revealed an existence of short run relationship between agricultural sub-sectors and GDP. In addition, the Granger Casualty test revealed that there is a bi-directional relationship between GDP, forestry and fishing and, uni-directional relationship between GDP, crop production and livestock. Based on this findings, it was recommended that government should provide special incentives to farmers and also provides farming input to farmers at subsidized rate, this will go a long way in boosting agricultural activities there by making significant impact on gross domestic product.
Summary
Source-checkedPlain-language reading of the full paper, prepared with AI and checked against the text. Each point links to the authors' own words.
Why it matters
- The agricultural industry has historically served as the primary foundation of the Nigerian economy. View evidence ↗
- In low and middle-income countries, agriculture is a major contributor by providing food, employment, industrial raw materials, and foreign earnings. View evidence ↗
- The contribution of the agricultural sector to Nigeria's real GDP began to decline following the discovery of oil in the 1970s. View evidence ↗
The question
- The study aims to examine the relationship between Nigeria's agricultural sector and its gross domestic product (GDP) using co-integration and vector error correction models. View evidence ↗
- The researchers sought to fill a gap in existing literature by specifically estimating the contributions of agricultural sub-sectors to GDP. View evidence ↗
What they did
- The study analyzed secondary data from the National Bureau of Statistics covering the period from 1981 to 2020. View evidence ↗
- The analysis utilized the Johansen co-integration test, the Vector Error Correction Model (VECM), and the Granger Causality test. View evidence ↗
- The Augmented Dickey Fuller (ADF) test was used to determine the stationarity of the data. View evidence ↗
What they found
- The Johansen co-integration test identified three co-integrating equations, indicating a long-run relationship between the agricultural sector and GDP. View evidence ↗
- Forestry production's second period lag had a positive and significant effect on GDP, with a coefficient of 912.6890. View evidence ↗
- The third period lag of fishery production showed a positive and significant effect on current GDP, with a coefficient of 276.5752. View evidence ↗
- The agricultural sub-sectors explained 94.6% of the variations in GDP, as indicated by an Adjusted R-squared of 0.9464. View evidence ↗
- Granger causality tests revealed bi-directional relationships between GDP and fishery/fishing, as well as between forestry and fishing, and fishing and crop production. View evidence ↗
- Uni-directional relationships were found between GDP and crop production, GDP and livestock, and several other sub-sector pairings. View evidence ↗
What it means
- The authors recommend that the government provide special incentives and subsidized farming inputs to farmers to boost agricultural activities and impact GDP. View evidence ↗
Visual summary
1 visualsIllustrations explain the paper; they do not show study data.
Causality Flowchart
AI-generated conceptual illustration (Nigerian agricultural landscape featuring crops, livestock, fish, and forest trees). It explains the idea and does not show study data.
View source evidence ↗Figures & tables
From the original paper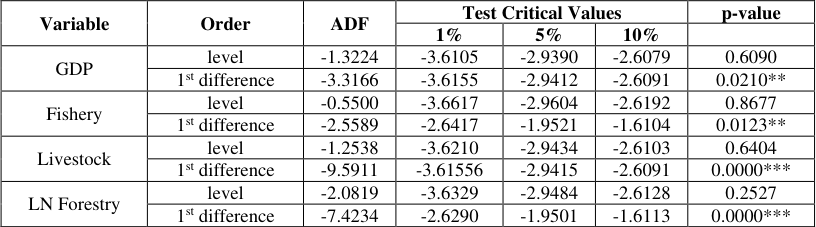 Table 1
 Table 2
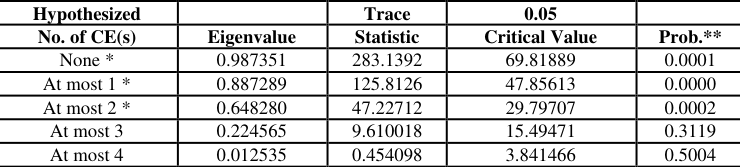 Table 3
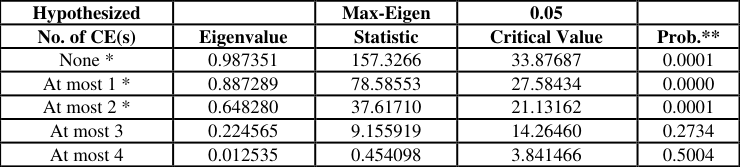 Table 4
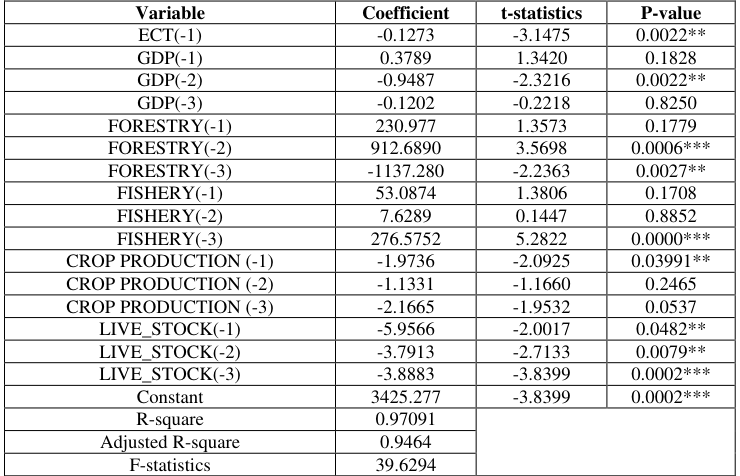 Table 5
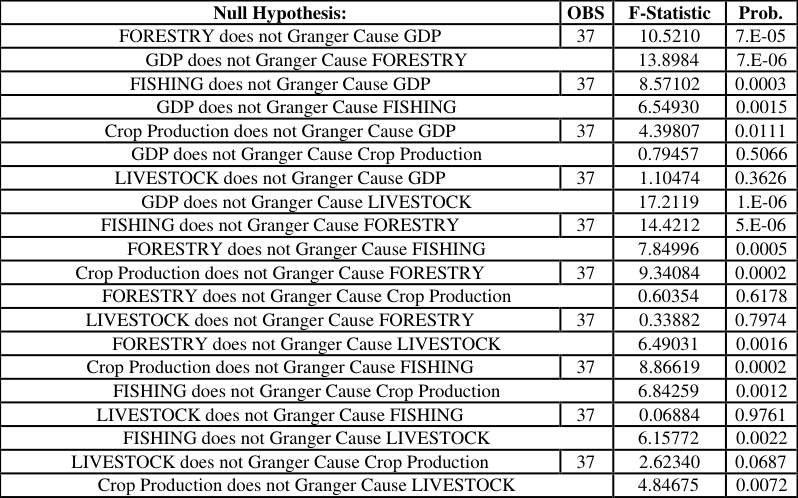 Table 6
Introduction
The agriculture industry has historically been the backbone of Nigeria's economy. The sector was thought to be the economy's mainstay in the early 1960s. It is also seen as the major driver of development and growth. In fact, Nigeria's poverty-reduction Millennium Development Goals (MDGs) program includes the agricultural sector, underlining the importance of agriculture in the Nigerian economy. The agricultural sector remains the largest contributor in lowest and middle-income countries. This is evidence by its ability in providing inputs, food items, creating employment opportunities, providing raw materials for other industrial use, source of foreign earnings from surplus exportation, and value added in various production processes (Okoro, 2011) [14] . Furthermore, several scholars (Gardner, 2005; Chebbi, 2010) [7,4] have identified a number of concerns about the agriculture sector's impact on economic growth. Gardner (2005) [7] asked, "Is agriculture an engine of growth?" Lavorel et al. (2013) [12] investigated the causation relationship between agricultural value added per worker and gross domestic product (GDP) per capita for 85 nations. Nonetheless, their data indicated a huge claim. They claim to have discovered a causal association between agricultural value added and growth for developing nations, but not for developed countries. This finding supports the preceding assertion that the agriculture sector has served as the backbone of developing economies. Matahir (2012) [13] in his study on the importance of agriculture in economic growth and how it interacts with other sectors of the economy, took a different stance. The non-causality link between agriculture and other Tunisian economic sectors was investigated using time series Johansen cointegration techniques. Policymakers should consider agricultural sectors as crucial tools in their examination of inter-sectorial growth policies, according to their results. Though the agricultural sector has not reaped the benefits of Tunisia's growing service and commerce sectors, its contribution to the country's economic progress cannot be overstated. Jatuporn et al. (2011) [9] who conducted a study in Thailand's economy also opined that . agriculture should be embrace by the economy through proper policy formulation. Despite the political concerns in Northern Cyprus, Katircioglu (2006) [11] maintained the importance of the agricultural sector on the economy of Northern Cyprus in his examination of the impact of the agricultural sector on the economy of Cyprus. According to his conclusions, the agricultural sector plays a critical role in the development of any economy, particularly that of Northern Cyprus, a small island off the coast of Turkey. His research discovered that macroeconomic variables have bi-directional and long-run dynamic causation linkages. That is, the agriculture sector's feedback plays a critical part in the economy's growth. However, research has found that most developing countries are largely agrarian and rural in nature (Katircioglu, 2006; Dim and Ezenekwe, 2013; Jatuporn et al, 2011; Tiffin, 2013) [11, 9, 16] . The fact that a large majority of Nigeria's population lives in rural areas has brought the countryside to the attention of policymakers and decision-makers. Following the discovery of oil in the 1970s, the agricultural sector's productivity/output, as measured by its contribution to real GDP, began to drop (RGDP). According to empirical data, the agricultural sector's contribution of GDP climbed from 29.2 percent to 33.3 percent between 1970 and 1980. In the 1960s and 1970s, the sector accounted for more than 65 percent of overall exports. Exports of cash crops and other agricultural products such as cocoa, rubber, hides, skin, groundnut, and palm, among others, were well-known, and the sector contributed significantly to GDP. The sector has significant potential for the country's economic growth and development. However, after the discovery of the black gold, oil, agriculture's contribution to Nigeria's Gross Domestic Product decreased (post-oil boom) (Aigbokhan, 2001) [3] . This has been a point of concern to many researchers who seeks to find out why the agricultural sector is neglected despite the arguable massive potential? The answers to this question motivate the researcher to embarked on this study in addition, the existing literatures that attempted to estimate the contribution of agricultural sector on GDP do so without estimating the contribution of the specific sub-sectors of agriculture on GDP. Given the so few studies that have estimate the contribution of the sub-sectors such as the fishery, forestry and livestock production on GDP using timeseries data, there is a gap in explaining the real contribution of these sub-sectors of agriculture on gross domestic product in Nigeria. This study aims to fill this gap. The main objectives of this study is assess the relationship between agricultural sector and gross domestic product in Nigeria (1981-2020). Specifically, the study examined whether long run relationship exist between the sub-sectors of agriculture and gross domestic product. In addition, the causal relationship between the sub-sectors to agriculture and gross domestic product was also examined.
Literature Review
On empirical evidence, Adenomon and Ayejola (2019) [2] examine the impact of agriculture and industrialization on Gross Domestic Product in Nigeria using VAR. The results from the VAR model revealed that 58% and 32% of the variation in GDP is explained by agriculture and industrial sectors respectively. Further analysis using SVAR models showed that agriculture and industry accounted for the structural innovations of GDP in Nigeria with agricultural sector having the highest contribution. Anthony (2010) also found that agricultural variables have impact on economic growth. Kamil, Sevin and Festus (2017) [10] empirically examines the impact of agricultural sector on the economic growth of Nigeria, using time series data and found that real gross domestic product, agricultural output and oil rents have a long-run equilibrium relationship. In an another study by Faridi (2012) [6] whose study's main objective was to examine the contribution of agricultural exports to economic growth in Pakistan. The findings of the study showed that agricultural exports have negative and significant effect on economic growth while agricultural exports elasticity is 0.58. Abdul, Didik, Suhel and Azwardi (2018) [1] carried out a study which aimed at investigating the long and short-term relationship between economic growth, human capital, and agriculture sector in Indonesia for the period 1985 -2017. The study found that there is long and short-term equilibrium relationship between variables, there is long and short-term causality in the direction of economic growth, human capital for agriculture added value. The economic growth model indicates that human capital, agriculture added value, population, government expenditure, foreign direct investment, non-agricultural added value, and technology positively and significantly affects economic growth. The brief literature reviewed have revealed the importance of agricultural sector on economic growth. The empirical evidences revealed paucity of studies that has investigate contribution of the sub-sectors of agriculture to GDP. In this research, we attempt to examine the specific contributions of the agricultural sub-sectors (fishery, forestry and livestock) to GDP using Johansen co-integration test, Vector error correction model and Granger Casualty test.
Methodology 3.1 Source and method of Data
Secondary data was used in this study. The secondary data was collected from National Bureau of Statistics (NBS) for the period of twenty-eight years (1981 to 2020).
Statistical Techniques
The study employed Johansen Co-integration test and Vector Error Correction Model to analyzed the data under study.
Johansen Co-integration test
The long run relationship was tested using Johansen Cointegration test. This was necessary due to the non-stationary nature of the variables employed in the study. The maximum Eigen values statistic test the null hypothesis of r cointegrating relations against the alternative of r +1 cointegrating relationship for r = 0, 1, 2, …, n-1. This test statistic is computed as:
Where 𝜆 ̂ is the computed maximum Eigen values and T stands for the sample size. The Trace statistic examine the null hypothesis of r cointegrating relations against the alternative of n co-integrating relations, where n is the number of variable in the system for r = 0, 1, 2, …, n-1. It is computed according to the following formula:
Vector Error Correction Model
The study employed vector error correction model (VECM) to examine the short run relationship between agricultural variables. The approach is capable of taking into account the short-term adjustments of the variables as well as the speed of adjustment of the coefficient. Therefore, the VECM measures the speed at which gross domestic product will revert to its equilibrium following a short term shock to each of them.
The two major conditions that must hold before using the VECM are: i. The variables must be stationary at first difference ii. The co-integration between the variables must exist.
According to Pfaff (2008), the following VECM specifications usually exist:
Where Γ 𝑖 matrices contain the cumulative long run impacts, hence, this VECM specification is signified by long run form. Π =∝ 𝛽 𝑇 is of reduced rank. The dimension of ∝ 𝑎𝑛𝑑𝛽 is 𝑘 × 𝑟 is the co-integration rank, that is, how many long run relationships between the variables do exist. The matrix ∝ is the loading matrix and the coefficients of the long-run relationships are contained in 𝛽
Granger Causality Test
Finally, the study employed Granger Causality to determine the direction of the causality among agricultural variables on gross domestic product which is given as follows:
Where GDP: Gross Domestic Product, Fishery, Livestock, Forestry and Crop production are the sub-sector of agriculture 𝑉 𝑡 = 𝑒𝑟𝑟𝑜𝑟𝑡𝑒𝑟𝑚,t = current period, t-1 = lag period.
Unit Root Test
The Augmented Dickey Fuller (ADF) was employed in testing the stationary of data. The ADF construct a parametric correction for higher-order correlation by assuming that the time series data follow an autoregressive of order p process and adding p lagged difference terms of the dependent variables y to the right hand side of the test regression as follows:
Where 𝑥 𝑡 are optional exogenous regression which may consist of constant or constant and trend. The ADF t-test null hypothesis is given by: 𝐻 0 : 𝜃 = 0, implying that the data needs to be difference to make it stationary. Against the alternative hypothesis: 𝐻 1 : 𝜃 < 0, Implying that the data is trend stationary and needs to be analyzed by means of using time trend in the regression model instead of differencing the data. The test statistics is conventional t-ratio for a:
Where, 𝑎 ⏞ is the estimate of a, and 𝑠𝑒(𝑎) ⏞ is the coefficient standard error The examination of the series for stationarity as presented in Table 2 indicates that the series were not stationary at level. However, after taking the first difference, it was found that all the series were stationary (p<0.05) and they are integrated of order I(1). The next procedure is to validate if there exist any possible long run relationship among the series which is the next test engage in this study. The researcher test for an optimal lag length in order to avoid the risk of associated with under-specification or overspecification of the model. The results as presented in Table 2 revealed 3 lag length for the model. The test result as presented in Table 1 indicated that the series are stationary after first difference. The researcher used Johansen approach to test whether there is exist a cointegration based on 3 lag length. The Trace test and Max-Eigen results were presented in Table 3 and4. Table 3 and 4 present the Trace and Max-Eigen value result of co-integration test. The result indicates the existence of at least 3 co-integrating vectors (equation). This is evidence by the result of the Johansen statistics of the residuals that rejects the null hypothesis of no, at most one and two co-Integration between agricultural sector output and gross domestic product in Nigeria. Since the null hypothesis which states that there is no co-integrating equation was rejected; it can be deduced that there is a long run relationship between the selected agricultural sub-sectors (fishery, forestry and livestock) and GDP in Nigeria. This qualifies the researcher to run the restricted VECM. Table 5 shows the result of the Vector Error Correction model to establish the dynamic short-run effect of forestry, fishery, fishery and livestock on gross domestic product in Nigeria. The VECM result shows that the second period lag of forestry production has positive and significant effect on gross domestic product with coefficient 912.6890 implying that increases in forestry production in the previous period tend to increase gross domestic product of the current period in Nigeria by 912.6890. However, the third period lag of forestry production has negative and significance effect on gross domestic product in Nigeria with a coefficient-1137.280 implying that increase in forestry production in the previous period tend to decrease the current domestics product by-1137.280. The implication of this findings is that, the more the forestry production increases in previous years, the more the Nigerian economy experiences higher productivities through increase contribution of agricultural sectors to the gross domestic product.
| Hypothesized | — | Trace | 0.05 | — |
|---|---|---|---|---|
| No. of CE(s) | Eigenvalue | Statistic | Critical Value | Prob.** |
| None * | 0.987351 | 283.1392 | 69.81889 | 0.0001 |
| At most 1 * | 0.887289 | 125.8126 | 47.85613 | 0.0000 |
| At most 2 * | 0.648280 | 47.22712 | 29.79707 | 0.0002 |
| At most 3 | 0.224565 | 9.610018 | 15.49471 | 0.3119 |
| At most 4 | 0.012535 | 0.454098 | 3.841466 | 0.5004 |
Table text extracted from the original PDF; superscript letters are shown inline. The original table image is below.
View original table image
| Lag | Log L | LR | FPE | AIC | SC | HQ |
|---|---|---|---|---|---|---|
| 0 | -1318.366 | NA | 8.02e+24 | 71.53332 | 71.75101 | 71.61006 |
| 1 | -1047.236 | 454.3261 | 1.36e+19 | 58.22899 | 59.53514 | 58.68947 |
| 2 | -983.4467 | 89.65021 | 1.80e+18 | 56.13225 | 58.52686 | 56.97646 |
| 3 | -895.3681 | 99.98108* | 7.36e+16* | 52.72260* | 56.20567* | 53.95054* |
Table text extracted from the original PDF; superscript letters are shown inline. The original table image is below.
View original table image
| Variable | Order | ADF | Test Critical Values | — | — | p-value |
|---|---|---|---|---|---|---|
| 1% | 5% | 10% | ||||
| GDP | level | -1.3224 | -3.6105 | -2.9390 | -2.6079 | 0.6090 |
| 1st difference | -3.3166 | -3.6155 | -2.9412 | -2.6091 | 0.0210** | |
| Fishery | level | -0.5500 | -3.6617 | -2.9604 | -2.6192 | 0.8677 |
| 1st difference | -2.5589 | -2.6417 | -1.9521 | -1.6104 | 0.0123** | |
| Livestock | level | -1.2538 | -3.6210 | -2.9434 | -2.6103 | 0.6404 |
| 1st difference | -9.5911 | -3.61556 | -2.9415 | -2.6091 | 0.0000*** | |
| LN Forestry | level | -2.0819 | -3.6329 | -2.9484 | -2.6128 | 0.2527 |
| 1st difference | -7.4234 | -2.6290 | -1.9501 | -1.6113 | 0.0000*** |
Table text extracted from the original PDF; superscript letters are shown inline. The original table image is below.
View original table image
Results and Discussion
In addition, the first and second period lags of fishery productivity has insignificant effect on gross domestic product in Nigeria. But the third period lag of fishery has positive and significant effect on current gross domestic product with a coefficient 276.5752. This implies that increase in the fishery production in the previous section tend to increase the current domestic product by 276.5752. Furthermore, the first period lag of crop production has negative and significant effect on the current gross domestic product with coefficient-1.9736 and p-value = 0.03991 <0.05. This implies that the first period lag of crop production tends to decrease the current gross domestic production by-1.9736. the other period lags were insignificant. Similarly, the first second and third period lags of livestock production has negative and significant effect on gross domestic product in Nigeria with coefficient-5.9566, -3.7913 and -3.8883 with respective p-values 0.0482, 0.0079 and 0.0002. This implies that, as the livestock productivity increases in the previous years, the GDP of the current years tend to decrease. Finally, the Error Correction Mechanism follows the theoretical expectation since it has a negative and significant value of (ECT (-1) = -0.1273, p-value = 0.0022 < 0.05). The significance of the Error Correction Mechanism affirms the existence of long-run relationship between the variables under study. This coefficient indicates that a deviation from the long run equilibrium level of production in one year is corrected by 12.73 percent over the following year. The Adjusted R-squared of Error Correction Model is 0.9464. This implies that the sub-sectors in the agricultural sectors explained 94.6% of the variations in gross domestic product. The overall significant of the model was tested using the Fstatistic. The F-statistic which gives a value of 39.6294 indicates that the model is significant implying that at least one of the independent variables have significant effect on gross domestic product in Nigeria. 6 present the results of pairwise granger causality tests. The result showed that there is a bi-directional relationship between GDP and fishery; GDP and Fishing; forestry and fishing; fishing and crop production. This implies that these variables Granger cause each other. However, there was unidirectional relationship between GDP and Crop production; GDP and livestock; forestry and crop production; forestry and livestock; fishing and livestock; crop and livestock. This implies that causality runs from forestry to GDP without causality running from GDP to forestry.
Conclusion and Recommendation
In this study, the researcher modelled the non-linear relationship between gross domestic product and sub-sectors of agriculture in Nigeria. Based on the findings of the study, it can be concluded that there is a long run relationship between gross domestic product and agricultural sub-sectors. The study also concludes that there is a bi-directional relationship between GDP and fishery; GDP and Fishing. Also, a unidirectional relationship existed between GDP and Crop production; GDP and livestock. On the basis of the above findings, it can be concluded that agricultural sub-sector contributes significantly to gross domestic product for the period under study. Based on this findings, it was recommended that government should provide special incentives to farmers, provides farming input to farmers at subsidized rate, this will go a long way in boosting agricultural activities there by making significant impact on gross domestic product.
Figures and tables from the paper
| Hypothesized | — | Max-Eigen | 0.05 | — |
|---|---|---|---|---|
| No. of CE(s) | Eigenvalue | Statistic | Critical Value | Prob.** |
| None * | 0.987351 | 157.3266 | 33.87687 | 0.0001 |
| At most 1 * | 0.887289 | 78.58553 | 27.58434 | 0.0000 |
| At most 2 * | 0.648280 | 37.61710 | 21.13162 | 0.0001 |
| At most 3 | 0.224565 | 9.155919 | 14.26460 | 0.2734 |
| At most 4 | 0.012535 | 0.454098 | 3.841466 | 0.5004 |
Table text extracted from the original PDF; superscript letters are shown inline. The original table image is below.
View original table image
| Null Hypothesis: | OBS | F-Statistic | Prob. |
|---|---|---|---|
| FORESTRY does not Granger Cause GDP | 37 | 10.5210 | 7.E-05 |
| GDP does not Granger Cause FORESTRY | 13.8984 | 7.E-06 | |
| FISHING does not Granger Cause GDP | 37 | 8.57102 | 0.0003 |
| GDP does not Granger Cause FISHING | 6.54930 | 0.0015 | |
| Crop Production does not Granger Cause GDP | 37 | 4.39807 | 0.0111 |
| GDP does not Granger Cause Crop Production | 0.79457 | 0.5066 | |
| LIVESTOCK does not Granger Cause GDP | 37 | 1.10474 | 0.3626 |
| GDP does not Granger Cause LIVESTOCK | 17.2119 | 1.E-06 | |
| FISHING does not Granger Cause FORESTRY | 37 | 14.4212 | 5.E-06 |
| FORESTRY does not Granger Cause FISHING | 7.84996 | 0.0005 | |
| Crop Production does not Granger Cause FORESTRY | 37 | 9.34084 | 0.0002 |
| FORESTRY does not Granger Cause Crop Production | 0.60354 | 0.6178 | |
| LIVESTOCK does not Granger Cause FORESTRY | 37 | 0.33882 | 0.7974 |
| FORESTRY does not Granger Cause LIVESTOCK | 6.49031 | 0.0016 | |
| Crop Production does not Granger Cause FISHING | 37 | 8.86619 | 0.0002 |
| FISHING does not Granger Cause Crop Production | 6.84259 | 0.0012 | |
| LIVESTOCK does not Granger Cause FISHING | 37 | 0.06884 | 0.9761 |
| FISHING does not Granger Cause LIVESTOCK | 6.15772 | 0.0022 | |
| LIVESTOCK does not Granger Cause Crop Production | 37 | 2.62340 | 0.0687 |
| Crop Production does not Granger Cause LIVESTOCK | 4.84675 | 0.0072 |
Table text extracted from the original PDF; superscript letters are shown inline. The original table image is below.
View original table image
References
14 in the original paper- Abdul B, Didik S, Suhel K, Azwardi M. The relationship between economic growth, Human capital, and agricultural sector: Empirical evidence from Indonesia. International Journal of Food and Agricultural Economics. 2018;6(4):35-52.
- Adenomon MO, Oyejola BA. Impact of agriculture and industrialization on gross domestic product in Nigeria: Evidence from VAR and SVAR Models. MPARA paper. 2013;1(1):40-78.
- Dim C, Ezenekwe U. Does agriculture matter for economic development? Empirical evidence from Nigeria. Journal of finance and economics. 2013;1(1):6177.
- Faridi MZ. Contribution of agricultural exports to economic growth in Pakistan. Pakistan Journal of Commerce and Social Science. 2012;6(1):133-146.
- Gardner BL. Causes of rural economic development. Agricultural Economics. 2005;32(S1):21-41.
- Jatuporn C, Chien LH, Sukprasert P, Thaipakdee S. Does a long-run relationship exist between agriculture and economic growth in Thailand. International Journal of Economics and Finance. 2011;3(3):227-233.
- Jatuporn C, Chien LH, Sukprasert P, Thaipakdee S. Does a long-run relationship exist between agriculture and economic growth in Thailand? International Journal of Economics and Finance. 2011;3(3):227-233.
- Kamil S, Sevin U, Festus VB. The contribution of agricultural sector on economic growth of Nigeria. International Journal of Economics and Financial Issues. 2017;7(1):547-552.
- Katircioglu ST. Causality between agriculture and economic growth in a small nation under political isolation: A case from North Cyprus. International Journal of Social Economics. 2006;33(4):331-343.
- Lavorel S, Storkey J, Bardgett RD, Bello F, Berg MP, Roux X. A novel framework for linking functional diversity of plants with other trophic levels for the quantification of ecosystem services. Journal of Vegetation Science. 2013;24(5):942-948.
- Matahir H. The empirical investigation of the nexus between agricultural and industrial sectors in Malaysia. International Journal of Business and Social Science. 2012;3(8):225-230.
- Okoro I. Analysis of the contribution of agricultural sector on the Nigerian economic development. World Review of Business Research. 2011;1(1):191-200.
- Pffaf B. Vector autoregressive, structural vector autoregressive and structural vector error correction model: Implementation within R package vars. Journal of Statistical Software. 2008;27(4):1-32.
- Tiffin R, Irz X. Is agriculture the engine of growth? Agricultural Economics. 2013;35(1):79-89.