
Research article · 2022 · Full text
International Journal of Statistics and Applied MathematicsOutlier detection in a few catchments of the Godavari river basin: A case study
Volume 7(2) · Pages 170–173 · DOI: 10.22271/maths.2022.v7.i2b.813 ↗
Research areasHydrology and Drought AnalysisAdvanced Statistical Methods and ModelsAgricultural Economics and Practices
Abstract
Author-writtenThe efficiency of the Grubbs-Beck test and the multiple Grubbs-Beck tests to detect discordant observations are compared in this research using a few catchment areas of the Godavari river basin in Maharashtra, India. The Multiple Grubbs-Beck tests are proven to be more effective than the original Grubbs-Beck tests when applied to the Weibull distribution. When using the Grubbs test, only one lower discordant observation was identified in all of the river stations, and no lower discordant observation was found in the Somanpally river station when using the Multiple Grubbs Beck test (MGBT) five survey catchments.
Summary
Source-checkedPlain-language reading of the full paper, prepared with AI and checked against the text. Each point links to the authors' own words.
Why it matters
- Flood frequency analysis is essential for designing water infrastructure like bridges and embankments, as well as for flood management and insurance research. View evidence ↗
- Identifying 'lower discordants', extremely small observations that deviate from the general data pattern, is critical because they can significantly impact flood frequency analysis. View evidence ↗
- Discordant observations can be caused by measurement errors, missing data, or samples originating from a different population, which disturbs the overall data series. View evidence ↗
The question
- The study aims to use the Grubbs test and the Multiple Grubbs-Beck tests (MGBT) combined with the Weibull distribution to detect discordant observations across five river stations. View evidence ↗
What they did
- The research compares the efficiency of the Grubbs-Beck test and Multiple Grubbs-Beck tests using catchment areas in the Godavari river basin of Maharashtra, India. View evidence ↗
- The study analyzed data from five specific river stations: Bhadrachalam, Tumnar, Sirpur, Sabari, and Somanpally. View evidence ↗
- A three-parameter Weibull probability distribution was employed for both single and multiple discordant detection approaches. View evidence ↗
- The original Grubbs-Beck test utilized field logarithms of peak flow data to calculate critical values at a 10% significance level. View evidence ↗
What they found
- The Grubbs test identified exactly 1 discordant observation at each of the five stations, whereas the MGB test identified between 0 and 15 discordants (0 at Bhadrachalam, 8 at Tumnar, 12 at Sirpur, 15 at Sabari, and 12 at Somanpally). View evidence ↗
- At the Upper river station, the Multiple Grubbs-Beck test detected 20 discordants, while the original Grubbs-Beck test detected none. View evidence ↗
- The percentage difference in flood quantiles between the Grubbs test and the Multiple Grubbs-Beck test varied from -8% to 11% across the five stations. View evidence ↗
- At the Tumnar station, the Weibull distribution overestimated the flood quantile by 110% in some cases and underestimated it by -8%, 10%, 3%, and -1% in others. View evidence ↗
- When applied to the Weibull distribution, the Multiple Grubbs-Beck tests were found to be more effective than the original Grubbs-Beck tests. View evidence ↗
What it means
- The authors concluded that neither the Grubbs test nor the Multiple Grubbs-Beck test identifies discordant observations when the variation in flood discharge is low. View evidence ↗
Visual summary
1 visualsIllustrations explain the paper; charts are replotted from the paper's own table values.
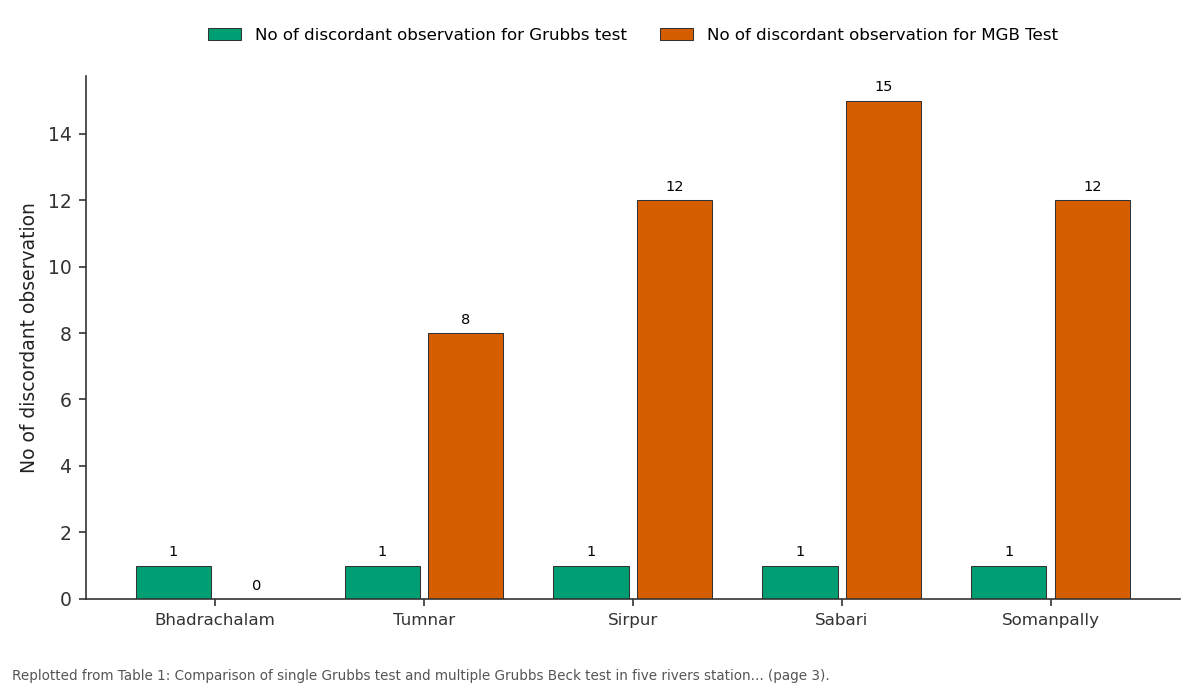
No of discordant observation for Grubbs test and No of discordant observation for MGB Test: Bhadrachalam vs Tumnar vs Sirpur vs Sabari vs Somanpally
Replotted from Table 1 (page 3) of the original paper. Every bar is the paper's own table value.
View source evidence ↗Figures & tables
From the original paper Table 1
 Table 2
Introduction
Flood frequency analysis is a method for estimating the design flood necessary for bridges, culverts, flood embankments, and other water infrastructure, as well as for flood management and flood insurance research. Flood estimating attempts to extract as much information as can from the supplied data, while also remaining robust to the distribution model and achieving a low discordant. Furthermore, very low values can result in inaccurate estimates of huge inundation quantiles. In comparison to current levels of stream gauges with longer annual peak flow records, Griffs and Stedinger (2008) [18] discovered that flood size and frequency predictions utilizing river monitoring stations with short yearly peak flow data records have a greater standard error or uncertainty. Probability distributions are frequently chosen in flood frequency analysis based on statistical tests or graphical methods, which play a useful role in the selection of correct distributions. Cohn et al, (2013) [17] , 𝑝(𝑘; 𝑛) function accurately explains whether the 𝑘 𝑡ℎ smallest observation in a normal sample of n variates is rare. Because inward sweep tests are more sensitive to masking, an outward sweep is preferable to avoid the problem. A flood record may contain more than one low discordant, causing the original GB test statistic to fail to distinguish the smallest observation as a discordant, causing the original GB test statistic to fail to distinguish the smallest observation as a discordant. ROSNER employs a two-sided outward sweep. The MBG test is also based on a one-sided critical value of 10% significance of a normally distributed sample, but it's designed to look at ordered sets of data, which aren't included in the other tests. The detection of lower discordant in flood data is an important stage in flood frequency analysis. Lower discordant is a very tiny observation of flood data that deviates dramatically from the patterns of the rest of the data. Lower discordant identification and treatment is a critical topic in flood frequency analysis, as such observations might have a major impact. Discordant observation is an extra variable that disturbs the whole observation in flood data series. This arises due to different causes, when the observation is different from the selected samples, measurement error or missing of observation, mostly observation is from the different population of most of the data. The Weibull probability distribution with three parameters was used in this investigation for single or multiple discordant detection approaches. The continuous distribution is one of the three parameters of the Weibull distribution, which is mostly employed in extreme field events such as flood data, survival analysis, and so on. The sample features of quantile estimates based on the maximum likelihood (ML), Method of Moments (MOM), and probability-weighted moments (PWM) approaches were used to compute the Weibull distribution used in the regional flood frequency study (2001) [21] . The researchers conducted an empirical performance evaluation of discordant identification techniques for Weibull or extremevalue distributions (2007). The Grubb statistic G' scored well in tests for lower discordant. For the labelled slippage, Mann's W was much poorer than the others [22] . The purpose of this research is to use the Grubb's test and the multiple Grubb's-beck tests with the Weibull distribution to detect discordant observations in the five rivers stations.
Methodology
Methodology
Weibull distribution
The three parameters Weibull distribution is mainly used for this analysis. The Weibull distribution was first distinguished by (Frechet Maurice 1927) [20] . This distribution is a continuous probability distribution named given by Swedish mathematician Waloddi Weibull. It can work efficiently, even with small sample sizes, and can be used precisely in frequency analysis and obtaining parameter estimates. Let 𝑋 1 , … , 𝑋 𝑛 be independent random variables from a Weibull distribution with location, scale and shape parameters as 𝜇, 𝜎, 𝑎𝑛𝑑 𝛾 respectively.
For case I: When the observations are smaller than the location parameter 𝜇, 𝑒. ∀, 𝑥 𝑖 < 𝜇; 𝑖 = 1, … , 𝑛, then pdf is given by Probability density function (pdf)
Where, μ is the location parameter, σ is the scale parameter that decides the appearance or shape of the distribution and γ is the shape parameter.
Proposed test statistic
The original Grubbs-Beck tests uses the field logarithms of the peak flow data, to calculate a critical value at a significance level of 10% on one side of a normally distributed sample. Multiple peak flows recorded by the flow meter can be smaller than the critical Grubbs
Conclusion
This paper estimates the discordant observation for the five river stations of the Godavari basin. To find out a single discordant and multiple discordant, two methods Grubbs test and Multiple Grubbs beck test was used for comparison and its quantile value ware also observed with the help of simulation technique. For all the river stations single lower outlying observation is found with the help of the Grubbs test while using the method of Multiple Grubbs Beck test (MGBT). It also concluded that the when the variation between the flood discharge is low then the Grubbs test and Multiple Grubbs Beck test not found any discordant observation.
Figures and tables from the paper
| S. No | River Station | No of discordant observation for Grubbs test | No of discordant observation for MGB Test |
|---|---|---|---|
| 1 | Bhadrachalam | 1 | 0 |
| 2 | Tumnar | 1 | 8 |
| 3 | Sirpur | 1 | 12 |
| 4 | Sabari | 1 | 15 |
| 5 | Somanpally | 1 | 12 |
Table text extracted from the original PDF; superscript letters are shown inline. The original table image is below.
View original table image
References
18 in the original paper- Bobee B, Cavidas G, Cavidas Ashkar F, Ashkar J, Bernier JJ, Rasmussen P. Towards a systematic approach to comparing distributions used in flood frequency analysis. Journal of Hydrology. 1993;142(1-4):121-136.
- Rosner B. On the detection of many outliers, Technometrics, B. 1975;17(2):221-227.
- Saf B. Assessment of the effects of discordant sites on regional flood frequency analysis, Journal of Hydrology. 2010;380(3-4):362-375.
- Spencer C, McCuen R. Detection of PILFs in Pearson type III data. Journals of Hydrology Engineering. 1996;1(1):2-10.
- Cunnane C. Factors affecting choice of distribution for flood series, Hydrol Sci. J. 1985;30(1):25-36.
- Grubbs FE. Procedures for Detecting Outlying Observations in Samples, Technometrics. 1969;11(1):121.
- Tietjen G, Moorie R. Some Grubbs-type statistics for the detection of several outliers, Technometrics. 1972;14(3):583-597.
- Beard LR. Statistical methods in hydrology, Civil works investigation project CW-151, U.S. Army Corps of Engineers, Sacramento, California. 1962;2:62.
- Benson MA. Uniform flood-frequency estimating methods for federal agencies, Water Resource Research. 1968;4(5):891-908.
- Vogel RM, McMahon TA, Chiew FHS. Flood flow frequency model selection in Australia, J Hydrol. 1993;146(421):449.
- Merz R, Bloschil G, Humer G. National flood discharge mapping in Austria, Nat Hazards. 2008;46(1):53-72.
- Nathan RJ, Weinmann PE. Application of at-site and regional flood frequency analyses, in Proc. International Hydrology Water Resources Symposium, Perth. 1991;3(22):769-774.
- Cohn TA, England JF, Berenbroc CE, Mason RR, Stedinger JR, Lamontagne. A generalized Grubbs-Beck test statistic for detecting multiple potentially influential outliers in flood series, Water Resources Research. 2013;49(8):5047-5058.
- Griffs VW, Stedinger JR. The LP3 distribution and its application in flood frequency analysis, 2. Parameter estimation methods. Journal of Hydrology Engineering. 2007;12(5):492-500.
- Thomas WO. A uniform technique for flood frequency analysis. Journals Water Resources Planning Management. 1985;111(3):321-337.
- Fréchet, Maurice. Sur la loi de probabilité de l'écart maximum, Annales de la Société Polonaise de Mathematique, Cracovie. 1927;6:93-116.
- Jun-Haeng Heo, Salas JD, Boes DC. Regional flood frequency analysis based on a Weibull model: Part 2. Simulations and applications. Journal of Hydrology. 2001;242(3-4):171-182.
- Vishakha Tiwari, Pratyasha Tripathi, Vishal Vincent Henry. Grubbs-back test and multiple Grubbs beck test compared for the Godavari basin: A case study. International Journal of Applied Research 2019;5(11):288-291.
Cited by 2
From OpenAlex, OpenCitations and reference lists read by Scinovex
- Spatial analysis of historical extreme rainfall characteristics using regionalization in the Lake Biwa and Yodo River Basin, Japan ↗
Taishi Yazawa, Ayane Shoji · Journal of Water and Climate Change · 2023
Abstract This research investigated the historical changes in basin-scale rainfall characteristics and their spatial distributions in the Lake Biwa and Yodo River Basin. Nine rainfall indices including two general and seven extreme rainfall indices and the probable rainfall according to 50- and 100-year return periods were evaluated based on the data gathered from 61 rain gauge stations. The regionalization of…
❝ 3PDF - Algal Bloom Prediction Based on Graph Convolutional Network and Gated Recurrent Unit Deep Neural Network and Massive Spatial–temporal Water Quality Data ↗
Yixuan Hou, Zixian Zhang, Yichen Wei, Ruoxuan Cao, Yihang Xu, Yong Yue et al. · Environmental science and engineering · 2025
❝ 0