
Research article · 2022 · Full text
International Journal of Statistics and Applied MathematicsComparative study on double inspection single sampling plan with existing single sampling plan
Volume 7(3) · Pages 152–154 · DOI: 10.22271/maths.2022.v7.i3b.835 ↗
Research areasAdvanced Statistical Process MonitoringIndustrial Vision Systems and Defect Detection
Abstract
Author-writtenSampling inspection plans are playing a vital role in the production Industries. The professionals insist on the product very strict quality control measures should be adopted in order to avoid rejection and satisfying the need of the customer. In this article describes comparative study of Double Inspection Sampling Plan with Single Sampling Plan through operating characteristics curve and sample size. Also this article discussed the brief review of operating procedures, flow charts and operating characteristics functions of above plans.
Summary
Source-checkedPlain-language reading of the full paper, prepared with AI and checked against the text. Each point links to the authors' own words.
Why it matters
- Sampling inspection plans are critical in production industries to ensure strict quality control, which helps avoid product rejection and meet customer needs. View evidence ↗
- The Single Sampling Plan (SSP) is the fundamental basis for sampling innovations, where the decision to accept or reject a lot depends on a single sample. View evidence ↗
- Double Inspection sampling plans are used in bivariate situations where two separate tests are performed on each unit. View evidence ↗
The question
- The study aims to compare the Double Inspection Single Sampling Plan (DISSP) with the existing Single Sampling Plan (SSP) using sample size and operating characteristics (OC) curves. View evidence ↗
What they did
- The Single Sampling Plan is characterized by three parameters: lot size (N), sample size (n), and acceptance number (c). View evidence ↗
- The Double Inspection Single Sampling Plan uses four parameters: lot size (N), sample size (n), and two separate acceptance numbers (c1 and c2) for the first and second inspections. View evidence ↗
- The DISSP operating procedure involves drawing one sample of size 'n'; the lot is rejected if the first inspection defectives (d1) exceed c1, or if the second inspection defectives (d2) exceed c2. View evidence ↗
- For comparison, the authors compared a DISSP with parameters c1=2 and c2=3 against two SSPs with c=2 and c=3 respectively. View evidence ↗
What they found
- The proposed Double Inspection Single Sampling Plan requires a smaller sample size compared to the two Single Sampling Plans evaluated. View evidence ↗
- At a proportion (p) of 0.001, the DISSP sample size is 765, compared to 818 for SSP-1 and 1366 for SSP-2. View evidence ↗
- The Operating Characteristic (OC) curve for the DISSP is steeper than those of the two Single Sampling Plans. View evidence ↗
What it means
- The authors conclude that the DISSP provides the minimum sample size while maintaining maximum acceptance compared to SSP-1 and SSP-2. View evidence ↗
- The authors recommend the DISSP for mass-produced or expensive items (e.g., smartphones, gold ornaments, foods) to reduce consumer risk in industries with high human intervention. View evidence ↗
Visual summary
3 visualsIllustrations explain the paper; charts are replotted from the paper's own table values.
DISSP Decision Flow
AI-generated conceptual illustration (industrial manufactured metal bolts in a quality control setting). It explains the idea and does not show study data.
View source evidence ↗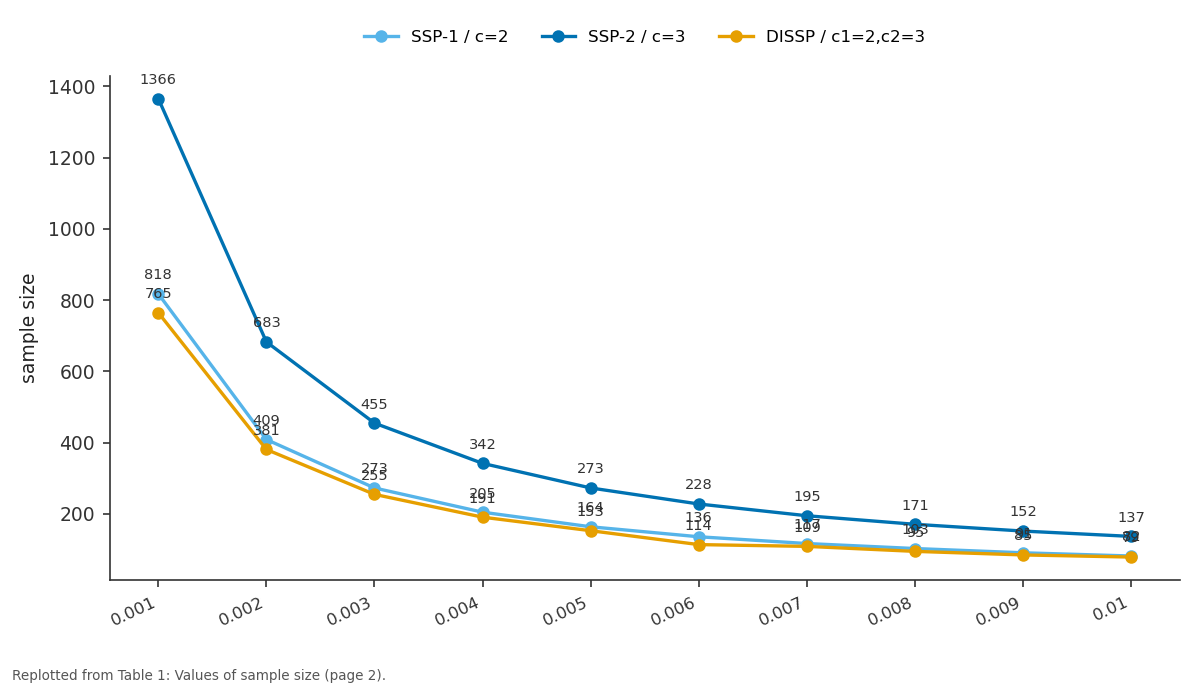
SSP-1 / c=2 and SSP-2 / c=3 and more: 0.001 vs 0.002 vs 0.003 vs 0.004 vs 0.005
Replotted from Table 1 (page 2) of the original paper. Every bar is the paper's own table value.
View source evidence ↗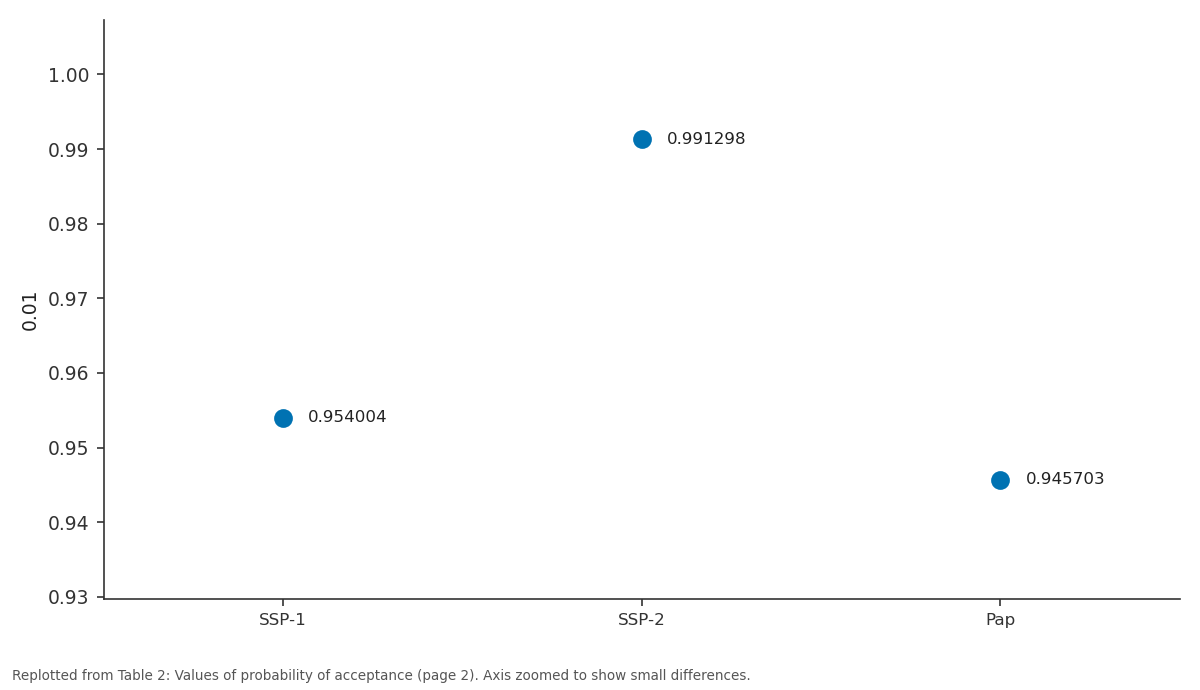
0.01: SSP-1 vs SSP-2 vs Pap
Replotted from Table 2 (page 2) of the original paper. Every bar is the paper's own table value.
View source evidence ↗Figures & tables
From the original paper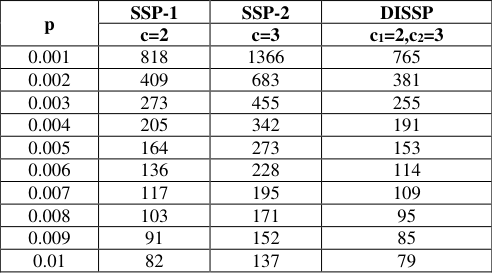 Table 1
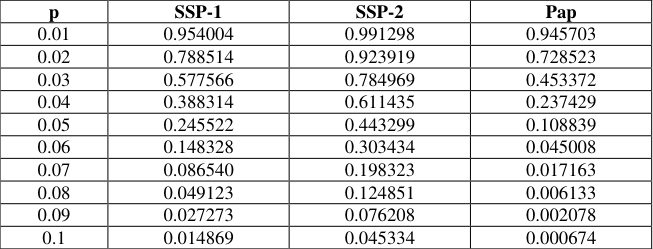 Table 2
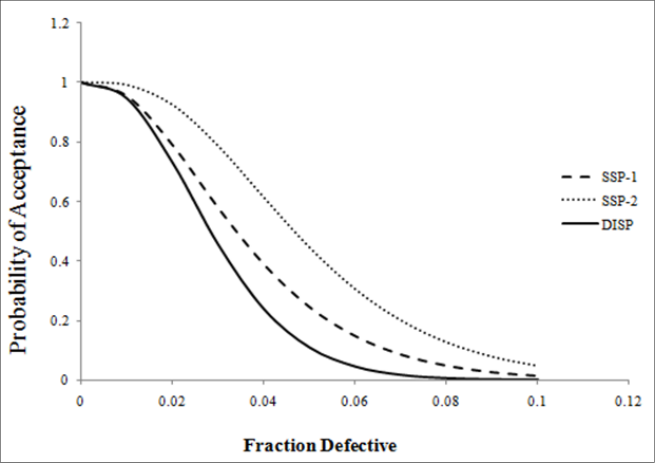 Figure 1
Introduction
During the production process, due to various reasons defectives may occur. The professionals are inspecting all the observations in each sample with very strict quality control measures, to avoid rejection and satisfy the need of the customer. Single sampling plan is base of all sampling innovations. In single sampling plan the decision of accepting or rejecting the lot is made based on single sample only. It has three parameters N, n and c where N is the lot size, n is the sample size and c is the acceptance number. According to has also given a table which is an extension of the table given by Cameron's table is based on Poisson distribution and can be used to design single sampling plans for all the popular values of producer's risk and consumer's risk. If single sampling plan not favour for the production situation, the inspection move to other sampling plans. In this study Double Inspection sampling plan was established only when needed. Focus on the bivariate situation where exactly two tests are performed on each unit. The Single Sampling Plan (SSP) is the basic, foremost and popularly used form of sampling plan for the industrial purposes. The SSP is used for count data in which only one sample is selected characterized by three parameters namely, the lot size (N), sample size (n) and acceptance number (c) but Double Inspection data in which only one sample is selected characterized by four parameters namely, the lot size (N), sample size (n), acceptance number (c 1 ) for first inspection and acceptance number (c 2 ) for second inspection. Senthilkumar and Sabarish (2020) [5] have developed the Construction and Selection of Double Inspection Single Sampling Plan [DISSP (0, 1)]. Senthilkumar and Sabarish (2021) [6] have developed Selection and Development of Double Inspection Single Sampling Plan. Senthilkumar and Sabarish (2021) [9] have developed Economic Design of Double Inspection Single Sampling Plan.
Operating procedure
Step 1: Draw a random sample of size 'n' units from the lot and test each unit for conformance to the specified attribute requirements. Here we observed that the proposed sampling plan gives the minimum sample size compare with other two single sampling plans. Plan determined by this method for smaller sample size provide the required information to accept or reject the lot for given c 1 =2 and c 2 = 3. It is advantageous to apply the bivariate attribute plan in industries for reducing the inspection cost and time.
Description of tables
Table 1 gives the comparison of Double Inspection Single Sampling Plan with existing Single Sampling Plan through sample size.
| p | SSP-1 | SSP-2 | DISSP |
|---|---|---|---|
| c=2 | c=3 | c1=2,c2=3 | |
| 0.001 | 818 | 1366 | 765 |
| 0.002 | 409 | 683 | 381 |
| 0.003 | 273 | 455 | 255 |
| 0.004 | 205 | 342 | 191 |
| 0.005 | 164 | 273 | 153 |
| 0.006 | 136 | 228 | 114 |
| 0.007 | 117 | 195 | 109 |
| 0.008 | 103 | 171 | 95 |
| 0.009 | 91 | 152 | 85 |
| 0.01 | 82 | 137 | 79 |
Table text extracted from the original PDF; superscript letters are shown inline. The original table image is below.
View original table image
Table 2 gives the probability of acceptance of first inspection for the sample of size n=79 and acceptance number c 1 =2, the probability of acceptance of second inspection for the sample of size n=79, and the acceptance number c 2 =3 and the probability of acceptance of Double Inspection Single Sampling Plan size n=79; c 1 =2 and c 2 =3 Double Inspection Single Sampling Plan.
| p | SSP-1 | SSP-2 | Pap |
|---|---|---|---|
| 0.01 | 0.954004 | 0.991298 | 0.945703 |
| 0.02 | 0.788514 | 0.923919 | 0.728523 |
| 0.03 | 0.577566 | 0.784969 | 0.453372 |
| 0.04 | 0.388314 | 0.611435 | 0.237429 |
| 0.05 | 0.245522 | 0.443299 | 0.108839 |
| 0.06 | 0.148328 | 0.303434 | 0.045008 |
| 0.07 | 0.086540 | 0.198323 | 0.017163 |
| 0.08 | 0.049123 | 0.124851 | 0.006133 |
| 0.09 | 0.027273 | 0.076208 | 0.002078 |
| 0.1 | 0.014869 | 0.045334 | 0.000674 |
Table text extracted from the original PDF; superscript letters are shown inline. The original table image is below.
View original table image
Illustration
In Double Inspection Single Sampling plan two inspectors checking two different quality Characteristics of cool drink tins, c 1 = Checking the sealed of the tin and c 2 = Checking the label of the tin, both the quality characteristics are independent Table 1 gives the probability of acceptance of first inspection for the sample of size n=79 and acceptance number c 1 =2, the probability of acceptance of second inspection for the sample of size n=79, and the acceptance number c 2 =3 and the probability of acceptance of double inspection single sampling plan size n=79; c 1 =2 and c 2 =3.
Umerical illustration
Umerical illustration
Conclusion
In this study concluded compare to other sampling plans (SSP-1 and SSP-2) the sample size is very small in Double Inspection Single Sampling Plan. In other words Double Inspection Single Sampling Plan provides minimum of sample size with maximum of acceptance. In this plan we inspect two different and important quality characteristics of the same product, so that the product gets more quality. This finest plan was applicable for Mass and costliest product production industries like foods, smart phones and gold ornament so on where the human intervention is much involved and also it decreases the consumer risk.
Figures and tables from the paper
References
7 in the original paper- Abraham Golub. Designing Single Sampling inspection plans when the sample size is fixed. Journal of the American Statistical Association. 1953 Jun 1;48(262):278-88.
- Aydemir E, Olgun MO. An Application of Single and Double Acceptance Sampling Plans for a Manufacturing System. Journal of Engineering Science and Design. 2010 Sep 1;1(2):65-71.
- Kazutomo Kawamura. The Structure of Bivariate Poisson distribution, KODAI Mathematical Seminar Reports. 1973;25(2):246-256.
- Senthilkumar Sabarish. Construction and Selection of Double Inspection Single Sampling Plan by Attributes [DISSP (0,1)]. International Journal of Disaster Recovery and Business Continuity. 2020;11:3295-3304.
- Senthilkumar Sabarish. Selection and Development of Double Inspection Single Sampling Plan. Bulletin Monumental. 2021;22:7-12.
- Senthilkumar Sabarish. Economic Design of Double Inspection Single Sampling Plan. GIS Science Journal. 2021;8:568-583.
- Senthilkumar Sabarish. Design of Double Inspection Quick Switching System [DIQSS (0,1)]. International Journal of Mechanical Engineering. 2022;7:421-424.