
Research article · 2022 · Full text
International Journal of Statistics and Applied MathematicsPower size biased exponential distribution with applications in bio-science
Volume 7(1) · Pages 01–07 · DOI: 10.22271/maths.2022.v7.i1a.767 ↗
Research areasStatistical Distribution Estimation and ApplicationsBayesian Methods and Mixture ModelsStatistical Methods and Bayesian Inference
Abstract
Author-writtenIn this article, a modified version of size biased exponential distribution has been introduced and named as Power Size Biased Exponential Distribution (PSBED). Various statistical properties of the said distribution have been derived. The pdf, CDF and HRF of the distribution has been represented through the graphs. The method of maximum likelihood estimation MLE has been used to estimate the parameters of the distribution. Finally the performance of the distribution is checked through the data set where it shows the better results than the parallel distributions.
Summary
Source-checkedPlain-language reading of the full paper, prepared with AI and checked against the text. Each point links to the authors' own words.
Why it matters
- Researchers are seeking more flexible and meaningful probability distributions to better model lifetime data with monotone failure rates. View evidence ↗
- Existing simple distributions often fail to provide a sound parametric fit for practical applications or model complex bathtub and multimodal shaped failure rates. View evidence ↗
- Size-biased and weighted distributions are used in practice when sample observations are recorded with unequal probabilities. View evidence ↗
The question
- The authors aim to introduce a modified version of the size-biased exponential distribution, termed the Power Size Biased Exponential Distribution (PSBED). View evidence ↗
What they did
- The PSBED is defined by a probability density function (pdf) involving parameters alpha and theta. View evidence ↗
- The authors used the Maximum Likelihood Estimation (MLE) method to estimate the distribution's parameters. View evidence ↗
- The performance of the PSBED was tested using two bioscience-related datasets. View evidence ↗
- Goodness of fit was evaluated using -log l, Akaike Information Criterion (AIC), Consistent AIC (CAIC), and Bayesian Information Criterion (BIC). View evidence ↗
What they found
- The first dataset analyzed consisted of remission times in months for 128 bladder cancer patients. View evidence ↗
- The second dataset analyzed consisted of survival times in weeks for 33 patients with acute myelogenous leukemia. View evidence ↗
- For the first dataset, the PSBE model showed a better fit than the WAD model, with a lower AIC of 799.59 compared to 830.99. View evidence ↗
- For the second dataset, the PSBE model outperformed the LBAD model, achieving a lower AIC of 311.01 versus 345.54. View evidence ↗
- Across both datasets, the PSBED consistently showed lower AIC, CAIC, and BIC values than the parallel distributions. View evidence ↗
What it means
- The authors conclude that the Power Size Biased Exponential Distribution provides a better fit for the analyzed bio-science data. View evidence ↗
- The authors state that the PSBED demonstrates superior results compared to parallel distributions when tested on real-world datasets. View evidence ↗
Visual summary
3 visualsIllustrations explain the paper; charts are replotted from the paper's own table values.
PSBED Conceptual Framework
AI-generated conceptual illustration (Mathematical probability density curves on a coordinate plane). It explains the idea and does not show study data.
View source evidence ↗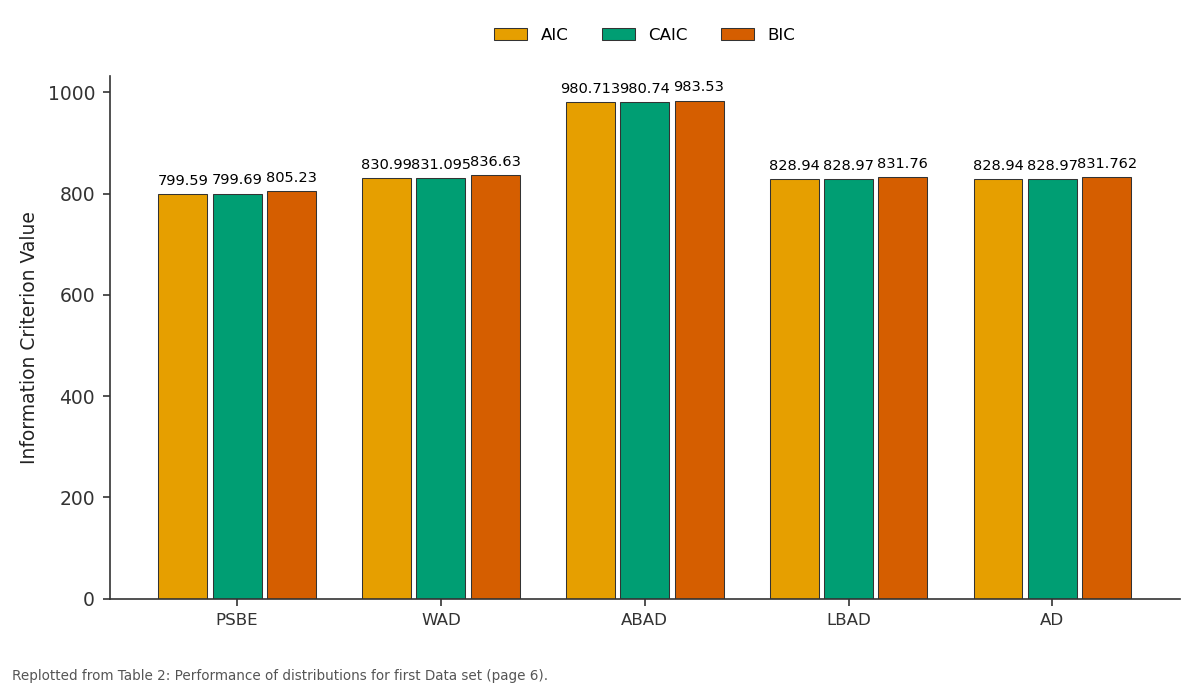
AIC and CAIC and more: PSBE vs WAD vs ABAD vs LBAD vs AD
Replotted from Table 2 (page 6) of the original paper. Every bar is the paper's own table value.
View source evidence ↗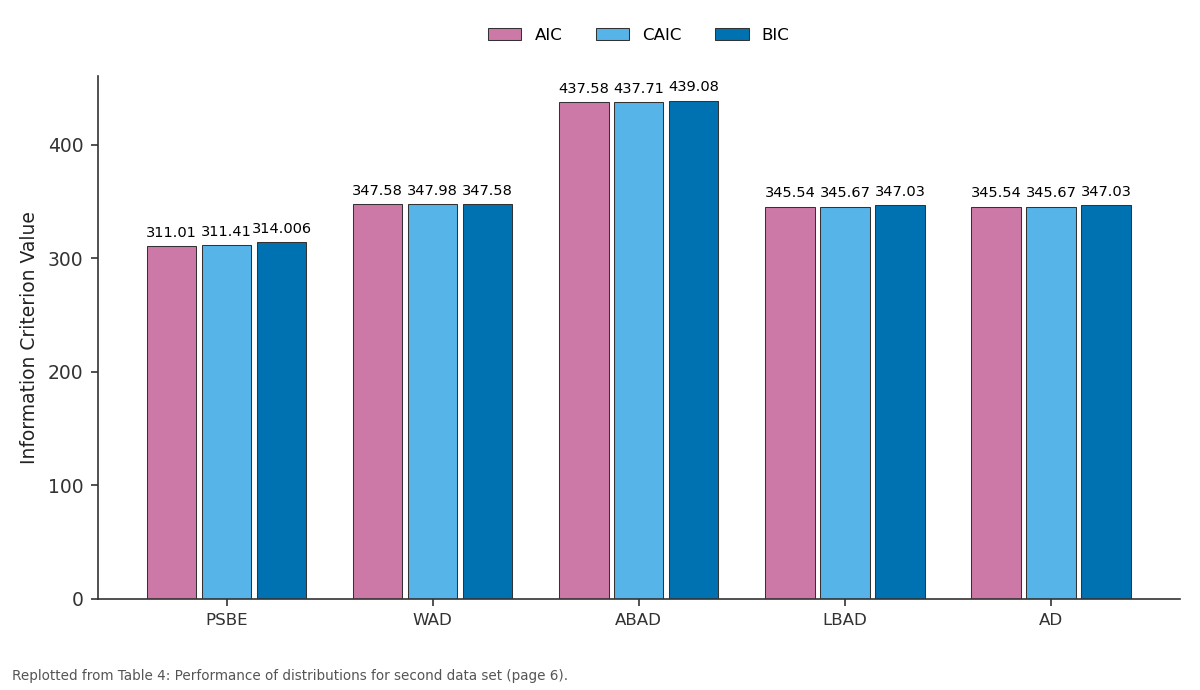
AIC and CAIC and more: PSBE vs WAD vs ABAD vs LBAD vs AD
Replotted from Table 4 (page 6) of the original paper. Every bar is the paper's own table value.
View source evidence ↗Figures & tables
From the original paper Table 1
 Table 2
 Table 3
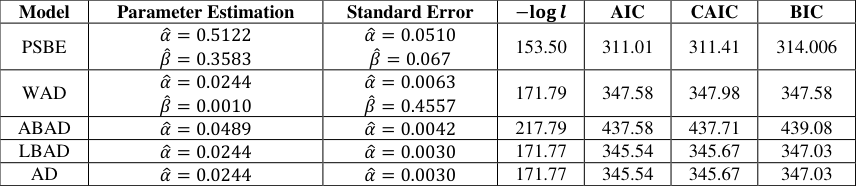 Table 4
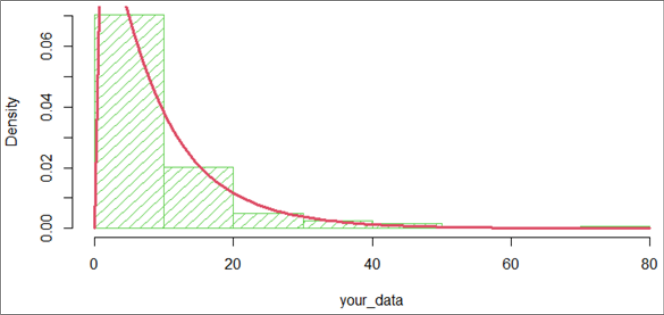 Figure 1
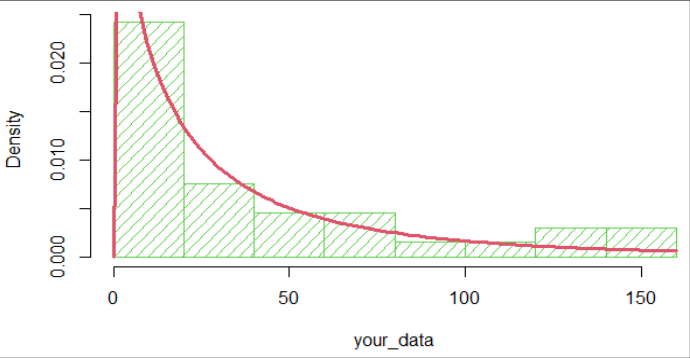 Figure 1
Introduction
In recent developments, researchers focused on generating more flexible, tractable and meaningful distributions and modeled various types of lifetime data with monotone failure rates. In spite of their simplicity in solving many problems of lifetime data and reliability studies, such existing distributions are not useful to model bathtub and multimodal shaped failure rates and also fail to provide sound parametric fit to some practical application. In recent past, new families of probability distributions have been defined that are extension of well-known families of distributions. These newly developed families/classes of distributions provide greater flexibility in modeling complex data. Weighted in general and size biased in particular distributions arise in practice when observations from a sample are recorded with unequal probability and provide unifying approach for the problems when the observations fall in the non-experimental, non replicated and non-random categories, first introduced by to model ascertainment bias these are later formulized in uniform theory by. Discussed that weighted distributions have various statistical applications, especially in analysis of data relating to ecology and human populations. For the first, time applied weighted distribution to connect with sampling wood cells. Gove (2003) [9] studied some of the latest results on sizebiased distributions especially conceder the Weibull family relating to application and parameter estimation with method of moments and maximum likelihood in forestry. A weighted version of exponential distribution is discussed by Mir et al. (2013) [5] . They derive some mathematical properties and estimate the parameter with method of moments, maximum likelihood and Bayesian method. The probability density function of size biased exponential distribution is given by;
And the corresponding cdf is given as;
The Power Size Biased Exponential Distribution
If 𝑌 be a random variable that follows Size Biased Exponential distribution, then the random variable 𝑋 = 𝑌
b) Moments
Suppose x be a random variable follows PSBED. Then the r moment denoted by 𝜇 𝑟 ′ is given as;
Substituting 𝜃𝑥 𝛼 = 𝑧,then solving the integral we get;
By substituting𝑟 = 1, 2, 3 and 4 we obtain the first four moments of the distribution about origin
Variance of the distribution is given by;
Substituting the values of 𝜇 2 ′ and 𝜇 1 ′ from the above equations, we get;
c) Moment generating function
Let 𝑥 be a random variable follows power biased exponential distribution then the moment generating function denoted by 𝑀 𝑥 (𝑡) is obtained as;
Using Taylor's theorem, we get
d) Characteristics function of power size biased exponential distribution
Let 𝑥 be a random variable follows power size biased exponential distribution then the moment generating function denoted by 𝜙 𝑥 (𝑡) is obtained as.
Using Taylor's theorem, we get
e) Harmonic mean of power size biased exponential distribution The harmonic mean (H) is given as.
Substituting 𝜃𝑥 𝛼 = 𝑚,then solving the integral we get;
Order Statistics of Power size biased exponential Distribution
Let us suppose 𝑥 1 , 𝑥 2 , 𝑥 3 … , 𝑥 𝑛 be random samples of size n from power size biased exponential distribution with p.d.f 𝑓(𝑥) and c.d.f F(𝑥). Then the probability density function of 𝑘 𝑡ℎ order statistics is given as.
Now using the values of 𝑓(𝑥) and F(𝑥) in the above equation.Then the probability of 𝑘 𝑡ℎ order statistics of Power size biased exponential distribution is given as;
Then, the p.d.f of first order 𝑥 1 Power size biased exponential distribution is given as;
Then, the p.d.f of first order 𝑥 𝑛 Power size biased exponential distribution is given as
Method of Maximum Likelihood Estimation
The estimation of parameters of Power size biased exponential distribution is doing by using the method of maximum likelihood estimation. Suppose
Data Analysis
The usefulness of the formulated distribution has been explained through two bioscience related data sets. The data sets are as follows Data set 1: The data set represents the remission times (in months) of a random sample of 128 bladder cancer patients. In order to compare the efficiency of the formulated distribution, we consider various criterions for goodness of fit such as-log 𝑙, AIC, CAIC and BIC. The established model is compared with Weighted Ailamujia distribution (WAD), Area Biased Ailamujia Distribution (ABAD), Length Biased Ailamujia Distribution (LBAD), Ailamujia Distribution (AD). The distribution having lower value of AIC, CAIC and BIC is considered to be best fit. The descriptive statistics of data set 1 and data set 2 are presented in table 1 and 3. The estimates of the parameters, log-likelihood, Akaike information criteria (AIC) for the data sets are generated and presented in Table 2 and4. Hence power size biased exponential distribution leads better fit.
| Model | Parameter Estimation | Standard Error | −𝐥𝐨𝐠𝒍 | AIC | CAIC | BIC |
|---|---|---|---|---|---|---|
| PSBE | 𝛼̂ = 0.72031 𝛽̂ = 0.43880 | 𝛼̂ = 0.0287 𝛽̂ = 0.0470 | 397.79 | 799.59 | 799.69 | 805.23 |
| WAD | 𝛼̂ = 0.1074 𝛽̂ = 0.0010 | 𝛼̂ = 0.0143 𝛽̂ = 0.2359 | 413.49 | 830.99 | 831.095 | 836.63 |
| ABAD | 𝛼̂ = 0.2148 | 𝛼̂ = 0.0096 | 489.35 | 980.713 | 980.74 | 983.53 |
| LBAD | 𝛼̂ = 0.1074 | 𝛼̂ = 0.0068 | 413.470 | 828.94 | 828.97 | 831.76 |
| AD | 𝛼̂ = 0.1074 | 𝛼̂ = 0.0068 | 413.47 | 828.94 | 828.97 | 831.762 |
Table text extracted from the original PDF; superscript letters are shown inline. The original table image is below.
View original table image
Conclusion
In this article, a new version of size biased exponential distribution has been introduced and named as Power Size Biased Exponential Distribution (PSBED). Various statistical properties of the said distribution have been derived. The PDF, CDF and HRF of the distribution have been represented through the graphs. The method of maximum likelihood estimation MLE has been used to estimate the parameters of the distribution. Finally, the performance of the distribution is checked through the data set where it shows better results than the parallel distributions.
Figures and tables from the paper
| Model | Parameter Estimation | Standard Error | −𝐥𝐨𝐠𝒍 | AIC | CAIC | BIC |
|---|---|---|---|---|---|---|
| PSBE | 𝛼̂ = 0.5122 𝛽̂ = 0.3583 | 𝛼̂ = 0.0510 𝛽̂ = 0.067 | 153.50 | 311.01 | 311.41 | 314.006 |
| WAD | 𝛼̂ = 0.0244 𝛽̂ = 0.0010 | 𝛼̂ = 0.0063 𝛽̂ = 0.4557 | 171.79 | 347.58 | 347.98 | 347.58 |
| ABAD | 𝛼̂ = 0.0489 | 𝛼̂ = 0.0042 | 217.79 | 437.58 | 437.71 | 439.08 |
| LBAD | 𝛼̂ = 0.0244 | 𝛼̂ = 0.0030 | 171.77 | 345.54 | 345.67 | 347.03 |
| AD | 𝛼̂ = 0.0244 | 𝛼̂ = 0.0030 | 171.77 | 345.54 | 345.67 | 347.03 |
Table text extracted from the original PDF; superscript letters are shown inline. The original table image is below.
View original table image
References
9 in the original paper- Abdous B, Berred A. Mean Residual Life Estimation. Journal of Statistical Planning and Inference. 2005;132:3-19.
- Abdual-Moniem IB, Seham M. Transmuted Gompertz Distribution. Computational and Applied Mathematics Journal. 2015;1(3):88-96.
- Afify ZA, Nofal MZ, Yousof MH, El Gebaly MY, Butt SN. The Transmuted Weibull Lomax Distribution: Properties and Application. Pakistan Journal of Statistics and Operational Research. 2015;11(1):135-137.
- Ahmad A, Ahmad SP, Ahmed A. Transmuted Inverse Raleigh Distribution: A Generalization of the Inverse Rayleigh Distribution. Mathematical Theory and Modeling. 2014;4(6):177-186.
- Ahmed A, Reshi JA, Mir KA. Structural Properties of Size Biased Gamma Distribution. Journal of Mathematics. 2013;5(2):55-61.
- Aryal GR, Tsokos CP. On the Transmuted Extreme Value Distribution with Application. Nonlinear Analysis Theory Method and Application. 2009;71(12):1401-1407.
- Elbatal I, Diab LS, Alim NAA. Transmuted Generalized Linear Exponential Distribution. International Journal of Computer Application. 2013;83(17):29-37.
- Hussian MA. Transmuted Exponentiated Gamma Distribution: A Generalization of the Exponentiated Gamma Probability Distribution. Applied Mathematical Sciences. 2014;8(27):1297-1310.
- Khan MS, King R. Transmuted Modified Weibull Distribution: A Generalization of the Modified Weibull Probability Distribution. European Journal of Pure and Applied Mathematics. 2013;6(1):66-88.
Cited by 1
From OpenAlex, OpenCitations and reference lists read by Scinovex
- The new size-biased weighted distribution with applications ↗
Ranen Z. Ahmood, Haneen A. Ameen, Eman Kh. Khalaf, Ruaa Wana · AIP conference proceedings · 2026
❝ 0