
Research article · 2022 · Full text
International Journal of Statistics and Applied MathematicsImpact of declaration of cooperation on the Nigerian crude oil production
Volume 7(2) · Pages 165–169 · DOI: 10.22271/maths.2022.v7.i2b.812 ↗
Research areasNatural Resources and Economic DevelopmentGlobal Energy and Sustainability ResearchOil, Gas, and Environmental Issues
Abstract
Author-writtenThe Nigerian economy has consistently suffered from global price shocks and its politics. And this shocks at many occasion has not been friendly with the Nigeria economy, since her over dependent on oil as the major source of revenue. A time-series model for the Nigerian monthly crude oil production is developed to examine the impact of Declaration of Cooperation (DoC). The data for this study are the monthly crude oil production spanning from January 1999 - December 2020. From the result, the impact parameter indicates that the DoC had a negative impact on the Nigerian crude oil production. That is, there’s about 35% level production reduction in Nigerian crude oil production after the introduction of DoC. The negative impact can further be seen in an all-time lowest drop in crude oil production (44,452,090 barrels) recorded in December 2020 after the introduction of DoC against a maximum crude oil production of 81,196,554 barrels recorded in October 2010 before the emergence of DoC. The intervention effect is described as immediate and gradual.
Summary
Source-checkedPlain-language reading of the full paper, prepared with AI and checked against the text. Each point links to the authors' own words.
Why it matters
- The Nigerian economy is highly vulnerable to global price shocks due to its heavy reliance on oil as its primary revenue source. View evidence ↗
- OPEC aims to unify petroleum policies to ensure stable prices for producers and a regular supply for consumers. View evidence ↗
- The Declaration of Cooperation (DoC) was established in December 2016 by OPEC and 10 non-OPEC nations to stabilize the oil market and reduce inventory levels. View evidence ↗
The question
- The study aims to examine how the Declaration of Cooperation (DoC) impacted monthly crude oil production in Nigeria. View evidence ↗
What they did
- The researchers used monthly crude oil production data from January 1999 to December 2020, sourced from the NNPC Statistical Bulletin. View evidence ↗
- The data was split into two periods: Series-1 (pre-intervention, Jan 1999 – Nov 2016) and Series-2 (post-intervention, Dec 2016 – Dec 2020). View evidence ↗
- The study employed an ARIMA-Intervention model to analyze the effects of the external event (DoC) on the time series data. View evidence ↗
- Data analysis was performed using the R language version 4.1.2-win. View evidence ↗
What they found
- The highest production was 81,196,554 barrels in October 2010, while the lowest was 44,452,090 barrels in December 2020. View evidence ↗
- The ARIMA(0,1,1)(0,1,1)12 model was determined to be statistically significant and adequate for the data. View evidence ↗
- The impact parameter of -0.1838 (p=0.0001) indicates that the introduction of the DoC significantly reduced crude oil production. View evidence ↗
- Following the DoC, Nigerian crude oil production levels were reduced by approximately 35% compared to the pre-intervention mean. View evidence ↗
- The delay parameter (b=0) suggests that the effect of the DoC was felt immediately at the time of its introduction. View evidence ↗
What it means
- The authors conclude that the DoC had a negative impact on Nigerian crude oil production, causing an immediate and gradual reduction of about 35%. View evidence ↗
Visual summary
1 visualsIllustrations explain the paper; they do not show study data.
Impact of DoC on Production
AI-generated conceptual illustration (Nigerian crude oil production infrastructure). It explains the idea and does not show study data.
View source evidence ↗Figures & tables
From the original paper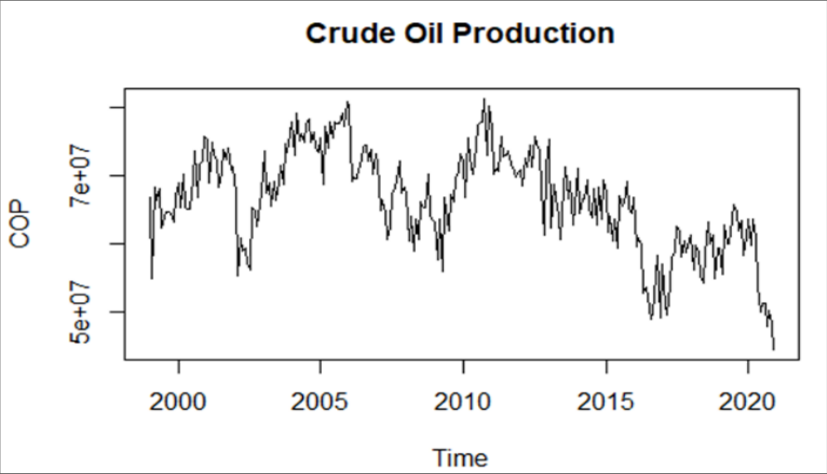 Figure 1
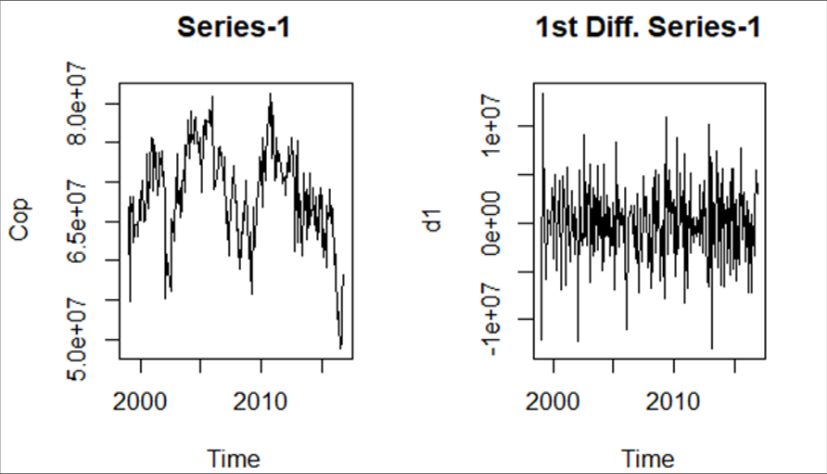 Figure 2
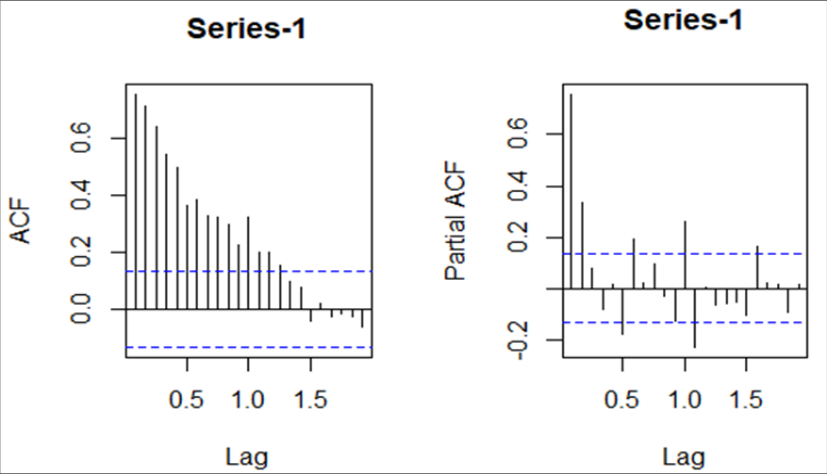 Figure 3
 Table 1
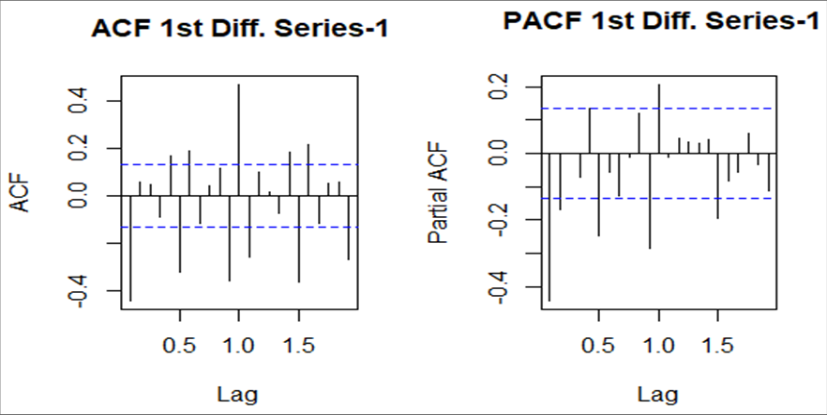 Figure 4
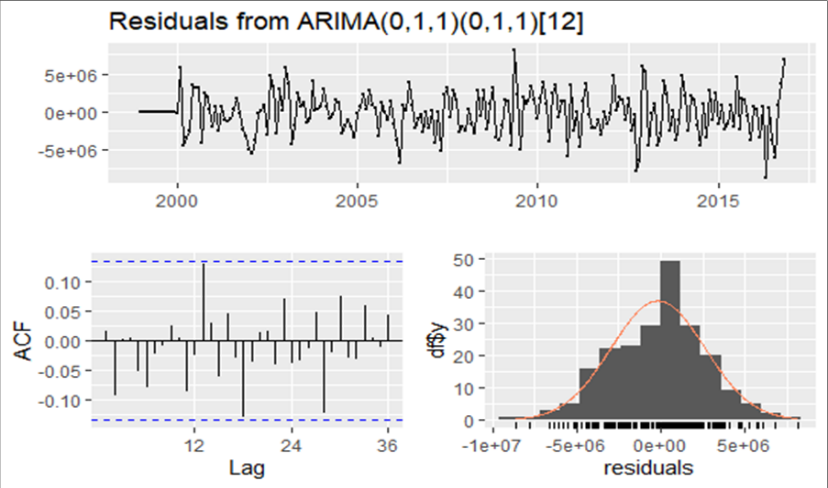 Figure 5
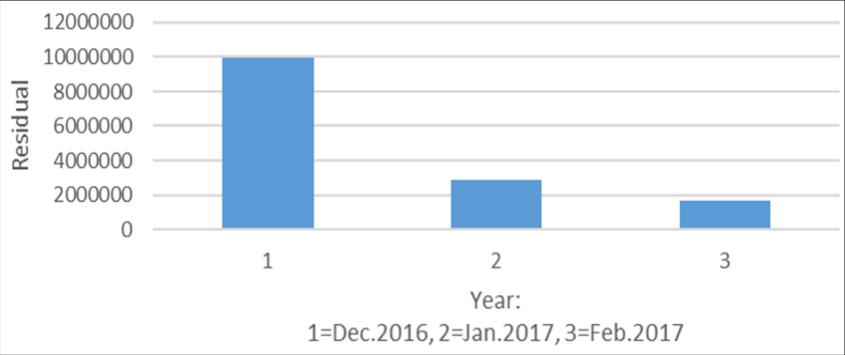 Figure 6
 Figure 6
 Table 2
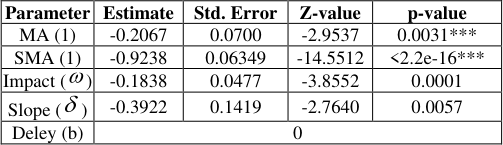 Table 3
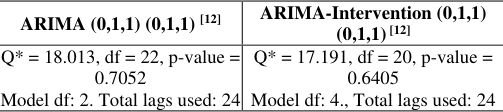 Table 4
Introduction
Crude oil and its importance in powering the world economy can't be overemphasized. Sustainable access to crude oil has remained a key aspect of international politics and relations by both importing and exporting countries. Import-dependent countries are interested on how to maintain sustainable, secure access to oil at low prices, whereas oil exporting countries, are interested in balancing their desire to uphold prices and revenues while maintaining market share. Between 1920 and 1973 the seven sisters were firmly in control of world oil. They had substantial influence on decisions concerning where and when to drill for oil, how much to produce, and what price would be charged for the oil. These eventually raised concerns among the Petroleum Exporting Countries who wanted to obtain more benefits from their crude oil deposits and wanted to have greater control. It was these countries namely Iraq, Iran, Kuwait, Saudi Arabia and Venezuela that decided to form the Organization of Petroleum Exporting Countries (OPEC) in September 1960 and more other countries were added like Nigeria (1971) and recently Gabon re-joined (2016), Equatorial Guinea (2017), Congo (2018). OPEC's clear objective is to co-ordinate and unify petroleum policies among members countries, in order to secure fair and stable prices for petroleum producers; an efficient, economic and regular supply of petroleum to consuming nations; and a fair return on capital to those investing in the industry. One of OPEC's recent intervention is the Declaration of Cooperation (DoC) which constitutes an unprecedented milestone in the history of OPEC. Market conditions led to the emergence of the unprecedented Declaration of Cooperation (DoC) in December 2016, with OPEC members and 10 non-OPEC oil-producing countries coming together to help rebalance the market, bring down inventory levels and support oil market stability.
Review of Literature
Box Jenkins ARIMA methodology has been a widely used technique for modelling and forecasting in time series [1] . However, when the patterns of the time series are interrupted by some external event (known as intervention), then the forecasting performance of ARIMA model may be affected.
However, it can be improved by employing appropriate techniques such as ARIMA-Intervention model developed by [2] . In this study the data on monthly crude oil production is analysed using the ARIMA-Intervention model [2] . Intervention analysis measures the effect of an external or exogenous intervention on a time series data of interest. This technique has been successfully applied by scholars like: Etuk et al. (2021) [3] used Arima-intervention Analysis in modelling Nigerian Automotive Gas Oil Distribution. Etuk and Amadi (2021) [4] modelled Nigerian Monthly Crude Oil Prices using Arima-intervention model. Shittu and Inyang (2019) [9] modelled Nigerian monthly crude oil prices using the ARIMA Intervention model with a view to comparing the result with that of the intervention model using lag operator. Wiri and Tuaneh (2019) [10] modelled the Nigerian Crude Oil Prices Using ARIMA, Pre-intervention and Post-intervention Model. Mrinmoy et al. (2014) [6] used time series Intervention Modelling for Modelling and Forecasting Cotton Yield in India. Jarrett and Kyper (2011) [5] , used ARIMA Modelling with Intervention to Forecast and Analysed Chinese Stock Prices. Roy et al. (2009) [8] used ARIMA -Intervention Analysis in Modelling the Financial Crisis in China's Manufacturing Industry. Therefore, this paper attempts to investigate the impact of OPEC's DoC on the Nigerian crude oil production.
Model Specification
Let {𝑍 𝑡 } be a time series. Suppose there is an event occurring which changes the trend in the series. This event is referred to as an intervention. If it occurs at time t=T, [2] proposed that the pre-intervention observation of {𝑍 𝑡 } be modelled as [1] . Intervention model is of the general form:
𝐵 𝑏 , Transfer function component (2)
Accordingly, intervention models with non-seasonal and seasonal ARIMA process can be written respectively as The intervention type of "step function" starts from a given time till the last time period. In this study the indicator function was labelled as:
Data Description
The data used for this study are the monthly crude oil production (COP) spanning from January 1999 -December 2020, were collected from The Nigerian National Petroleum Corporation (NNPC) Statistical Bulletin [7] . The dataset was divided into observations belonging to pre-intervention period (January 1999 -November 2016) named as Series-1 and postintervention period (December 2016 -December 2020) named Series-2. The statistical package used for the analysis of this work is the R language (R-4.1.2-win).
Results and Discussions
The data were divided into observations belonging to preintervention period named Series-1 and post-intervention period named Series-2. Intervention analysis [2] is employed to measure the effect of the external event being the DoC on the Nigerian crude oil production for period under study. The DoC was introduced in December 2016 and this point were labelled by indicator function in (9). In view of making sense from the dataset, basic summary statistics were obtained. The monthly crude oil production from January 1999 to December 2020 had a total of 264 observations, Series-1 (Jan. 1999 -Nov. 2016) had a total 215 observations while Series-2 (Dec. 2016 -Dec. 2020) had total of 49 observations. The lowest crude oil Production occurred in December 2020 with the sum of 44,452,090 barrels, maximum production was recorded in October 2010 with 81,196,554 barrels and total sum of production under this study was 17,527,420,000 barrels. The time plot in Fig. 1 which is the monthly COP under the studied period. The graph of the series does not show any unique pattern as it rises and falls at random; perhaps dues to the mechanism that generated the data set. The dataset on monthly COP was divided into Series-1 and Series-2 defined above. Series-1 was used for model fitting while Series-2 was used in determining the intervention component form. Preintervention plots shown in Fig. 2 (1 st graph) and Fig. 3 shows that the series was non-stationary. The series was transformed to attain stationarity, Fig. 2 (2 nd graph) & Table 1 (ADF test). Following the 3 iterative stages by [1] , ARIMA(0,1,1)(0,1,1) 12 was found to be statistically significant and adequate, Fig. 5 and Table 4.
From the impulse response function, it can be inferred that b=0, implying that effect of the intervention was felt at the point of the intervention itself, Fig. 6. The impact parameter with value -0.1838 was significant with p-value (0.0001). The negative sign of the intervention parameter (-0.1838) indicates that crude oil production were reduced after the introduction of DoC by OPEC. In percentage terms, this indicates that alevel production is reduced to 65%
Conclusion
The full model in (10) was found to be statistically significant and adequate. The significance of the impact parameter indicates that the DoC has a negative impact on Nigerian crude oil production. That is, there's about 35% level production reduction in Nigerian crude oil production after the introduction of DoC by OPEC and the effect of the intervention is immediate and gradual. Visually the negative impact of DoC can further be seen in the lowest drop of crude oil production (44,452,090 barrels) recorded in December 2020 after the introduction of DoC against a maximum crude oil production of 81,196,554 barrels recorded in October 2010 before the emergence of DoC.
Figures and tables from the paper
| Parameter | Estimate | Std. Error | Z-value | p-value |
|---|---|---|---|---|
| MA (1) | -0.2721 | 0.0758 | -3.5883 | 0.0003*** |
| SMA (1) | -0.999 | 0.1183 | -8.453 | <2.2e-16*** |
| BIC =6631.595 | AIC=6621.671 |
Table text extracted from the original PDF; superscript letters are shown inline. The original table image is below.
View original table image
References
8 in the original paper- Box GEP, Tiao GC. Intervention Analysis with Application to Economic and Environmental Problems. Journal of American Statistical Association. 1975;70(349):70-79.
- Etuk EH, Moffat IU, Agbam AS. Intervention Analysis of Nigerian Automotive Gas Oil Distribution. Nigerian Journal of Oil and Gas Technology. 2021;3:2.
- Etuk EH, Amadi EH. Arima Intervention Analysis of Nigerian Monthly Crude Oil Prices. Nigerian Journal of Oil and Gas Technology. 2021;3(1)107-115.
- Jarrett JE, Kyper E. ARIMA Modelling with Intervention to Forecast and Analyze Chinese Stock Prices. Int. J Eng. bus. Manag. 2011;3(3):53-58.
- Mrinmoy R, Ramasubramanian V, Amrender K, Anil R. Application of Time Series Intervention Modelling for Modelling and Forecasting Cotton Yield. Statistics and Applications. 2014;12(1-2):61-70.
- Roy CPC, Ip WH, Chan SL. An ARIMA -Intervention Analysis Model for the Financial Crisis in China's Manufacturing Industry. Intervention Journal of Engineering Business Management. 2009;1(1):15-18.
- Shittu OI, Inyang EJ. Statistical Assessment of Government's Interventions on Nigerian Crude Oil Prices. A Publication of Professional Statisticians Society of Nigeria, Proceedings of 3rd International Conference. 2019;3:519-524.
- Wiri L, Tuaneh GL. Modelling the Nigeria Crude Oil Prices Using ARIMA, Pre-intervention and Postintervention Model. Asian Journal of Probability and Statistics. 2019;3(1):1-12. Article No. AJPAS.46900
Cited by 5
From OpenAlex, OpenCitations and reference lists read by Scinovex
- Time Series Intervention Modelling Based on ESM and ARIMA Models: Daily Pakistan Rupee/Nigerian Naira Exchange Rate ↗
Elisha John Inyang, Ette Harrison Etuk, Ngia Matthew Nafo, Yvonne Asikiye Da-Wariboko · Asian Journal of Probability and Statistics · 2023
The battered Nigerian economy has slipped into its second economic recession in five years due to the fallout of the coronavirus pandemic. And this has had a remarkable effect on the value of the Nigerian Naira that are exchanged for a unit of many other currencies of the world. Intervention modelling is used to assess the impact of this external…
❝ 3PDF - Non-seasonal ARIMA modeling of stroke incidence ↗
Elisha John Inyang, E.P. Clement, M.A. Raheem, E.M. Usungurua · World Journal of Applied Science & Technology · 2025
This study employs the ARIMA Box-Jenkins methodology to model monthly stroke incidence data from January 2011 to December 2021. A non-seasonal ARIMA (p,d,q) model is fitted, with ARIMA (1,1,1) identified as the optimal model based on its lowest BIC (=781.5278) and AIC (=772.9022) values compared to alternative models. The Ljung-Box statistic (19.931, df = 22, p = 0.5885 > 0.05)…
❝ 1PDF - ETS - ARIMA Intervention Modelling of Bangladesh Taka/Nigerian Naira Exchange Rates ↗
Elisha John Inyang, Ngia Matthew Nafo, Anthony Ike Wegbom, Yvonne Asikiye Da-Wariboko · Science Journal of Applied Mathematics and Statistics · 2024
In real-world scenarios, numerous external events disrupt many time series, causing fluctuations in the series' mean level. When modeling such series using the traditional ARIMA model, this can result in distortions in the model's parameter estimations, the structure of the fitted model, and future value projections. Any unusual values in the series that might have arisen as a result of…
❝ 1PDF - The role of artificial intelligence in advancing green building projects in Nigeria ↗
Nnamaka U Nzewi, Benjamin Anabaraonye, Nzemeka C Olisah · International Journal of Research in Engineering · 2024
Disruptive innovation is presently occurring in Nigeria’s construction industry through the green building projects which has a great role to play in enhancing climate resilience. According to the Green Building Council of Nigeria, the number of green building projects in the country is on the rise. The green building projects incorporate sustainable design, energy-efficient technologies, and eco-friendly construction materials, leading
- Modelling intervention of Columbian peso to Nigerian naira exchange rates due to 2016 & 2020 Nigerian economic recessions
Amadi Ebere Peace, Etuk Ette Harrison · International Journal of Statistics and Applied Mathematics · 2023
The modelling and forecasting of exchange rates yield valuable outcomes that contribute to informed financial decision-making. This study aims to analyze the impact of the intervention of the Columbian PESO on the exchange rates of the Nigerian Naira during the economic recessions of 2016 and 2020. By examining the fluctuations in the exchange rate, this research seeks to gain a deeper understanding of the bilateral commercial relationship between the two nations. The data pertaining to the daily exchange rates between the Nigerian Naira and the Columbian Peso for the periods spanning from 1 J