
Research article · 2022 · Full text
International Journal of Veterinary Sciences and Animal HusbandryAssessment of agro-chemicals utilization and honeybee poisons plants in Sidama National regional state, Ethiopia
Volume 7(4) · Pages 01–14 · DOI: 10.22271/veterinary.2022.v7.i4a.425 ↗
Research areasPlant and animal studiesInsect and Pesticide ResearchBee Products Chemical Analysis
Abstract
Author-writtenThe study was conducted with the objective of identifying honeybee poisoning plant and assessing the status of agro-chemicals utilization in Sidama zone, Southern Ethiopia. Semi-Structured questionnaires were developed and 160 individuals (80 beekeepers and 80 non beekeepers) were interviewed by using purposive sampling. The result of this assessment indicated that 75 (93.75%) of beekeepers complained presence of plant poisoning on honeybees in the study area. Ten plants were complained having poisoning effect on honeybees by beekeepers in the study area. Among these plants Lanthana camara, Euphorbia cotinifolia, Clematis flammula, Ranunculus multifidus, Discopodium penninervis, Climatisinte grifolia, Datura metal linn, Sesbania sesban, Phytolacca americana and Justicia schimperiana, were the most frequently complained toxic plants in the study area. Seven different agro-chemicals (2,4-D, Agrothoate 40% Malathion 50%, pyriban 48%, Diazinon 60%, Macozeb 80% and Pallas 45 OD) were commonly applied on various crop in the study area. The main sources of these agro-chemicals are cooperative, legal and illegal traders. 95% of farmers used empty containers for household purpose. 3.25% of the respondents left in farm while 1.25% of the respondents indicated that they have burnt. Most of agro-chemical users (80%) of the respondents had no training on how to apply Agro-chemicals safely to honeybees, themselves and environment and 97.5% of respondents applied agro-chemicals without following the recommended instructions in addition 95.62% of the respondents did not use protective clothes when spraying. Therefore, further study on complained poisonous plants and toxic chemicals in the study area, and proper utilization agro-chemicals are important to minimize poisoning of honeybee.
Summary
Source-checkedPlain-language reading of the full paper, prepared with AI and checked against the text. Each point links to the authors' own words.
Why it matters
- Certain plant species produce secondary compounds in their pollen and nectar that can be toxic to pollinators like honeybees. View evidence ↗
- The use of herbicides and pesticides for crop production and malaria eradication has significantly decreased honey production. View evidence ↗
- Indiscriminate pesticide use has led to severe economic losses and the death of thousands of honeybee colonies in some Ethiopian regions. View evidence ↗
The question
- The study aimed to identify plants that poison honeybees and assess how agro-chemicals are used in the Sidama zone of Southern Ethiopia. View evidence ↗
What they did
- The researchers used purposive and stratified random sampling to interview 160 individuals, split equally between 80 beekeepers and 80 non-beekeepers. View evidence ↗
- Data was gathered through semi-structured questionnaires administered by the researcher and trained enumerators. View evidence ↗
- Data was analyzed using SPSS version 20, with Chi-square tests used to determine significant differences between variables. View evidence ↗
What they found
- A vast majority of beekeepers (93.75%) reported the presence of plants that poison honeybees in the study area. View evidence ↗
- Improper agro-chemical use negatively affected all 80 beekeepers, resulting in an average annual loss of 19.45±4.0 kg of honey per person. View evidence ↗
- The financial impact of unwise agro-chemical use was an average loss of 1167±245.42 ETB per beekeeper. View evidence ↗
- Safety practices were poor: 80% of users had no training, 97.5% ignored recommended instructions, and 95.62% did not use protective clothing. View evidence ↗
- The majority of farmers (95%) reused empty agro-chemical containers for household purposes rather than disposing of them safely. View evidence ↗
- A high percentage of respondents applied the herbicide 2,4-D at midday, a time when honeybees are typically active. View evidence ↗
- All observed agro-chemical application rates for weed, pest, and disease control deviated from the recommended doses. View evidence ↗
What it means
- The authors conclude that toxic plants and agro-chemical poisoning are primary drivers of honeybee health issues in the Sidama zone. View evidence ↗
- The authors recommend further research on the identified toxic plants and chemicals, alongside promoting the proper use of agro-chemicals to protect honeybees. View evidence ↗
- The identification of toxic plants was based on beekeeper complaints and requires laboratory confirmation. View evidence ↗
Visual summary
1 visualsIllustrations explain the paper; they do not show study data.
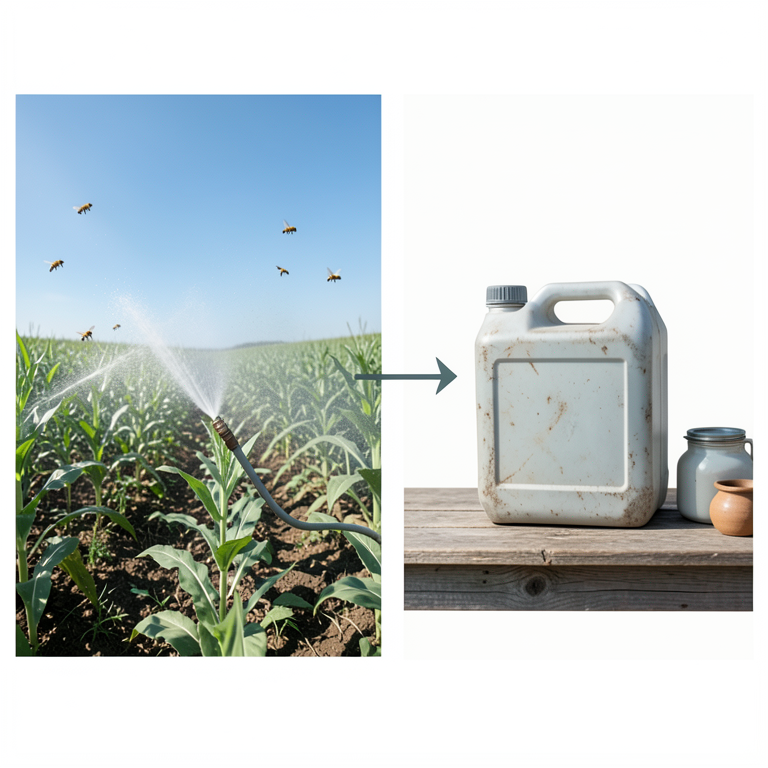
Unsafe Agro-chemical Practices
AI-generated conceptual illustration (honeybees and agricultural crops in Ethiopia). It explains the idea and does not show study data.
View source evidence ↗Figures & tables
From the original paper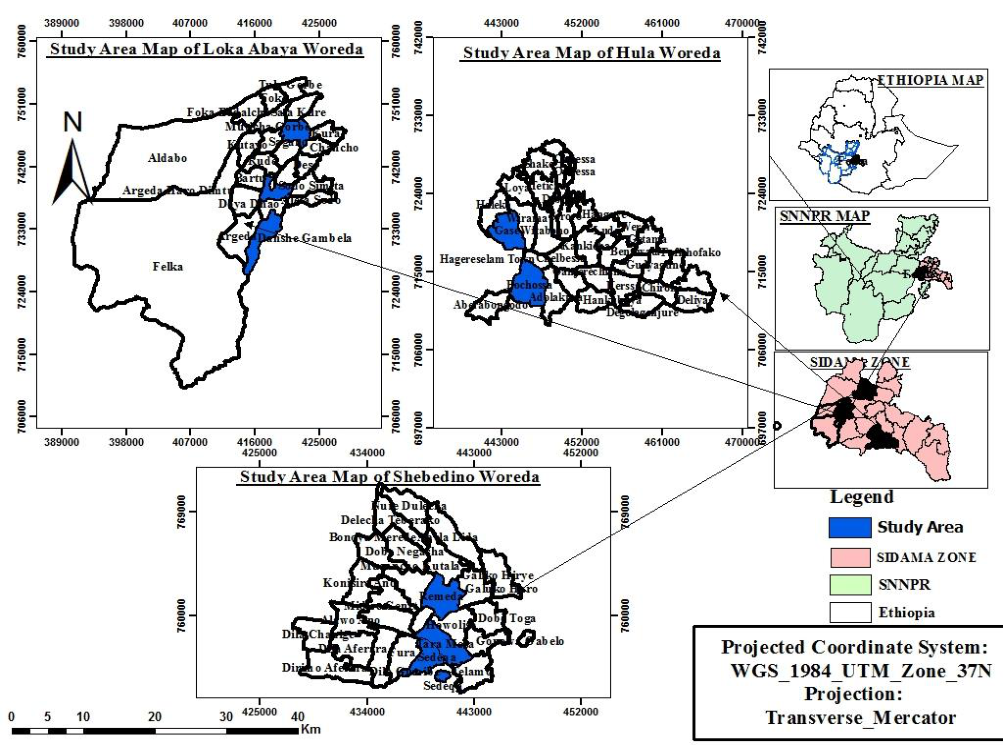 Figure 1Page 2
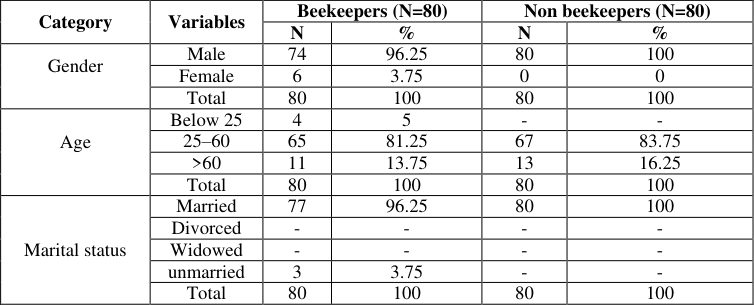 Table 2Page 3
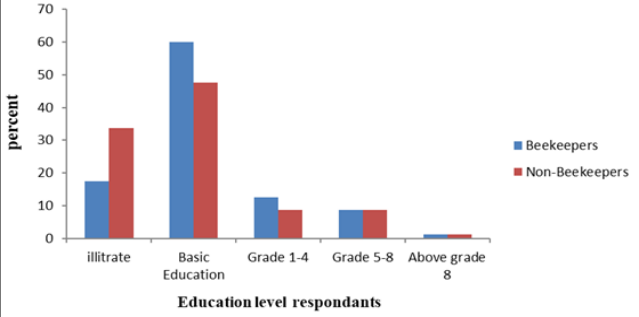 Figure 2Page 3
 Table 3Page 4
 Table 4Page 4
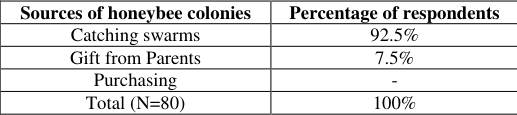 Table 5Page 4
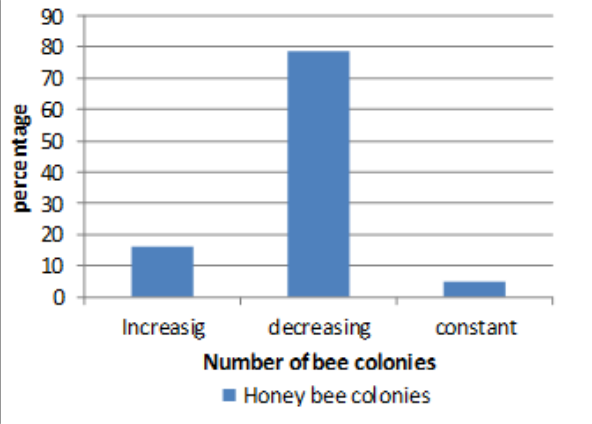 Figure 3Page 5
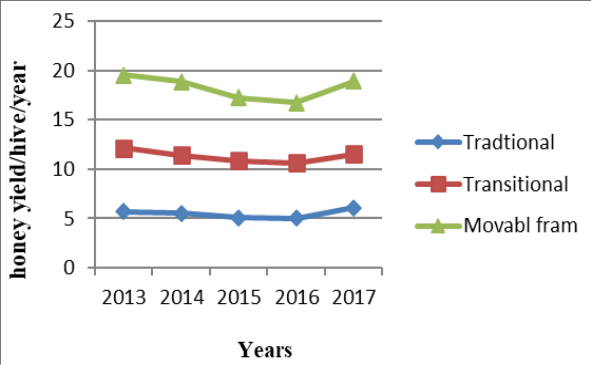 Figure 4Page 5
 Table 6Page 6
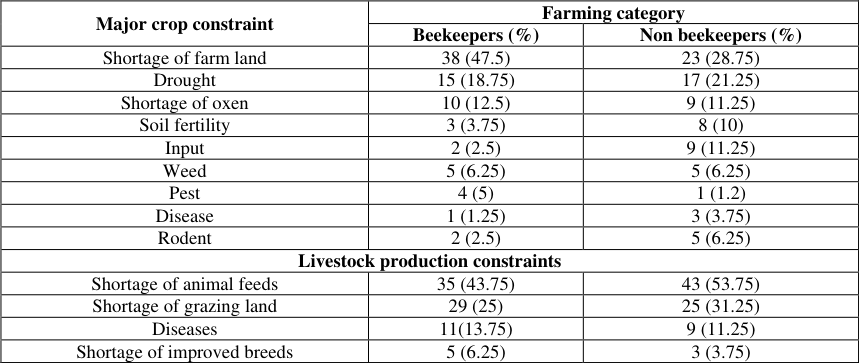 Table 7Page 6
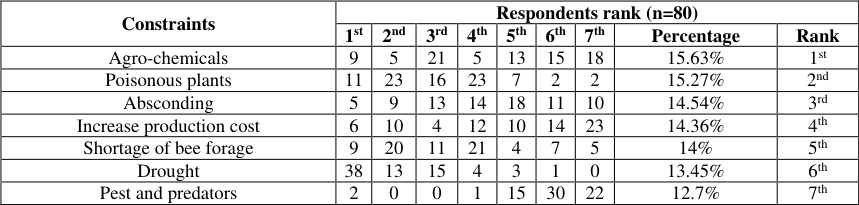 Table 8Page 6
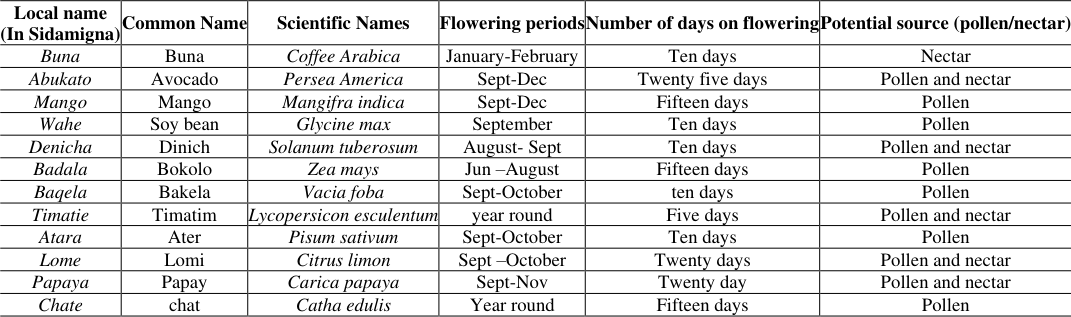 Table 9Page 7
 Table 10Page 7
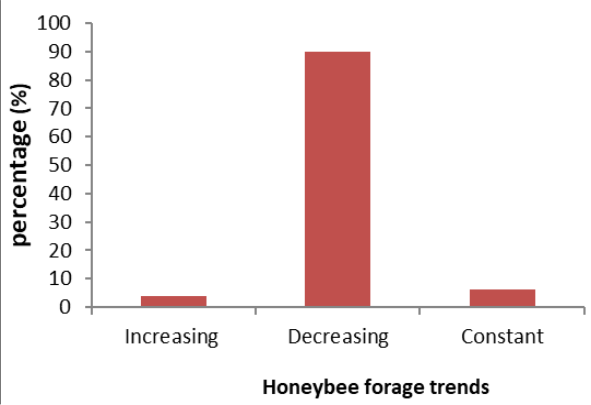 Figure 5Page 7
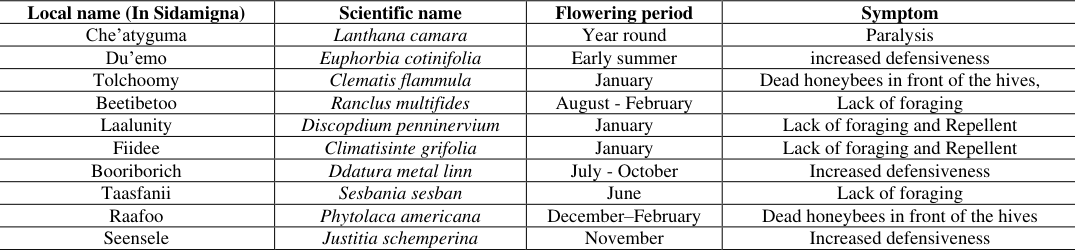 Table 11Page 8
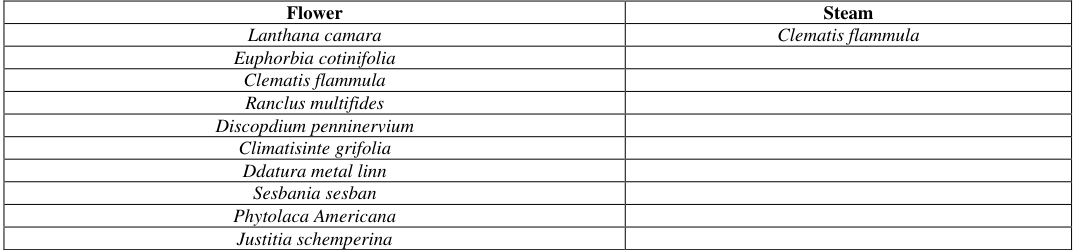 Table 12Page 8
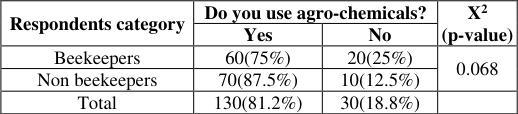 Table 13Page 9
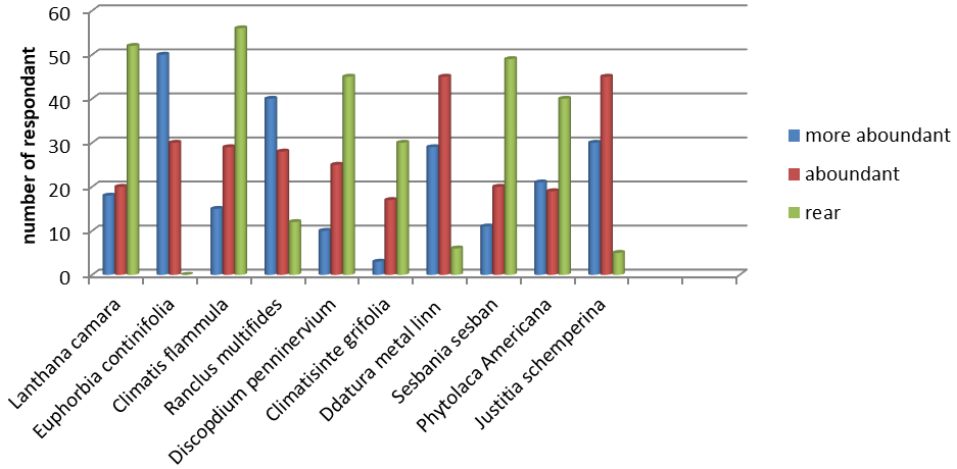 Figure 6Page 9
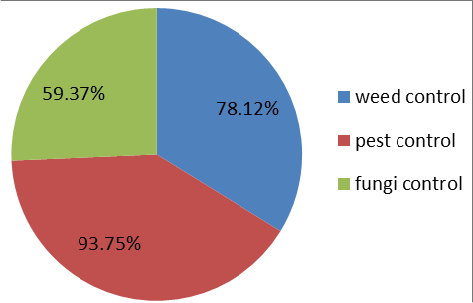 Figure 7Page 9
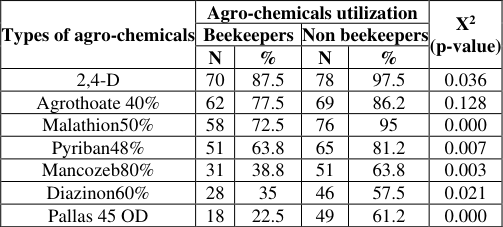 Table 14Page 10
 Table 15Page 10
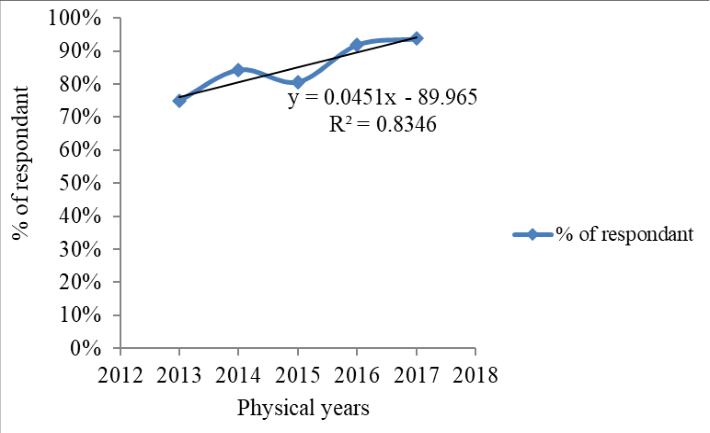 Figure 8Page 10
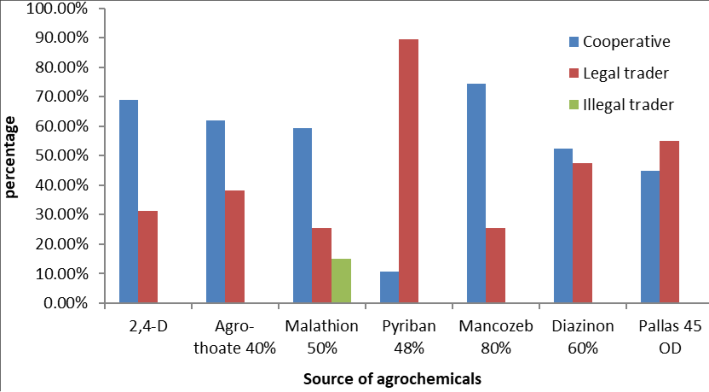 Figure 9Page 11
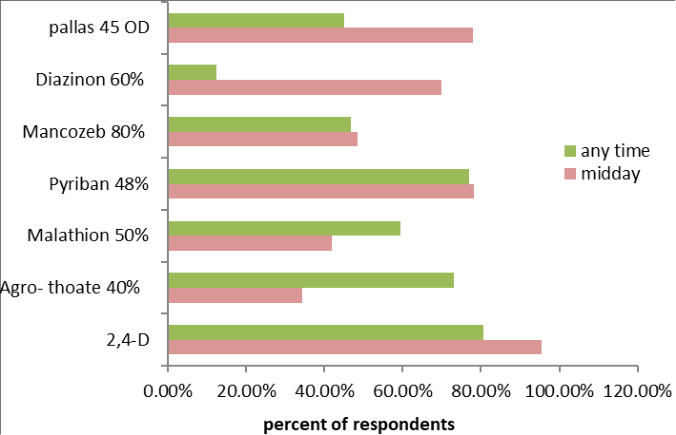 Figure 10Page 11
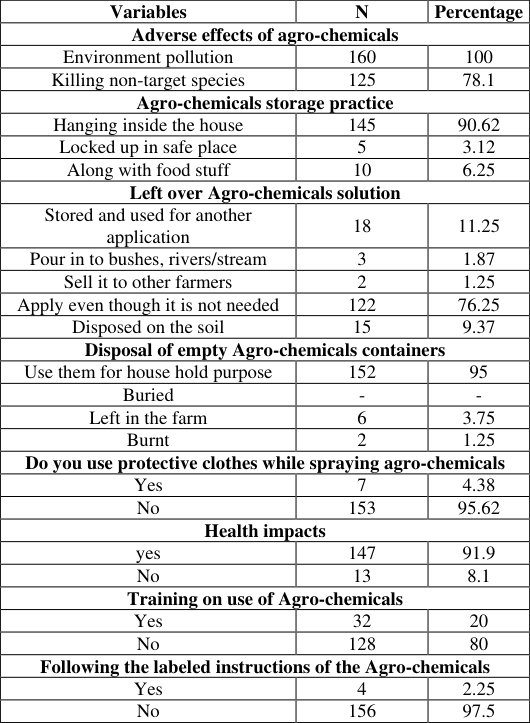 Table 16Page 12
 Table 18Page 12
Introduction
The toxic effects of poisons plants in livestock after ingestion or absorption includes, physical disturbance, decrease productivity and death (Abera Dereje, 2015) [2] . Various plant species contain secondary compounds in nectar and pollen that could be toxic to pollinators, including bees. For instance, the Almond tree (Amygdalus communis L-Rosaceae) contains the cyanogenic glycoside amygdalin that releases cyanide. Amygdalin is found in the nectar and pollen of almond trees and consumption of this pollen can be toxic to honeybees (Abera Dereje, 2015; Kevan, 2005) [2] . The introduction of pesticide in Ethiopia to control agricultural pests' dates back to the 1960's (EPA, 2004) [12] . Poisoning of honeybees by agro-chemicals has been increased from time to time. The promotion of some agricultural inputs such as pesticides and herbicides for cereal crops production and the use of deadly chemicals for malaria eradication program have substantially reduced honey production (Gezahegn Tadesse, 2001) [14,28] . According to Desalegn Begna (2015) [11] , there is a growing pesticides grievance on honeybee population and their products decline with considerable economic impacts on beekeepers. Indiscriminate uses of pesticides caused fatalities 22987 honeybee colonies and incurred economic loss amounting of $819291.37 USD in Bure districts of Amhara Region. Similarly beekeepers and beekeeping experts of the Sidama have always blame the indiscriminate use of agro-chemicals and honeybee poisonous plants for the loss of honey bee colonies in the area.
They repeatedly reported that honeybee colony population and swarms, honey production had declined in the area. According to their reports these are critical problems particularly during September-November when most agrochemicals are applied in cultivated field and dearth period honeybees are exposure to poisonous plants in the area. However, there were no substantial quantitative data on these cases. Therefore this study was initiated to assess major honeybee poisonous plants and utilization of the agrochemicals in Sidama region, Ethiopia.
Materials and Methods
Materials and Methods
Description of the study area
Sidama region is located at a distance of 273 km South of Addis Ababa with GPS coordinates of latitude: 5 o 45″ and 6 o 45″north and longitude, 38 o and 39 o East. Sidama is bordered on the South by the Oromia Region (except for a short stretch in the middle where it shares a border with Gedeo zone), on the West by the Bilate River, which separates it from Wolayita zone, and on the North and East by the Oromia region. The zone has a total area of 10,000 km 2 and 2,954,136 total populations (of which 1,491,248 are males and 1,462,888 are females). When we see its land use features, the zone's total land falls in to the following categories: 48.70% cultivated, 2.29% forest, 5.04% shrub and bush land, 17.47% grazing land and 18% uncultivated land (Teklu G and Dinku N., 2016) [29] .
Sampling Methods and Sample Size Determination
This particular study was conducted in three representative districts of Sidama zone selected from each of the three agroecologies (highland, midland and lowland). Agro-ecology representation, beekeeping and crop potential, status and intensity of agrochemical application and accessibility were used as districts and kebele selection criteria. Accordingly, eight Kebeles (3 from lowland, 3 from midland and 2 from highland) from three representative districts namely Hula (representing highland), shebedino (midland) and Loka Abaya (lowland) were selected using purposive random sampling technique. In order to collect primary data from respondents, a formula described by Yamane 1967 was employed to select sample respondents. Accordingly, 160 respondents (80 beekeepers and 80 non beekeeprs) out of 270 model farmers identified in the study area were selected using a purposive and stratified random sampling technique.
Where N= sample size N= total population e= sampling error (e=0.05)
Methods of data collection
Information was collected using semi-structured questionnaire by the researcher and trained enumerators. Before the actual survey the questionnaire was pre-tested. The main data was collected through the survey included: Socio-economic characteristics of the households:gender, age, family size, education level, land holding and livestock holding.
Beekeeping production system: Source of colony, trend of honey production and honeybee colony Uses of agro-chemicals: The type of agro-chemicals, extents of uses, means of application and the hazards it might cause and level of experiences in using agrochemicals Constraints of apiculture in the areas: Trends of agrochemicals application, identified poisonous plants, Pests and diseases data were collected.
Data Management and Statistical Analysis
The collected data from the survey were coded and stored into computer loaded SPSS software programs version 20, and cleaned for consistency and accurateness. The statistical analysis used in the study varied depending on the type of variable and information obtained. Summarized data were presented in the form of tables and figures. Chi-square was used to test the significance difference between or among values whenever necessary and the constraints of the apiculture in the study areas were prioritized using rank index.
Results and Discussion
Results and Discussion
Socio-Economic Characteristics of Household
The general characteristics associated with beekeeping and non-beekeeping households distributed by gender, age, marital status, farmland holding and educational level are presented in Table 2 and figure 1. Of the total respondents, 96.25% and 100% of the beekeepers and non-beekeepers respectively were male while the remaining 3.75% of beekeepers were females. This is in line with the finding of Addis Getu and Malede Birhanu (2014) [3] and Dereje Shibru et al. (2016) [10] who reported that majority of farming activities are duties of male society. Moreover, the limited numbers of female participation in beekeeping activities agree with Tessega Belie (2009) [30] who indicated that only 1.7%
| Category | Variables | Beekeepers (N=80) | — | Non beekeepers (N=80) | — |
|---|---|---|---|---|---|
| N | % | N | % | ||
| Gender | Male | 74 | 96.25 | 80 | 100 |
| Female | 6 | 3.75 | 0 | 0 | |
| Total | 80 | 100 | 80 | 100 | |
| Age | Below 25 | 4 | 5 | - | - |
| 25–60 | 65 | 81.25 | 67 | 83.75 | |
| >60 | 11 | 13.75 | 13 | 16.25 | |
| Total | 80 | 100 | 80 | 100 | |
| Marital status | Married | 77 | 96.25 | 80 | 100 |
| Divorced | - | - | - | - | |
| Widowed | - | - | - | - | |
| unmarried | 3 | 3.75 | - | - | |
| Total | 80 | 100 | 80 | 100 |
Table text extracted from the original PDF; superscript letters are shown inline. The original table image is below.
View original table image
were female. So that few women's are engaged in beekeeping activity in the area and not economically empowered through beekeeping.
The age of about 81.25% of beekeepers and 83.75% of nonbeekeepers interviewed in the study area ranges between 25-60 years old. This result showed that people are engaged in beekeeping activities both at the younger and older ages. This result correlates with Tewodros Alemu et al. (2015) [31] , Dereje Shibru et al. (2016) [10] , Sintayehu Fetene (2016) [27] , Wolaye Kiros and Teklberhan Tsegay (2017) [34] results, who reported that beekeeping learnt through generation and practiced by all economically active age groups ranges between 25-60 years old. Of the total interviewed households, 98.1% were married and 1.9% unmarried. Marriage helps farmers to sustainably engage in crop production and beekeeping practices to ensure the livelihood of their families and option for asset building. This result agreed with Haftu Kebed and Gezu Tadess (2014) [18] , who stated that high percentage of the respondents (96.8%) were married and engaged to agricultural production.
Concerning to level of education, the highest percentage 27 (33.75%) and 14 (17.5%) of non-beekeepers and beekeepers were illiterate respectively. This result indicates that most of beekeepers are educated compared to non-beekeepers. In other districts, numbers of illiterate in non-beekeepers are more than the beekeepers. Time and thereby improve the productivity and production of their agricultural activities. Education affects technology adoption, household income and socio-economic status of the family. Figure 2, explains why most of the farmers engaged in beekeeping activity are more literate compared to non-beekeepers who are slower to adopt other agricultural activities. This result agree with Malede Birhan (2015), who stated that education is an important and one entry point for fast transfer of knowledge on improved beekeeping. The average farmland holding of the respondents were 1.43±0.07ha. The data has described that the overall mean of land holding in the study area is similar with the mean national average (1-1.5 ha). Similarly, Chala Kinati (2010) [8] and Bekele Tesfy (2015) [7] reported that average land holding of farmers in Oromiya region was 1.48±0.09 hectors.
Based on this study the overall mean family size of the beekeepers were 5.6±0.13 per household with a maximum of 9 and a minimum of 2 peoples. According to Bekele Tesfy (2015) [7] result, family sizes of Bale zone of Oromiya region was 8.01±0.27. So that, this finding agreed with the above report. N = Number of cases, SE = Standard error of mean
The main income sources for beekeepers were crop 0.35(1 st ), beekeeping 0.33 (2 nd ) and livestock 0.32 (3 rd ) ranked in decreasing order. Honeybee products marketed locally to provides incomes for various beekeepers in the study areas.
As indicated in the table below beekeepers had not full of confidence in beekeeping as main income source rather than crop production in the study area. This is due to traditional production system, lack of knowledge and migratory nature of the colony was the major challenges for hindering beekeeping thought as main income source in the study area. Whereas, crop and livestock were the 1 st and 2 nd ranks income source for non-beekeepers. 5). Interestingly, colony purchase has never been used as a source of honeybee colonies to start beekeeping in the study area. This is most probably because of poor extension services system, poor adoption of improved beekeeping technologies, high costs of beekeeping equipment. This result is partially in line with findings of Addis Getu and Malede Birhan (2014) [3] , Haftu Kebede and Gezu Tadesse (2014) [18] , Teklu Gebretsadik and Dinku Negash (2016) [29] , Welay Kiros and Tekleberhan Tsegay (2017), Abebe Mitikie (2017) [1] . They have stated that swarms catching are the main sources of honeybee colonies to start beekeeping in various parts of the country. Moreover, bee colony marketing is not a trend or is not common in the study area. This is due to the fact that farmers could catch colonies easily when reproductive swarming is active.
Trends of bee colonies in the study area
From the total respondents, about 78.8% of beekeepers replied that honeybee colonies in the study area is decreasing over the past year due to indiscriminate use of agrochemicals, shortages of bee forages and pests and predators are the major limiting constraints. The remaining 16.3% and 5% of the respondents replied that beekeeping practice is increasing and remain in the same in the past years respectively (Fig. 3). Even if the government is giving a special attention to beekeeping and high involvement of different NGO to this sector is higher, number of bee colonies is steadily decreasing from time to time due the trends of agrochemicals application increase.
Trends of honey yield in different hive type
According to the survey result, the trend in honey yield from different hive types has decreased during 2013-2016 but increased in 2017. The collected data revealed that the average honey yield obtained from traditional hives has steadily reduced from 5.72 kg/hive/year to 5 kg/hive/year during 2013-2016 and increased to 6.06 kg/hive/year in 2017.
Similarly, the average honey yield obtained from transitional hive reduced 12.16 kg/hive/years to 10.64 kg/hive/year and 19.54 kg/hive/year to 16.91kg/hive/year in movable frame hive through year 2013 to 2016. whereas, honey yield increased to 11.5 kg/hive/year from a transitional hive and to 18.91 kg/hive/year from movable frame hives in 2017(Fig. 4). Honey yield achieved better performance in 2017 rather than the years before. This is due to availability of ample bee forage and suitable climatic conditions for honeybees to provide high honey yield in the study area. This results is comparable to Tewodros Alemu et al. (2017) [32] result, who stated that hive productivity trend has increased from 2011 to 2014 in Sekota district. Honey yield in modern hives (zander) and transitional hives (Kenya top bar) was increasing from 2011 to 2014
According to the survey result, traditional, transitional and frame hives showed a very significant difference in honey yield at (p<0.05). Over all mean amount of honey yield from traditional, transitional and movable frame hives were 5.74±0.17 kg, 11.37±0.25 kg and 18.32±0.64 kg per annum respectively (Table 6). This result comparable with results of Welay Kiros and Teklebirhan Tsegaye (2017) who showed that honey yield from traditional hive was significantly lower than transitional and frame hives. Similarly Atsbaha Hailemariam et al. (2015) [6] also explained that there was significant difference between traditional (12.79 kg) and frame (28.29 kg) hives in his study area. Moreover, productivity of frame and transitional hives in this study were much higher than that of the traditional hives. This is due to the fact that transitional and frame hives did get better management such as provision of wax foundation sheets, recycling of harvested combs and higher frequency of honey harvesting. In addition, the variation in productivity of traditional, transitional and frame hive might be attributed to the suitability of the improved hives to improved management.
| Total sample size (N=80) | — | — | — | — | — | — | — | — | — |
|---|---|---|---|---|---|---|---|---|---|
| Type of hive | Shebedino(N=30) | Hula (N=20) | Loka Abaya(N=30) | Over all | |||||
| Range | Mean± SE | Range | Mean± SE | Range | Mean± SE | Range | Mean± SE | ||
| Traditional | 3-8 | 5.37±0.16 | 2-7 | 5.36±0.20 | 3-8 | 5.67±0.15 | 2-8 | 5.47±0.17a | |
| Transitional | 8-15 | 11.24±0.26 | 8-14 | 11.83±0.27 | 9-15 | 11.04±0.23 | 8-15 | 11.37±0.25b | |
| MF | 10-30 | 18.82±0.82 | 10-25 | 17.29±0.48 | 14-30 | 18.87±0.62 | 10-30 | 18.32±0.64c |
Table text extracted from the original PDF; superscript letters are shown inline. The original table image is below.
View original table image
Major agricultural constraints in the study area
Agriculture, not only in the study area but also in nationwide is facing various constraints in its major components (crop production, livestock production and beekeeping). More specifically, shortage of cropland, drought, disease and parasite, lack of inputs, lack of draft animals, availability of different weeds and low soil fertility in crop production (Table 8) and shortage of animal feeds, shortage of grazing land, prevalence of various diseases and low productivity of local animals in livestock production (Table 8), were the majorly identified agricultural culprits in the study area. Similar to the other components of agriculture, beekeeping has been explained to receive various constraints hindering honey production. Accordingly, respondents in this study have clearly identified that, random use of agro-chemicals (15.63%), presence of pests and predators (15.27%), high rate of absconding (14.54%), increased cost of production (14.36%), lack of bee forage plants (14%) and drought (13.45%) were the major constraints in beekeeping (Table 7). Even if their level of importance varied from place to place, miss use of agro-chemicals ranked first as an important constraint in honeybee production system, which was negatively affecting colony productivity in the study area. This finding agrees with results suggested by Gidey Yirga and Kibrom Ftwi (2010) [15] , Dereje Shibru et al. (2016) [10] , Teklu Gebertadik and Dinku Negash (2016) [29] , who identified agrochemicals, poisonous as the first important constraint mentioned as reasons for hive productivity and colony population decline in different parts of the country.
| Constraints | Respondents rank (n=80) | — | — | — | — | — | — | — | — |
|---|---|---|---|---|---|---|---|---|---|
| 1st | 2nd | 3rd | 4th | 5th | 6th | 7th | Percentage | Rank | |
| Agro-chemicals | 9 | 5 | 21 | 5 | 13 | 15 | 18 | 15.63% | 1st |
| Poisonous plants | 11 | 23 | 16 | 23 | 7 | 2 | 2 | 15.27% | 2nd |
| Absconding | 5 | 9 | 13 | 14 | 18 | 11 | 10 | 14.54% | 3rd |
| Increase production cost | 6 | 10 | 4 | 12 | 10 | 14 | 23 | 14.36% | 4th |
| Shortage of bee forage | 9 | 20 | 11 | 21 | 4 | 7 | 5 | 14% | 5th |
| Drought | 38 | 13 | 15 | 4 | 3 | 1 | 0 | 13.45% | 6th |
| Pest and predators | 2 | 0 | 0 | 1 | 15 | 30 | 22 | 12.7% | 7th |
Table text extracted from the original PDF; superscript letters are shown inline. The original table image is below.
View original table image
| Major crop constraint | Farming category | — |
|---|---|---|
| Beekeepers (%) | Non beekeepers (%) | |
| Shortage of farm land | 38 (47.5) | 23 (28.75) |
| Drought | 15 (18.75) | 17 (21.25) |
| Shortage of oxen | 10 (12.5) | 9 (11.25) |
| Soil fertility | 3 (3.75) | 8 (10) |
| Input | 2 (2.5) | 9 (11.25) |
| Weed | 5 (6.25) | 5 (6.25) |
| Pest | 4 (5) | 1 (1.2) |
| Disease | 1 (1.25) | 3 (3.75) |
| Rodent | 2 (2.5) | 5 (6.25) |
| Livestock production constraints | ||
| Shortage of animal feeds | 35 (43.75) | 43 (53.75) |
| Shortage of grazing land | 29 (25) | 25 (31.25) |
| Diseases | 11(13.75) | 9 (11.25) |
| Shortage of improved breeds | 5 (6.25) | 3 (3.75) |
Table text extracted from the original PDF; superscript letters are shown inline. The original table image is below.
View original table image
Honeybee plant species and their availability 3.4.1. Honeybee flora trends in the study area
Majority of the respondents (90%) confirmed that honeybee forage is decreasing from time to time (Fig 5). Whereas, 6.25% and 3.75% of the respondents explained that honeybee forage availability did not change and increased in the last years respectively. According to the respondents, agrochemicals application and deforestation were undesirable effects on honeybee forages and the main reason for the decline of honeybee forage. This result is in line with findings of (Amssalu Bezabeh et al., 2012; Sintayehu Fetene 2016) [4,27] who showed that decrease in honeybee forage resources is recognized to be due to deforestation and agrochemical application for various purposes. In general, honeybees are facing shortage of forages associated with seasonal variation and resulted in low production and productivity. 9). However, it has been explained also that honeybees are exposed to agrochemicals poisoning, as these plants are dependent on chemical application. This finding is in line with the general facts that considerable numbers of honeybees are killed when bee forage plants are sprayed with agro-chemicals during flowering (Mark and Libby, 2003; US EPA, 2017) [26,33] . Though availability of supplementing seasonal bee forages could result in higher honey production, there was limited number of bee forage plants during times of dearth. Moreover, bee forage development and improvement, in the study area, except in watersheds/closure areas, is too minimal. The followings are the major bee plants available in the study area with flowering periods as indicated by respondents. 10). This result indicated that majority of the beekeeping farmers had the knowledge on honeybee poisoning plants in the study area. However, all of the beekeeping farmers confirmed that they do not know how to differentiate the types of honey made from poisonous plants. Moreover, 87.5% and 97.5% of the respondents did not have information on the effects of poisonous plants on other animals in addition to honeybees and the importance of these plants in the local conditions respectively (Table 10). This implied that the majority of the beekeepers in the study area did not have any information on the general backgrounds of these poisoning plants other than their toxicity to honeybees. [20] and Abebe Mitike (2017) [1] 13). However, leaves, seeds, and fruits of poisonous plants were not identified as a source of toxic substances to honeybees. On the other hand, Kerealm ejigu et al. 2009 [23,24] reported that whole parts of Datura metal Linn were toxic to livestock. Wise management or clearing of these identified poisonous plants during flowering and most active periods around apiaries and development of other potential nonpoisonous bee forage plants have been suggested as an option to prevent or minimize the side effects in the study area.
| Respondent perception | Yes | No | Unknown |
|---|---|---|---|
| Is there any poisonous honeybee floral species in your area? | 75(93.75%) | 5(6.25%) | - |
| Are there any consumers’ preferences on the types of honey sourced from poisonous plants? | - | - | 80(100%) |
| Do they have impacts on other animals; despite Honeybees and /or human beings? | 10(12.5%) | 70(87.5%) | - |
| Despite poisoning effects, do they have any other importance locally? | 2(2.5%) | 78(97.5%) | - |
Table text extracted from the original PDF; superscript letters are shown inline. The original table image is below.
View original table image
Respondents' practice in Agro-chemicals application 3.5.1. Purpose of Agro-chemicals application
According to the respondents, 93.75%, 78.12% and 59.37% of them were using agro-chemicals for the control of pests, for the control of weeds in their farmland and for the control of fungi/rust respectively. According to the result, majority of the respondents were using agro-chemicals for control of crop pests (Fig 7). This results agrees with Kalayou Hiluf and Amare Ayalew (2016) [22] who have reported that about 93.26%, 89.93% and 37.5% chemical application in Amhara region was for the control of weeds, pests and fungi respectively.
Respondents' utilization of Agro-chemicals
The result indicates that 75% of beekeepers and 87.5% of non-beekeepers had used agro-chemicals in the study area respectively (Table 13). It was expected that beekeepers had more information on toxicity of agro-chemicals to honeybees than non-beekeepers, our statistical analysis confirmed that there is no significant difference between beekeepers and nonbeekeepers in agro-chemicals utilization at p<0.05 (X 2 = 0.068). Surprisingly, it was found that beekeepers aware of the toxic effects of agro-chemicals on honeybees due to various reasons being household labor shortage and higher prevalence of pests and parasites were the major ones. In fact that, enables the adult labor to engage in income generating on off farm activities and children for schooling. Actually, this result is in line with Fikre Lemessa et al. (2016) [13] who stated that the use of agro-chemicals were an assistance to eliminate labor cost and adult engaged to other off farm activities instead of labor intensive control of crop weeds, pests and diseases.
| Respondents category | Do you use agro-chemicals? | — | X2 (p-value) |
|---|---|---|---|
| Yes | No | ||
| Beekeepers | 60(75%) | 20(25%) | 0.068 |
| Non beekeepers | 70(87.5%) | 10(12.5%) | |
| Total | 130(81.2%) | 30(18.8%) |
Table text extracted from the original PDF; superscript letters are shown inline. The original table image is below.
View original table image
Types and amount of agro-chemicals used by respondents
The types of agro-chemicals used by the respondents in the study area were Malathion50%, Agrothoate 40%, 2, 4-D, Diazinon 60%, Pyriban 48%, Manacozeb 80% and Pallas 45 OD. According to the data collected from respondents, 87.5% and 97.5% of the interviewed beekeepers and non beekeeprs respectively were using 2, 4-D for the control of weeds. Whereas 77.5% and 86.2% of beekeeping and nonbeekeeping respondents respectively were using Agrothoate 40% for the control of Ecto-parasite and different pests while 35% and 22.5% of beekeeping and non-beekeeping respondents were Diazinon 60% used for different purpose respectively and Pallas 45 OD (57.5% and 61.2% of the beekeeping and non-beekeeping respondents) respectively were the least used agro-chemicals in the study area (Table 14).This result corresponds to the findings of Guesh Godifey (2015) [17] and Dawit Melisie et al. (2016) [9] who indicated that 2, 4-D, Agrothoat40%, Malathion50% and Mancozeb 80% were the major agro-chemicals used in different parts of Ethiopia. Moreover, statistical analysis did not show a significant difference between the beekeeping and nonbeekeeping respondents on the utilization of Agrothoat 40% at p<0.05 (X 2 =0.128). This is because of the reason that majority of the respondents in the study area are chat growers thereby they are using this agrochemical for the control of chat pest. However, the use of other agro-chemicals by respondents did show a significant difference among the beekeeping and non-beekeeping respondents. More specifically, 92.5% of the respondents used 2,4-D with an average dose of 1.11±0.016 liters per hectare (lit/ha) for weed control of teff and wheat. Agrothoate 40%, Pyriban 48%and Diazinon 60% were used at the rate of 1.16±0.02lit/ha,1.29±0.029 lit/ha, 1.07±0.014 lit/ha respectively for the control of Aphides, Termite and African ball worms on Chat, tomato, paper, cabbage and maize. Similarly, respondents were using 1.2±0.022 lit/ha of Malathion 50% for the control of Chat, tomato, onion and cabbage pests and diseases. Manacozeb 80% at the rate of 1.19±0.023lit/ha was used to treat late blight and powdery mildew of wheat, tomato and potato. Further, Pallas 45 OD at the rate of 1.05±0.012 lit/ha was used by the respondents for the control of teff and wheat grass weeds (Table 15). However, it has been observed that all the rates used during the application of agro-chemicals for the control of crop weeds, pests and diseases were out of the recommended doses for each of the chemicals. In this case, it is clear that how much side effects that they could cause to non-target organisms including honeybees and our environment. Moreover, application of agro-chemicals below the recommended dose may lead to the development of resistant crop pest and disease strains and the chemical may not be as effective as expected to control the target. Our result is also with the same scenario with the findings of Dawit Melisie et al. (2016) [9] , who have reported that most farmers in Adami Tulu district of Oromia region were applying insecticides out of the recommended rate.
| Type of agro-chemicals | Frequency (%) | Mean ±SE | Type of crops | Used for the control of: |
|---|---|---|---|---|
| 2, 4-D | 148(92.5%) | 1.11±0.016 | Wheat and Teff | Broad leaf weeds |
| Agrothoate 40% | 131(81.87%) | 1.16±0.021 | Chat, tomato, paper and cabbage and maize | Aphides and African ball worms |
| Malathion 50% | 134(83.5%) | 1.2±0.022 | Chat, tomato, onion and cabbage | Any worms |
| Pyriban 48% | 116(72.5%) | 1.29±0.029 | onion and cabbage | Bollworms and insects |
| Mancozeb 80% | 82(51.25%) | 1.19±0.023 | Wheat, Tomato and potato | Late blight, leaf spot and Downey mildew |
| Diazinon 60% | 74(46.25%) | 1.07±0.014 | Teffe and maize | Termite and ball worms |
| Pallas 45 OD | 67(41.87%) | 1.05±0.012 | Wheat and Teff | Any grass species |
Table text extracted from the original PDF; superscript letters are shown inline. The original table image is below.
View original table image
| Types of agro-chemicals | Agro-chemicals utilization | — | — | — | X2 (p-value) |
|---|---|---|---|---|---|
| Beekeepers | Non beekeepers | ||||
| N | % | N | % | ||
| 2,4-D | 70 | 87.5 | 78 | 97.5 | 0.036 |
| Agrothoate 40% | 62 | 77.5 | 69 | 86.2 | 0.128 |
| Malathion50% | 58 | 72.5 | 76 | 95 | 0.000 |
| Pyriban48% | 51 | 63.8 | 65 | 81.2 | 0.007 |
| Mancozeb80% | 31 | 38.8 | 51 | 63.8 | 0.003 |
| Diazinon60% | 28 | 35 | 46 | 57.5 | 0.021 |
| Pallas 45 OD | 18 | 22.5 | 49 | 61.2 | 0.000 |
Table text extracted from the original PDF; superscript letters are shown inline. The original table image is below.
View original table image
Trends of agrochemical use in the study area
Respondents pointed out that application of agro-chemicals has increased through time. Accordingly, the data revealed that application of 2,4-D, Agrothoate 40%, Malathion 50%, Pyriban 48%, Mancozeb 80%, Diazinon 60% and Pallas 45 OD has increased through years 2013 to 2017 (Fig. 6). This implied that the use of agro-chemicals in the study area has become a common practice among the beekeeping and nonbeekeeping respondents. This was supported by established good linear regression between number of respondents using agro-chemicals and period at R 2 = 0.834 (Fig 8). This relationship has also revealed the presence of positive and significant relationship between engagement in off farm activities and intensity of agrochemical use in the study area. This result was also in line with suggestions summarized by Jorge et al. (2009) [21] who have explained that nominal expenditures on agro-chemicals increased steadily for most of the last half century worldwide. However, intensity of agrochemical use has declined during year 2015 due to low pest prevalence in the area in which occurrence of Elino was pinpointed as a major reason.
Sources of agro-chemicals
All the respondents were found to purchase agro-chemicals from various sources. Accordingly, 68.8% and 31.3% of the respondents confirmed that cooperatives and legal traders were potential sources of 2,4-D respectively. Similarly, Agrothoate 40%, Malathion 50%, Pyriban 48%, Mancozeb 80%, Diazinon 60% and Pallas 45 OD were found to be sourced from cooperatives and legal traders (Fig 9). However, it has been revealed that 15% of the respondents used Malathion50% obtained from illegal traders. The major reason behind the illegal distribution Malathion50% has been found that there are few numbers of licensed traders and cooperatives that are inaccessible to most of the agrochemical users in the study area. It has been also indicated that agro-chemicals are found illegally from open markets, shops, veterinary pharmacies and retailing farmers. This result is also in line with the findings of Kalayou Hiluf and Amare Ayalew (2015) [22] and Fikre Lemessa (2016) [13] who showed that most farmers are purchasing their agro-chemicals from open markets and unlicensed vendors or individuals. Moreover, purchasing of agro-chemicals from illegal sources could not ensure the user that agro-chemicals are genuine products, effective against targets and to raise any compliant on the seller if something undesirable happened upon use. At this point, it is remarkable to note that respondents did not worry about side effects of agrochemical use rather their accessibilities in the study area. In this condition, it is very easy to understand that honeybees will receive bigger chance to be poisoned due to irregular time of applications practiced by respondents. This result is partially in line with findings of Sintayehu Fetene (2016) [27] who indicated that farmers apply Agro-chemicals at different time of the day and overlapped with the active foraging time of the honeybees. Farmers are serving as the main unit of agrochemical application. Hence, the degree of awareness on agrochemical utilization inherently affects their methods of application which could generate considerable amount of agrochemical use ultimately to influence the health of honeybees. In this study, all the respondents were aware of the fact that agrochemicals are useful not only for the control of crop pests but also causes environmental pollution. Furthermore, the data confirmed that 78.1% of the respondents do consider the fact that agro-chemicals could kill non-target organisms like honeybees. They further declared that agro-chemicals could directly and indirectly affect the wellbeing of the honeybees. Similarly, different authors reported that the decline of honeybees due to agrochemical effects on honeybees and plants that have useful function in the ecosystem in general and forage plants for bee in particular (Tadesse Amera and Asferachew Abate, 2008; Asamnew Tassew and Maria, 2016) [28, 5] . This clearly indicates that even though, the farmers are aware of adverse effects of the agro-chemicals on the honeybees, they continued to use agro-chemicals without taking care of the side effects to minimize the death of honeybees. As regards to storage and handling of agrochemicals before and after use, 90.62% of the respondents confirmed that agrochemical containers are hanged inside their homes and only 6.25%of them are keeping agrochemicals safely out of reach. Shockingly, 3.12% of the respondents are keeping the agro-chemicals with their foodstuffs irregularly at home. Even though proper storage or disposal of empty agrochemical is one of the most important component in the safe use of agro-chemicals, 76.25%, 11.25% and 9.37% of the respondents confirmed that they are using the chemicals even if they are not needed, used them for unintended application and they dispose them anywhere on the ground respectively (Table 16). It is clear that this practice is not proper in the management of agro-chemicals and their ruminants as it could increase humans, animals and the environment exposure to the undesired effects of agrochemicals. In general, we found that this result is in consistent with findings of Govinda (2014) [16] , Fikre Lemessa et al.
| Variables | N | Percentage |
|---|---|---|
| Adverse effects of agro-chemicals | ||
| Environment pollution | 160 | 100 |
| Killing non-target species | 125 | 78.1 |
| Agro-chemicals storage practice | ||
| Hanging inside the house | 145 | 90.62 |
| Locked up in safe place | 5 | 3.12 |
| Along with food stuff | 10 | 6.25 |
| Left over Agro-chemicals solution | ||
| Stored and used for another application | 18 | 11.25 |
| Pour in to bushes, rivers/stream | 3 | 1.87 |
| Sell it to other farmers | 2 | 1.25 |
| Apply even though it is not needed | 122 | 76.25 |
| Disposed on the soil | 15 | 9.37 |
| Disposal of empty Agro-chemicals containers | ||
| Use them for house hold purpose | 152 | 95 |
| Buried | - | - |
| Left in the farm | 6 | 3.75 |
| Burnt | 2 | 1.25 |
| Do you use protective clothes while spraying agro-chemicals | ||
| Yes | 7 | 4.38 |
| No | 153 | 95.62 |
| Health impacts | ||
| yes | 147 | 91.9 |
| No | 13 | 8.1 |
| Training on use of Agro-chemicals | ||
| Yes | 32 | 20 |
| No | 128 | 80 |
| Following the labeled instructions of the Agro-chemicals | ||
| Yes | 4 | 2.25 |
| No | 156 | 97.5 |
Table text extracted from the original PDF; superscript letters are shown inline. The original table image is below.
View original table image
(2016) [13] and Hailay Abrha et al. (2016) [19] . However, it is wise to suggest that proper management of agro-chemicals before and after application could increase efficiency of treatments, quality life to humans and the environment, and decrease chance of non-target organisms to be exposed and affected by toxic elements.
Regarding to the management of empty agrochemical containers, we have found that 95%, 3.25% and 1.25% of the respondents indicated that they are using them for household purposes, left them anywhere in the farmland they burn them out respectively (Fig 17). However, it was confirmed that no one has buried empty agrochemical containers with their leftovers properly as instructed. On the other hand, the survey data revealed that most respondents (95.62%) did not know the use of protection and did not use protective clothes during agrochemical application (Table 16). Furthermore; about 80% of the respondents never get trainings on how to use and importance of protection during application. In this regard, key informants of this study also witnessed that they have never received any instruction from either agrochemical suppliers or extension people on the how to use and why to use protective clothes during application. Consequently, it was, thus, confirmed that almost all (97.5%) of the respondents have never followed instructions during agrochemical application. Regarding undesirable effects of agro-chemicals on honeybees and their produce, all respondents (80) have been affected negatively and have lost a total of 1556kg of honey with an average loss of 19.45±4.0 kg honey per beekeeper per year due to improper application of agro-chemicals (Table18). Consequently, analysis of financial loss incurred indicated that respondents have lost 93360 ETB with an average of 1167±245.42 ETB per beekeeper.
| Factors | Number of respondents | Sum | Mean | Std. Deviation |
|---|---|---|---|---|
| Honey loss | 80 | 1556 | 19.45 | 4.09 |
| financial loss (ETB) | 80 | 93360 | 1167 | 245.42 |
Table text extracted from the original PDF; superscript letters are shown inline. The original table image is below.
View original table image
Conclusion and Recommendation
In conclusion, the results of the present study show that poisons plants and chemical toxicities were among key causes of honeybee health problems in Sidama zone, SNNPR, Ethiopia. A total of ten plants were reported as having poisoning effect on honeybees by beekeepers in the study area. Among these plants Lanthana camara, Euphorbia cotinifolia, Clematis flammula, Ranclus multifides, Discopdium penninervium, Climatisinte grifolia, Ddatura metal linn, Sesbania sesban, Phytolaca americana and Justitia schemperina were the most commonly incriminated toxic plants. Similarly, agro-chemicals are considered as a powerful weapon or magic bullets in the study area in order to enhance the agriculture productivity. The utilization of agrochemicals is increasing from time to time and mainly used to control weeds, pests, and diseases of crops and animals.
Common agro-chemicals use in sidama zone was 2,4-D, Agrotheote40%, Malathion80%, Pyriban48%, Diazinone60%, Macozeb80% and Pallas 45 OD. It was expected that beekeepers had more information on toxicity of agrochemicals to honeybees than non-beekeepers, but, there is no difference between beekeepers and non-beekeepers in agrochemicals utilization in the study area. These agro-chemicals were illegal traded and available in open market, in shops along with food and other consumable items and veterinary drugs. Non beekeepers and beekeepers had no or little access to advices on how to use and handle the agro-chemicals. They stored left over agro-chemicals and empty agro-chemical containers with consumable items at home. Farmers were not following the instructions for application of agro-chemicals and they have been seen using over or under doses for application at any time they wanted. As the result of the improper use of agro-chemicals, honeybees were adversely affected. Decline of honeybee colonies and honey production have been registered due to various reasons of which agrochemicals top in the listed.
According to the result of this study some of the suggested issues that require consideration by beekeepers and any development organizations are high lightened below: Creating awareness of the season of most poisonous plants are growing and cause problem on bee health. Experimental studies should be carried out to confirm the empirical knowledge of plant poisoning on honeybee. Advise farmers to avoid the application of bee toxic agro-chemicals on blooming plants and it is a good idea to check for the presence of other blooming plants which might attract bees. A clear mechanism of working and chain of communication among institutions is very important to minimize the prevailing risk impose by improper use of agro-chemicals. The integrated efforts are very important to educate farmers on proper agro-chemical handling, management, utilization, appropriate safety precautions, effects of pesticide on honeybee health and Integrated Pest Management (IPM)
Acknowledgement
AcknowledgementThe authors would like to acknowledge South Agricultural Research Institute for the financial support.
Figures and tables from the paper
| Total sample size (N=160) | — | — | — | — | — | — | — | — |
|---|---|---|---|---|---|---|---|---|
| Variables | Shebedino(N=60) | Hula (N=40) | Loka Abaya(N=60) | Over all | ||||
| Range | Mean±SE | Range | Mean±SE | Range | Mean±SE | Range | Mean±SE | |
| Family size | 2-8 | 5.2±0.23 | 3-9 | 5.85±0.26 | 2-9 | 5.9±0.22 | 2-9 | 5.6±0.13 |
| Total land holding | 0.5-3 | 1.15±0.09 | 0.5-2 | 1.52±0.15 | 0.5-3 | 1.65±0.12 | 0.5-3 | 1.43±0.07 |
Table text extracted from the original PDF; superscript letters are shown inline. The original table image is below.
View original table image
| Farming activity | Bee keepers | — | — | — | Non beekeepers | — | — | — |
|---|---|---|---|---|---|---|---|---|
| 1st | 2nd | 3rd | Rank index | 1st | 2nd | 3rd | Rank index | |
| Crop production | 26 | 22 | 34 | 0.35(1st) | 80 | 0 | 0 | 0.52(1st) |
| Livestock production | 7 | 44 | 29 | 0.32(3rd) | 0 | 75 | 0 | 0.48(2nd) |
| Bee keeping | 47 | 14 | 18 | 0.33(2nd) | 0 | 0 | 0 | 0(3rd) |
Table text extracted from the original PDF; superscript letters are shown inline. The original table image is below.
View original table image
| Sources of honeybee colonies | Percentage of respondents |
|---|---|
| Catching swarms | 92.5% |
| Gift from Parents | 7.5% |
| Purchasing | - |
| Total (N=80) | 100% |
Table text extracted from the original PDF; superscript letters are shown inline. The original table image is below.
View original table image
| Local name (In Sidamigna) | Common Name | Scientific Names | Flowering periods | Number of days on flowering | Potential source (pollen/nectar) |
|---|---|---|---|---|---|
| Buna | Buna | Coffee Arabica | January-February | Ten days | Nectar |
| Abukato | Avocado | Persea America | Sept-Dec | Twenty five days | Pollen and nectar |
| Mango | Mango | Mangifra indica | Sept-Dec | Fifteen days | Pollen |
| Wahe | Soy bean | Glycine max | September | Ten days | Pollen |
| Denicha | Dinich | Solanum tuberosum | August- Sept | Ten days | Pollen and nectar |
| Badala | Bokolo | Zea mays | Jun –August | Fifteen days | Pollen |
| Baqela | Bakela | Vacia foba | Sept-October | ten days | Pollen |
| Timatie | Timatim | Lycopersicon esculentum | year round | Five days | Pollen and nectar |
| Atara | Ater | Pisum sativum | Sept-October | Ten days | Pollen |
| Lome | Lomi | Citrus limon | Sept –October | Twenty days | Pollen and nectar |
| Papaya | Papay | Carica papaya | Sept-Nov | Twenty day | Pollen and nectar |
| Chate | chat | Catha edulis | Year round | Fifteen days | Pollen |
Table text extracted from the original PDF; superscript letters are shown inline. The original table image is below.
View original table image
| Local name (In Sidamigna) | Scientific name | Flowering period | Symptom |
|---|---|---|---|
| Che’atyguma | Lanthana camara | Year round | Paralysis |
| Du’emo | Euphorbia cotinifolia | Early summer | increased defensiveness |
| Tolchoomy | Clematis flammula | January | Dead honeybees in front of the hives, |
| Beetibetoo | Ranclus multifides | August - February | Lack of foraging |
| Laalunity | Discopdium penninervium | January | Lack of foraging and Repellent |
| Fiidee | Climatisinte grifolia | January | Lack of foraging and Repellent |
| Booriborich | Ddatura metal linn | July - October | Increased defensiveness |
| Taasfanii | Sesbania sesban | June | Lack of foraging |
| Raafoo | Phytolaca americana | December–February | Dead honeybees in front of the hives |
| Seensele | Justitia schemperina | November | Increased defensiveness |
Table text extracted from the original PDF; superscript letters are shown inline. The original table image is below.
View original table image
References
34 in the original paper- Abebe Mitikie. Characterization of beekeeping systems and evaluation of honey quality in Tehulederie District of the South Wollo Zone, MSc. Thesis, Amhara Region, Ethiopia, 2017.
- Abera Dereje. Survey of Toxic Plants in Livestock at Horro Gudurru Wollega Zone, Journal of Biology, Agriculture and Healthcare. 2015;5:12-33.
- Addis Getu, Maleda Birhane. Chemical analysis of honey and major honey production challenges in and around Gonder, Ethiopia. Aca. J. Nut. 2014;3(1).
- Amssalu Bezabeh, Alemayehu Gela, Taye Negera, Desalegn Begna. Toxicity effects of commonly used Agro chemicals to Ethiopian Honeybees, Ethiopian Journal of Animal Production. 2012;12:1-14.
- Asaminew Tassew, Maria W. Beekeeping dynamics and its driving forces of change in Ethiopian mixed farming system. Department of Animal Production and technology, College of Agriculture and Environmental Sciences, Bahir Dar University, Ethiopian. 2016;28:12.
- Atsbaha Hailemariam, Taye Tolemariam, Kebede Debele. Assessment of honey production system, constraints and opportunities in three selected Woredas of Tigray, Basic Research Journal. 2015;4:304-315.
- Bekele Tesfay. Beekeeping practices, factors affecting production, quality of honey and beeswax in bale zone, Oromia region. African Journal of Rural Development. 2015;2(2):88.
- Challa Kinate. Honey production, Marketing and Quality assessment in Gomma woreda, Southwestern, Ethiopia. Basic Research Journal of Agricultural Science and. 2010;4(10):304-315.
- Dawit Melisie, Tebkew Damte, Ashok K. Farmers insecticide use practice and its effect on honeybees (Apis mellifera) foraging on onion flower in Adami Tullu district. Glob. J Pests Dis. Crop Prot. 2016;4:139-145.
- Dereje Shibru, Getahun Asebe, Emana Megersa. Identifying opportunities and constraints of beekeeping: the case of Gambella Zuria and Godere Weredas, Gambella Regional State, Ethiopia. Entomol Ornithol Herpetol. 2016;5:2-6.
- Desalegn Begna. Assessment of pesticides use and its economic impact on the apiculture subsector in selected districts of Amhara Region, Ethiopia, Holeta, Ethiopia. Journal of Environmental Annual Toxicology. 2015;5:267.
- FEPA. Environmental Impact Assessment Guideline on agro-chemicals. Addis Ababa, Ethiopia, 2004.
- Fikre Lemessa, Fikadu Mitiku, Gezahegn Berecha, Adugna Eneyew. Smallholder farmers' knowledge, perception and practice in pesticide use in South Western Ethiopia. JAEID. 2016;110:307-323.
- Gezahegne Tadesse. Beekeeping (in Amaharic), Mega Printer Enterprise, Addis Ababa, Ethiopia, 2001.
- Gidey Yirga, Kibrom Ftwi. Beekeeping for rural development: its potentiality and constraints in Eastern Tigray, Northern Ethiopia. Agri J. 2010;5:201-204.
- Govinda B. An Overview of agro-chemicals and Their Effects on Environment in Nepal, Journal of Agriculture and environment. 2014;6:45-90.
- Guesh Godifey. Epidemiology of Honeybee Disease and Pests in Selected Zones of Tigray Region, Northern Ethiopia. MSc Thesis, Bahir Dar University,Ethiopia. 2015;95:12.
- Haftu Kebed, Gezu Tadess. Survey on honey production system, challenges and opportunities in selected areas of Hadiya zone, Ethiopia. 2014;6(6):60-66.
- Hailay Abrha, Kifle Woldemichael, Desalegn Massa, Lillian M. Farmers knowledge, attitudes, practices and health problems associated with pesticide use in rural irrigation villages, Southwest Ethiopia. PLoS ONE, 2016;11:1-13.
- Hailegebriel Tesfay. Honeybee Diseases, Pest and Their Economic Importance in Ethiopia. International Journal of Innovation and Scientific Research. 2014;10(2):527535.
- Jorge F, Richard N, Elizabeth N, Arthur G, Alexandre V. Assessing Recent Trends in Pesticide Use in U.S. Agriculture, Journal of Agricultural and Applied Economics. 2009;34(1):149-163.
- Kalayou Hiluf, Amare Ayalew. Assessment of pesticide use, practice and environmental effect on the small holder farmers in the northern shoa zone of Amhara regional state of Ethiopia 2016, 2.
- Kerealem Ejigu, Tilahun Gebeyehu, Preston TR. Constraints and prospects for apiculture research and development in Amhara region, Ethiopia. Liv. Res. Rural Dev. 2009;21:10.
- Kerealem Ejigu, Tilahun Gebeyehu, Preston TR. Constraints and prospects for apiculture research and development in Amhara region, Ethiopia.Liv. Res. Rural Dev. 2009;21:10.
- Malede Birhan. Livestock Resource Potential and Constraints in Somali Regional State, Ethiopia. Global Veterinaria. 2013;10(4):432-438.
- Mark F, Libby B. Bee Pesticide Poisoning Incidents in the United Kingdom. Wildlife Incident & Diagnostic Unit, Central Science Laboratory, Sand Hutton, York, Uk Bulletin Of Insectology. 2003;56:141-145.
- Sintayehu Fetene. Effects of herbicide application in wheat crops and on honeybee populations in Ethiopia. research report, feed the future, 2016, 36.
- Tadess Amare, Assferachew Abate. An assessment of the pesticide use, practice and hazards in the Ethiopian rift valley, 2008, 13.
- Teklu Gebretsadik, Dinku Negash. Honeybee Production System, Challenges and Opportunities in Selected Districts of Gedeo Zone, Southern Nation, Nationalities and Peoples Regional State, Ethiopia. International journal of research. 2016;4:12.
- Tessega Belie. Honey production and marketing systems, constraints and opportunities in Burie District of Amhara region, Ethiopia. A thesis submitted to the Department of Animal Science and Technology, School of Graduate Studies, Bahir Dar University, 2009.
- Tewodros Alemu, Eyassu Seifu, Amessalu Bezabih. Postharvest handling, opportunities and constraints to honey production in northern Ethiopia. Liv. Res. Rural Dev. 2015;27:5.
- Tewodros Alemu, Eyassu Seifu, Amessalu Bezabih. Honeybee production practices in Sekota district, northern Ethiopia,African Journal of Rural Development. 2017;2:263-275
- US EPA. Proposal to Protect Bees from Acutely Toxic agro-chemicals, 2015, 98.
- Wolaye Kiros, Teklberhan Tsegay. Honey-bee production practices and hive technology preferences in Jimma and Illubabor Zone of Oromiya Regional State, Ethiopia. 2017;9:31-43.