
Research article · 2020 · Full text
International Journal of Statistics and Applied MathematicsSensitivity analyses of population projection matrix of Cestrum aurantiacum
Volume 5(6) · Pages 43–47 · DOI: 10.22271/maths.2020.v5.i6a.612 ↗
Research areasEnvironmental Changes in ChinaSurvey Sampling and Estimation Techniques
Abstract
Author-writtenThe Lefkovitch stage specific matrix population models are divided into discrete stage classes defined by a growth variable such as size, height and diameter at breast height for trees. In matrix model, the deterministic matrix projection models are used to estimate growth rate, stable size distribution, reproductive values, and sensitivities of the growth rate to changes in vital rates. This study sampled five forest blocks (Kiptogot, Kimothon, Suam, Saboti and Kitale within Mt. Elgon forest ecosystem) and used stage base matrix models to estimate asymptotic growth rate, sensitivity and elasticity values of invasive tree population within the forest ecosystem. The result concludes that the dominant eigenvalue is more sensitive to transition probabilities from stage 2 (sapling) to stage 3 (Mature trees) stages of Cestrum aurantiacum than to transition probability of stage 1 (seedling) to stage 2 (sapling) and lower in fertility of the stage 3 (Mature trees). The results further shows that the growth parameters in the forest blocks shows that Kiptogot block had the largest elasticity values than the other blocks, indicating that the invasive tree growth survival probabilities had greatest impact on population growth.
Summary
Source-checkedPlain-language reading of the full paper, prepared with AI and checked against the text. Each point links to the authors' own words.
Why it matters
- Lefkovitch stage-specific matrix population models categorize trees into discrete classes based on growth variables like height, size, or diameter at breast height. View evidence ↗
- Deterministic matrix projection models are used to estimate key population metrics, including growth rates, reproductive values, and how growth rates respond to changes in vital rates. View evidence ↗
- The study focuses on the invasive tree species Cestrum aurantiacum across various ecologically distinct forest blocks. View evidence ↗
The question
- The research aims to estimate the asymptotic growth rate, sensitivity, and elasticity values of Cestrum aurantiacum populations within five forest blocks of the Mt. Elgon ecosystem. View evidence ↗
What they did
- The study was conducted in five forest blocks within the Mt. Elgon ecosystem: Kimothon, Kiptogot, Suam, Saboti, and Kitale. View evidence ↗
- The researchers calculated the dominant eigenvalue (asymptotic finite rate of increase), reproductive values, and stable stage distribution for each stage. View evidence ↗
- Sensitivity analysis for vital rates was performed using R software based on the computed population projection matrices. View evidence ↗
- Linear regression was used to visualize the relationship between elasticity estimates, forest blocks, and growth stages. View evidence ↗
What they found
- The most sensitive vital rates varied by block: Suam was most sensitive at G23 (4.38), while Kiptogot (2.988), Kitale (2.819), Saboti (2.462), and Kimothon (2.303) were most sensitive at G12. View evidence ↗
- The population's dominant eigenvalue is more sensitive to the transition from sapling (stage 2) to mature tree (stage 3) than to the transition from seedling (stage 1) to sapling, or to the fertility of mature trees. View evidence ↗
- Kiptogot block exhibited the largest elasticity values among all blocks, suggesting that survival probabilities in this area have the greatest impact on population growth. View evidence ↗
- Regression analysis showed that elasticity decreases as plants reach stage 3 in Kitale, Saboti, and Kimothon, but increases as they reach stage 3 in Suam and Kiptogot. View evidence ↗
What it means
- The authors recommend management efforts focus on decreasing the fecundity values of saplings and mature trees to control the invasive population. View evidence ↗
- Control efforts should target specific stages per block: stage 2 for Kitale, Kimothon, and Suam; stage 1 for Saboti; and stage 3 for Kiptogot. View evidence ↗
Visual summary
1 visualsIllustrations explain the paper; charts are replotted from the paper's own table values.
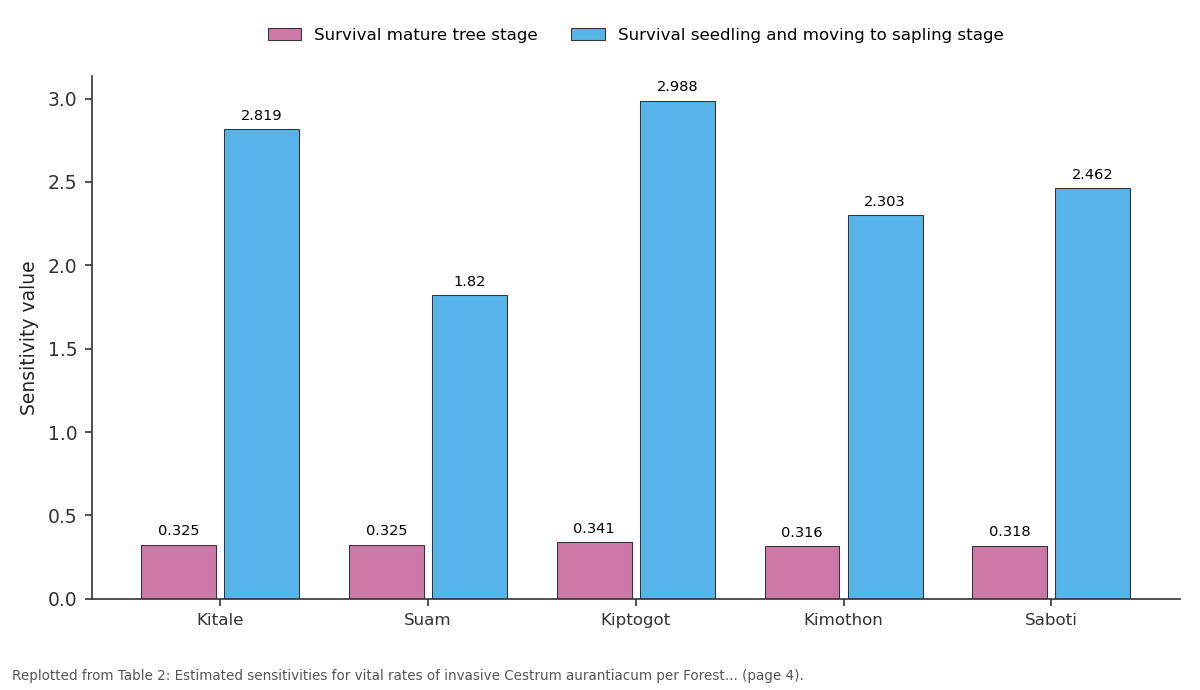
Survival mature tree stage and Survival seedling and moving to sapling stage: Kitale vs Suam vs Kiptogot vs Kimothon vs Saboti
Replotted from Table 2 (page 4) of the original paper. Every bar is the paper's own table value.
View source evidence ↗Figures & tables
From the original paper Table 1
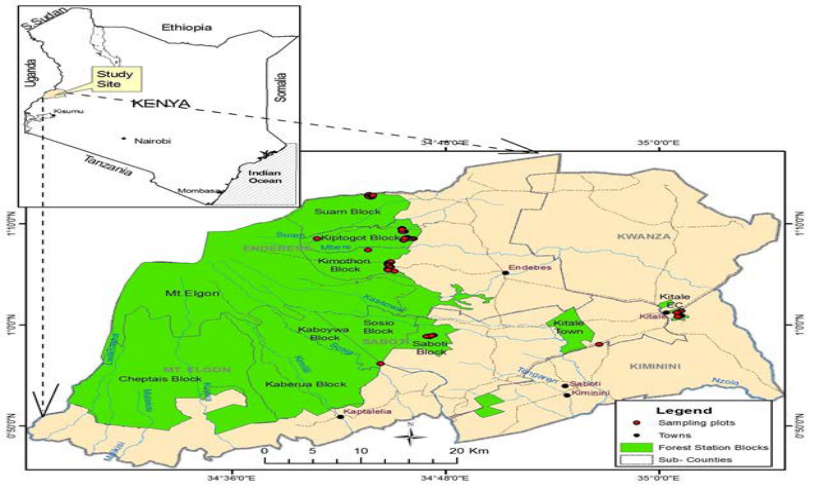 Figure 1
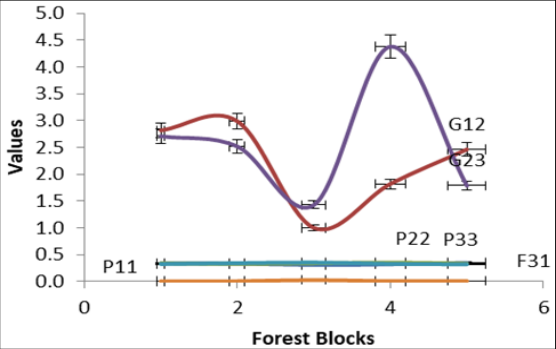 Figure 2
 Table 2
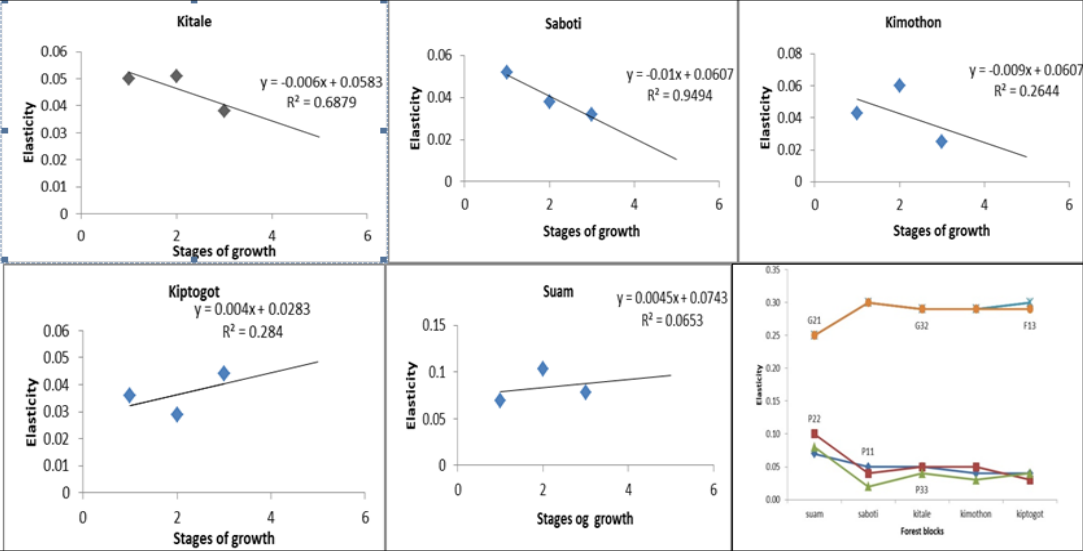 Figure 2
Introduction
The sensitivity analysis of is the effect of a small change in any matrix element in the projection matrix. The sensitivity denoted by ( to aij) is the effect of element in the i th row and j th column of that matrix, given mathematically by (Donovan and Welden (2002)) [8] as:
If L ij >0 is the projection matrix which is non-negative with a dominant eigenvalue , left eigenvectors v and right eigenvector u, then Lu= u. The sensitivity equation with minimal change on the projection matrix is as a result in perturbations of and of u, which satisfy the expression as outlined by Doak et al (1994) [7] below:
Expanding the products, and setting second order terms to zero, then we have:
When we multiply on the left by v T we obtain If the perturbation only affects one entry in the population projection matrix, for example a ij , of L, then we have:
Dividing both sides by a ij and taking the limit as gives the relationship:
The elasticity of the projection matrix is denoted and is defined from the projection matrix Lij as given by Caswell (2001) [2] : Elasticity analysis estimates the effect of proportional change in the vital rates on . The elasticity of a matrix element, , is the product of the sensitivity of a matrix element and the matrix element itself , divided by . Caswell (2011) [3] denotes elasticity analysis as a similar measure on a logarithmic scale used to estimate the proportional change in which results from a proportional change in element . In this paper we shall applied sensitivity analysis of the deterministic matrix models to make decisions about which vital rates to focus on in management and conservation efforts of invasive species. Hence through sensitivity analyses of the matrix models, we provide some insight into how best to manage an invasive tree population.
Literature Review
Crouse et al. (1987) [10] and Doak et al. (1994) [7] used sensitivity and elasticity analyses to rank alternative population management strategies. Silvertown et al. (1992) [22] applied sensitivity analysis to group species with similar life history strategies. Grant (1996) and Caswell (2001) [2] used sensitivity to estimate the selection pressures acting on different demographic rates. The Leslie (1945) [16] and Usher (1969) [23] applied sensitivity analysis of the deterministic matrix models to make decisions about which vital rates to focus on in management and conservation efforts. This study also applied sensitivity analysis of deterministic matrix models to make decisions about which stage of growth of invasive tress to focus on in management and control of the invasion within forest ecosystems to manage their population. Crooks and Soule (1999) [5] used matrix models to investigate how variation in the survival and fecundity of cheetahs (Acinonyx jubatus) in the Serengeti National Park in Tanzania might influence the persistence of the population. Their results suggested that juvenile survival had a relatively small impact on population growth rate compared to adult survival. They concluded that conservation efforts outside the park, targeted at reducing poaching of adult cheetahs, might be the most effective way of ensuring the persistence of the population within the Park. Cortes (2002) [6] used elasticity values from a wide range of shark species to show that populations of large, slow-growing, long-lived species were most vulnerable to changes in the survival of the juveniles (as opposed to the adults). Such a result suggests that management arrangements that protect juveniles (e.g. nursery area closures) would provide greater benefit to the population than those that protect adults as cited by Caswell (2001) [2] . The sensitivity analysis was also used by Morr, Shertzer and Rice (2011) [14] to determine that lionfish population growth ( ) sensitivity to parameters of projection matrix. The result indicates that the growth rate is very sensitive to lower-level mortality parameters of larval, juvenile, and adult mortality. However, the larvae have venomous spines, probably making them less appealing prey than many of the native reef fish. Edgar (2011) [11] indicated that the results of the analysis of sensitivity and elasticity indicate that an increase or decrease in either fertility or survival rates has an effect on the growth of a population, depending on the value of the dominant eigenvalue. The sensitivity of the growth rate factor to fertilities is found to be a decreasing function of age, for exponentially increasing populations. Haimei, Yanhong and Fujiwara (2013) [12] used sensitivity analysis to estimate the stages (s) with the most effect on population growth and effective conservation strategy of the rare endangered plant Davidi involucrata. They analyzed the dynamics and the contributions of life-history components on population dynamics based on Lefkovitch matrix model. Our study will estimate sensitivity and elasticity analysis of invasive tree (Cestrum aurantiacum) populations from differing forest blocks characterized ecologically.
Methodology
The sensitivity analysis was begun by construction of the projection of stage based matrix model for a stable stage distribution. The forest blocks were considered from Mt Elgon ecosystem were Kimothon, Kiptogot, Suam, Saboti and Kitale considered as affected by invasive trees (Mullah, 2011) [20] . The projection of the population system per block we developed and stable stage distribution and reproductive rate determined. We calculated the asymptotic finite rate of increase (dominant eigenvalue), stable stage distribution and reproductive values in each stage. The stable stage distribution is given by the right eigenvector u; and the reproductive values for the different stage classes, are given by the left eigenvector v. The reproductive value is the "worth" of individuals of different stage of growth in terms of future offspring they are destined to contribute to the next generation. Caswell (2001) [2] noted that the amount of reproduction per stage is the probability of surviving to realize it, and the time required for the offspring produced to enter into the reproductive value of a given stage of growth. The reproductive values are low at birth stages and increase towards the first stage of reproduction but decreases toward post-reproductive (Donovan and Welden, 2002) [8] . We then calculated sensitivity and elasticity of matrix elements using standard definitions based on the characteristic equation of the matrix (Caswell 2001) [2] , and then we later visualized the relationship between these estimates of elasticity per forest blocks and stage of growth by linear regression.
Results and Discussion
Results and Discussion
Projection matrix
The following is the projection matrix per forest block sampled and the corresponding eigenvalues is given in the Table 1 below.
| Matrix | Matrix=LKiptogot | — | — | Matrix=LKimothon | — | — | Matrix=LSuam | — | — | Matrix=LSaboti | — | — | Matrix=LKitale | — | — |
|---|---|---|---|---|---|---|---|---|---|---|---|---|---|---|---|
| Stage 1 | Stage 2 | Stage 3 | Stage 1 | Stage 2 | Stage 3 | Stage 1 | Stage 2 | Stage 3 | Stage 1 | Stage 2 | Stage 3 | Stage 1 | Stage 2 | Stage 3 | |
| Stage 1 | 0.52 | 0 | 292 | 0.02 | 0 | 38 | 0.62 | 0 | 166 | 0.53 | 0 | 126 | 0.6 | 0 | 237 |
| Stage 2 | 0.42 | 0.49 | 0 | 0.98 | 0.31 | 0 | 0.38 | 0.84 | 0 | 0.43 | 0.41 | 0 | 0.4 | 0.59 | 0 |
| Stage 3 | 0 | 0.57 | 0.63 | 0 | 0.69 | 0.44 | 0 | 0.17 | 0.68 | 0 | 0.59 | 0 | 0.41 | 0.46 |
Table text extracted from the original PDF; superscript letters are shown inline. The original table image is below.
View original table image
Sensitivity analysis
The sensitivity analysis for each vital rates were calculated using the R software from population projection matrix computed to help us determine the contributions of each transition (F ij , G ij and P ii ) to . Considering the various forest block sampled and their population projection matrix, we found that the most sensitive stages vital rates were for Kitale G 12 =2.819, Suam G 23 =4.38, Kiptogot G 12 =2.988, Kimothon G 12 = 2.303 and Saboti G 12 =2.462. Hence the sensitivity analysis is interpreted in light of the capacity for vital rates to change , thus for management of the invasive species it's key to manage these vital rates to stop the spread on increase invasion. Then if we change G 12 , by a small amount in the Kitale population projection matrix and hold the remaining matrix entries constant, the corresponding will change with a factor of 2.819. From the above results, we conclude that the dominant eigenvalue is more sensitive to transition probabilities of stage 2 (Sapling) to stage 3 (Mature stages) of cestrum aurantiacum than to transition probability of stage 1 (seedling) to stage 2 (sapling) and lower in fertility of the stage 3 (Mature trees). This shows the importance of sapling survivorship in determining future invasive tree population (Mullah et al. (2014)) [4] . Hence the sensitivity analysis is interpreted in light of the capacity for vital rates to change , thus for management of the invasive species it's key to manage these vital rates stop the spread on increase invasion.
Elasticity of vital rates
The parameters of population projection matrix are measured on different scales, thus it is helpful to calculate proportional effects of proportional perturbations called elasticity. The elasticity is sensitivities, weighted by transition probabilities. Elasticity are usually shown as point values for each vital rate, relating to proportional changes (rather than actual values) of and vital rate. Elasticity is the standard way to recalibrate sensitivity analysis to account for differences in the scale of measurement of different vital rates. Equal elasticity means that the same proportional change in two different vital rates would result in the same effect (the same proportional change) in . These elasticity proportion indicates the relative contribution of each matrix elements to per stage within each forest block sampled. Elasticity analyses revealed the differences in life stages between the forest block and ecological zones that most influence population structure ( ).
The elasticity for are Kitale (P 11 =0.052, means that a 1% increase in seedling survival will cause 0.052% increase in , Suam (P 11 = 0.069, means that a 1% increase in seedling survival will cause 0.069% increase in ), Kiptogot (P 11 = 0.036, means that a 1% increase in seedling survival will cause 0.036% increase in ), Kimothon (P 11 =0.043, means that a 1% increase in seedling survival will cause 0.043% increase in ) and lastly for Suam (P 11 = 0.052, means that a 1% increase in seedling survival will cause 0.052% increase in ). A regression analysis estimated the elasticity and stages of growth showing a negatively relation for Kitale (R²=0.6879), Saboti (R²= 0.9494) and Kimothon (R² = 0.2644) since as we move to stage 3 the elasticity decreases while positively in Suam (R² = 0.0653) and Kiptogot (R² = 0.284) since as the invasive plant grow to stage 3 the elasticity of the stages also grow.
Conclusion
The results obtained in this paper comprise a fairly complete perturbation analysis of deterministic population matrix linear demographic models. The management of invasive species needs to consider growth stages which are more sensitity in controlling the invasive species. Much consideration in the control of invasive species of trees within the forest should consider for Kitale stage 2 (0.051), Saboti stage 1 (0.052), Kiptogot stage 3 (0.044), Kimothon stage 2 (0.06) and Suam stage 2 (0.103). Thus we would recommend for management efforts that aim to decreasing saplings and mature trees fecundity values (i.e., more sapling and mature trees in the forest ecosystem will increase the population of invasive trees).
Acknowledgement
We are sincerely grateful to Kenya Forestry Research Institute's management for the financial support they accorded during the entire period of this work. We thank Mr. Dickens Adoyo for his their assistance during data collected.
Figures and tables from the paper
References
23 in the original paper- Bruce M, Shernock E. Stage Based Population Projection Matrices and Their Biological Applications, 2002, 13.
- Caswell H. Matrix population models: construc-tion, analysis and interpretation.2nd edn. Sunderland, MA, USA, Sinauer 2001;7:22.
- Caswell H, Neubert MG, Hunter CM. Demography and dispersal: invasion speeds and sensitivity analysis in periodic and stochastic environments. Theor Ecol 2011;4:407-421.
- Collins Jared, Amwatta Mullah et al., Community Invasibility and invasion by non-native Fraxinus pennyslvanica trees in adegraded tropical forest. Springer International Publishing Switzerland Biol Invasion 2014;16:2747-2755.
- Crooks K, Soule M. Mesopredator release and avi-faunal extinctions in afragmented system. Nature 1999;400:563566.
- Cortes E. Incorporating uncertainty into demographicmodeling: application to shark populations and their conservation. Conservation Biology 2002;16:1048-1062.
- Doak D, Kareiva P, Kleptetka B. Modeling pop-ulation viability for the desert tortoise in the western Mojave desert. Ecological 1994;4:446-460.
- Donovan TM, Welden C. Spreadsheet exercises in ecology and evolution. Sinauer Associates, Inc. Sunderland, MA, USA, 2002.
- Doubleday WG. Harvesting in matrix population models.Biometrics 1975;31:89-200.
- Deborah Crouse T, Larry Crowder B, Hal Caswell. A Stage -Based Population Model for Loggerhead Sea Turtles and Implications for conservation. Ecological Society of America 1987;68(5):1412-1423.
- Edgar Otumba O. On the Use of an Aggregated Matrix Model to Describe Population dynamics of migrating individuals. Intenational Journal of Mathematics achive 2011; 2(10).
- Haimei You, Yanhong Liu, Kazue Fujiwara. Effects of Life history compondents on population dynamics of the rare endagered plant Davidia involucrata. Natural Science 2013;5(1):62-70.
- Hartshorn GS. A matrix model of tree population dynamics. In Golley, F.B.; Medina, E. ed. Tropical ecological systems. New York, Springer Verlag, 1975, 41-51.
- James MA, Shertzer KW, James Rice A. A stage-based matrix population model of invasive lion_sh with implications for control. Biol Invasions 2011;13:7-12.
- Lefkovitch LP. The study of population growth in organizms grouped by stages, Biometrics 1965;21:1-18.
- Leslie PH. On the use of matrices in certain population mathematics, Biometrika 1945;33:183-212.
- Leslie PH. Some further notes on the use of matrices in population mathematics, Biometrika 1948;35:213-245.
- Lewis EG. On the generation and growth of a population. Sankhya 1942;6:93-96.
- Morris WF, Doak DF. Quantitative Conservation Biology: Theory and Practice of Population Viability Analysis. Sinauer Associates, Sunderland, Massachusetts, USA, 2003.
- Mullah Totland CJA, Klanderud K. Recovery of plant species richness and composition of an abandoned forest settlement area in Kenya. Rest. Ecol 2011;20:462{474}.
- Ojung'a SO, Nyakinda JO, Okuto E, Mullah JA. Invasive Species Population Status Modeling Using Stage Based Matrix: Mount Elgon Ecosystem. ISSN 2224-5804 (Paper) ISSN 2225-0522 (Online) DOI: 10.7176/MTM 2019;9:2.
- Silvertown J, Franco M, Mc Conway K. A demographic interpretation of Grime's triangle. Functional Ecology 1992;6:130-136.
- Usher MB. A matrix approach to the management of renewable resources with special reference to forest, J of Appl. Ecology 1966;3:355-367.