
Research article · 2022 · Full text
International Journal of Veterinary Sciences and Animal HusbandryAssessment and prioritization of potential domestic diseases of ruminants in selected areas of afar regional state, Samara, Ethiopia
Volume 7(1) · Pages 32–42 · DOI: 10.22271/veterinary.2022.v7.i1a.402 ↗
Research areasAnimal Disease Management and Epidemiology
Abstract
Author-writtenA cross sectional study was carried out from January to July 2014 GC in an attempt to assess and prioritize major domestic ruminants’ diseases and identify risk factors in the selected areas of Afar region. Livestock owners’ interview and retrospective data analysis were the study methods employed. Relevant collected data was organized and further analyzed using SPSS statistical tools at P< 0.05. Descriptive statistics was carried to determine frequencies of domestic ruminants’ diseases. Based on descriptive statistics, the study identified and prioritized 23, 22 and 21 cattle, goat and sheep diseases, respectively. Chi-Square analysis was computed to measure the degree of association between disease occurrence and risk factors (age, sex, study area and season). Binomial and multinomial logistic regression analyzes were computed at P
Summary
Source-checkedPlain-language reading of the full paper, prepared with AI and checked against the text. Each point links to the authors' own words.
Why it matters
- Livestock serves as the primary economic driver for pastoral communities, affecting their socio-political and cultural life. View evidence ↗
- Livestock diseases are a critical issue in lowland areas, where some studies suggest they cause over 50% of total animal mortality. View evidence ↗
- There is a lack of reliable, organized, and prioritized research data regarding livestock diseases in the region. View evidence ↗
The question
- The study aimed to identify and prioritize potential diseases in cattle and small ruminants and determine the risk factors associated with their occurrence. View evidence ↗
What they did
- A cross-sectional study was conducted between January and July 2014 in selected areas of the Afar region. View evidence ↗
- The researchers interviewed 144 livestock owners selected from three kebeles in three districts across Zone 1 and Zone 5. View evidence ↗
- The study analyzed five years of retrospective clinical data (2009-2013 GC) from six veterinary clinics. View evidence ↗
- Data from interviews and clinical records were analyzed using SPSS Version 15.0. View evidence ↗
What they found
- The study identified and prioritized 23 diseases in cattle, 22 in goats, and 21 in sheep. View evidence ↗
- The most frequent cattle diseases were Fasciolosis (10.38%), Pasteurellosis (10.16%), CBPP (9.93%), Ticks (9.26%), and Anthrax (8.80%). View evidence ↗
- For goats, Pasteurellosis and meange/agara were the most frequent (both 11.06%), followed by ticks (10.21%), CCPP (9.78%), and Fasciolosis (8.72%). View evidence ↗
- The leading sheep disease was Meange (Agara), followed by Pasteurellosis (12.1%), Fasciolosis (10.4%), and ticks (10.2%). View evidence ↗
- Age was a significant risk factor (p<0.05), with young ruminants being the most frequently affected, followed by older animals. View evidence ↗
- Sex significantly influenced disease occurrence (p<0.05), with female animals showing a higher frequency of disease than males. View evidence ↗
- Seasonality significantly affected disease occurrence, with the highest frequency in winter (Gielele), followed by summer (Kerma), spring (Sugum), and autumn (Hagay). View evidence ↗
- The specific kebele or pastoral village was not significantly associated with disease occurrence (P=0.783). View evidence ↗
What it means
- The authors recommend that the diseases identified in this study undergo confirmatory laboratory investigations. View evidence ↗
- The authors suggest launching extensive and ongoing epidemiological studies to further characterize ruminant diseases. View evidence ↗
- A limitation of the study is that the identified diseases lack laboratory-based confirmation and detailed epidemiological data. View evidence ↗
Visual summary
1 visualsIllustrations explain the paper; they do not show study data.
Risk Factor Influence Map
AI-generated conceptual illustration (Ethiopian ruminants (goats and sheep)). It explains the idea and does not show study data.
View source evidence ↗Figures & tables
From the original paper Table 1
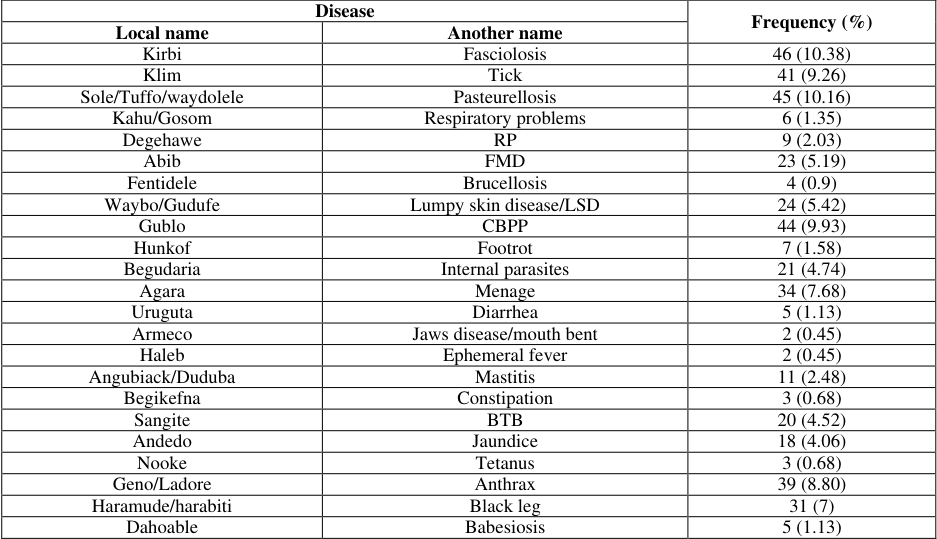 Table 2
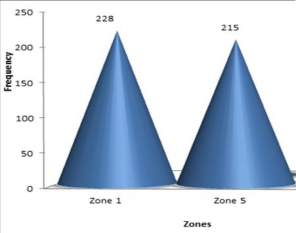 Figure 1
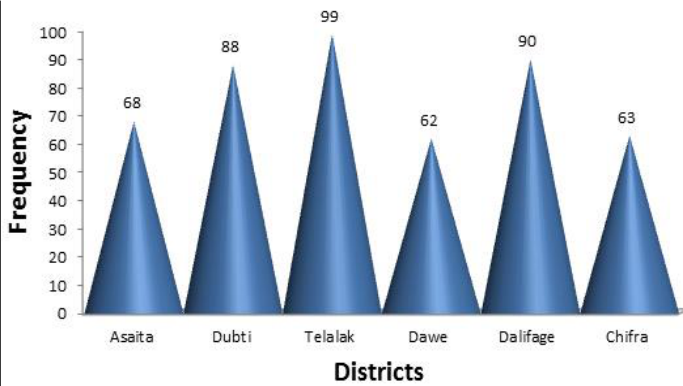 Figure 2
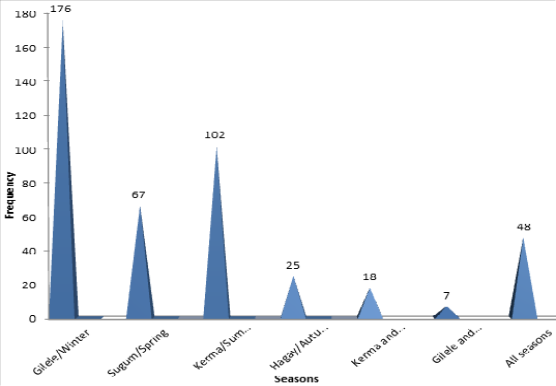 Figure 3
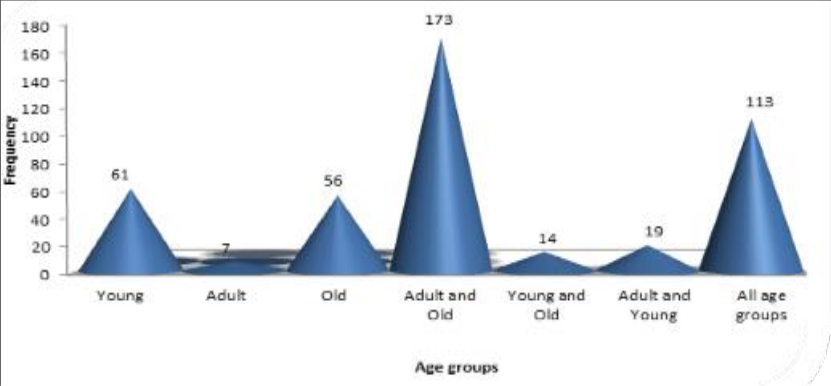 Figure 4
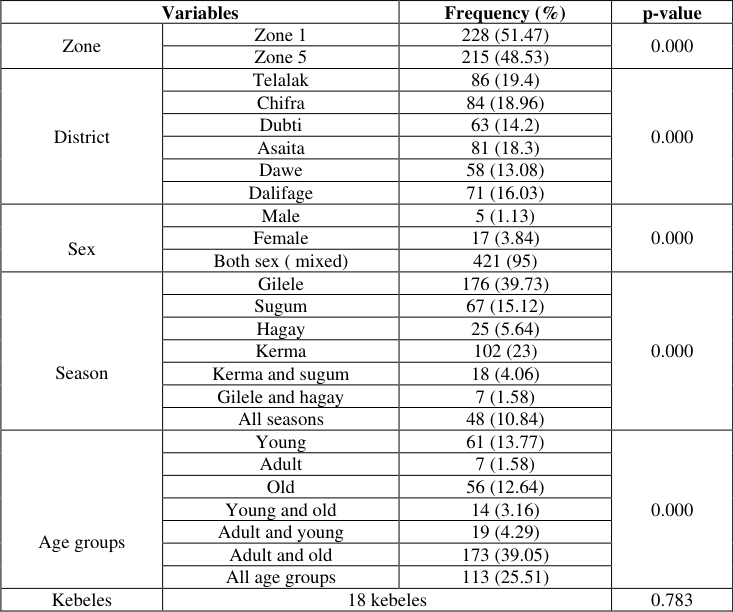 Table 3
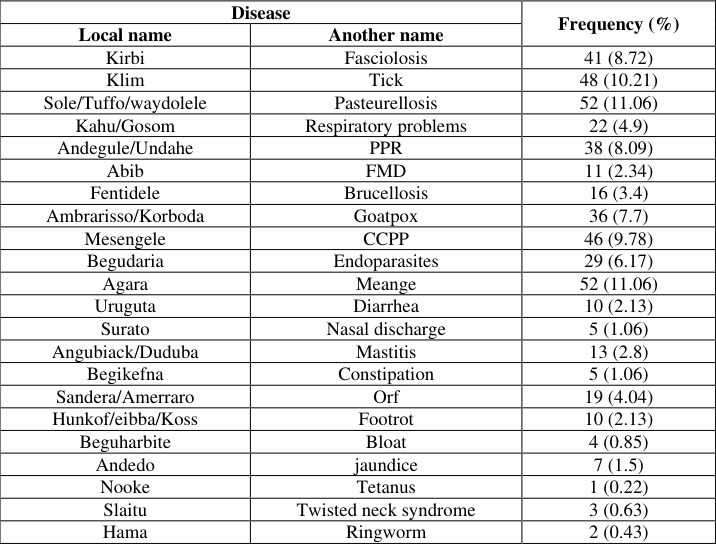 Table 4
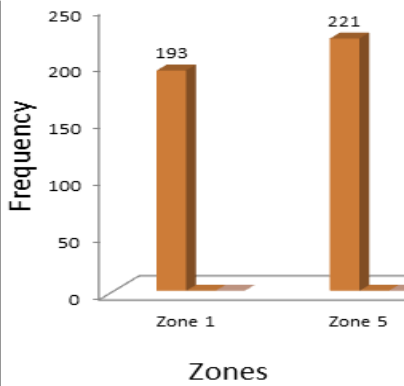 Figure 5
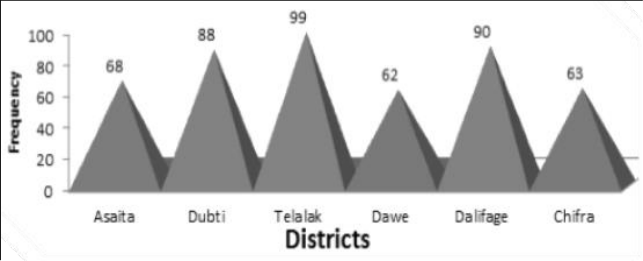 Figure 6
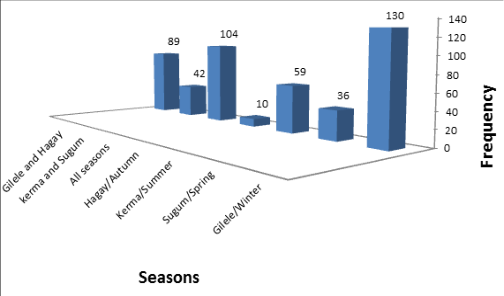 Figure 7
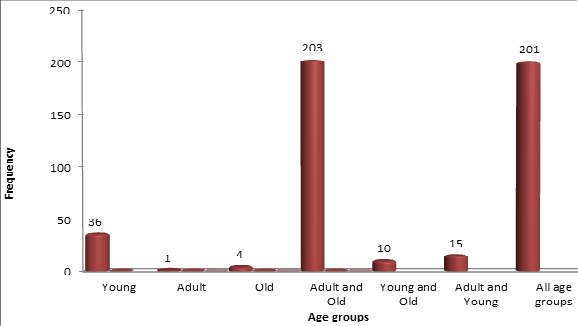 Figure 8
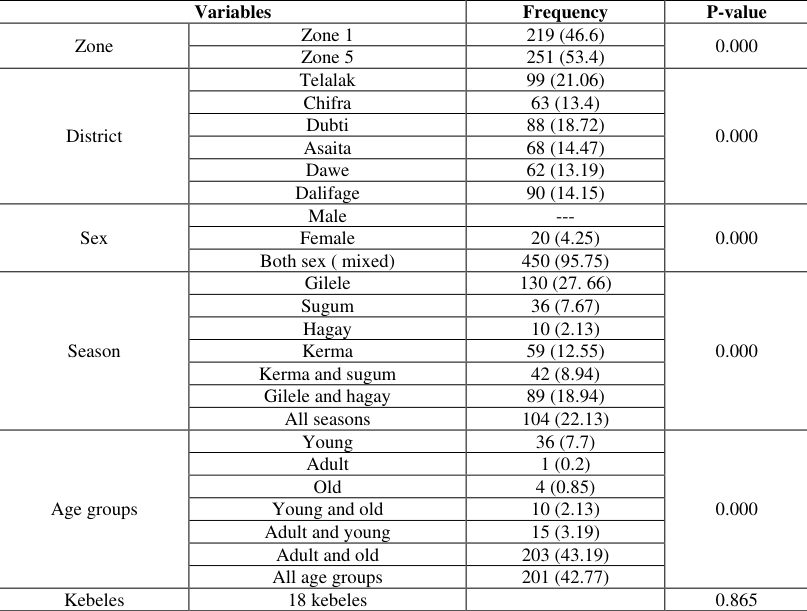 Table 5
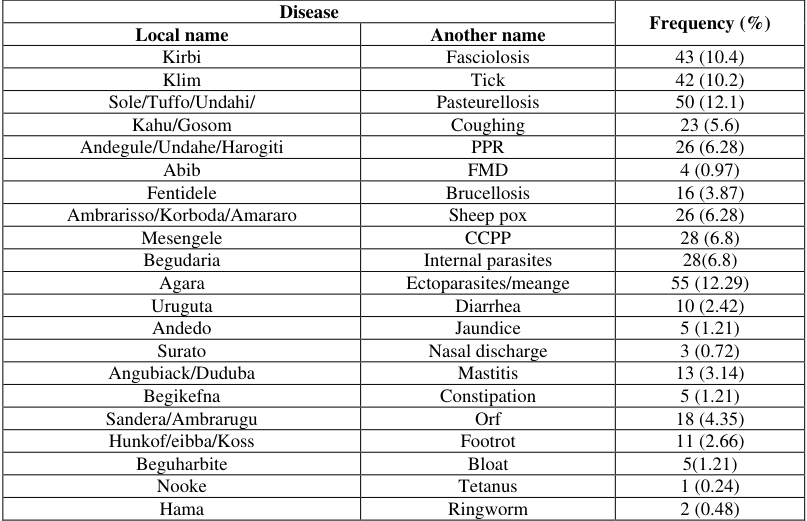 Table 6
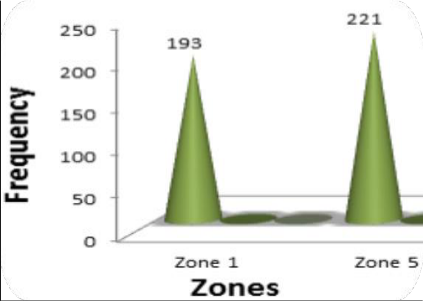 Figure 9
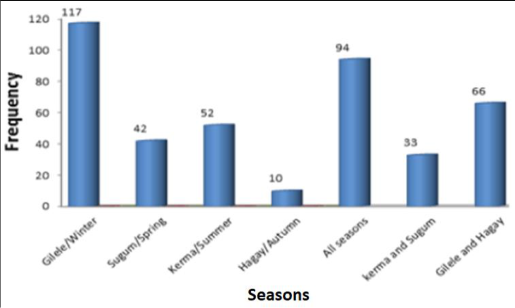 Figure 11
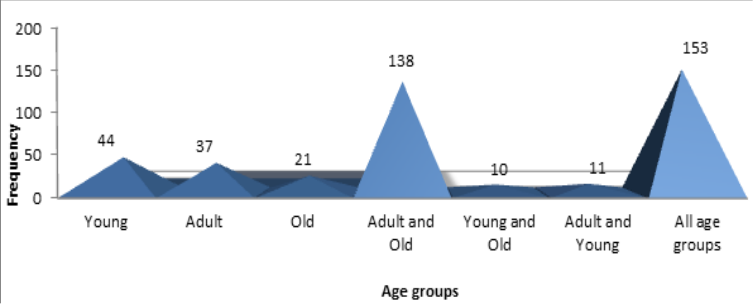 Figure 12
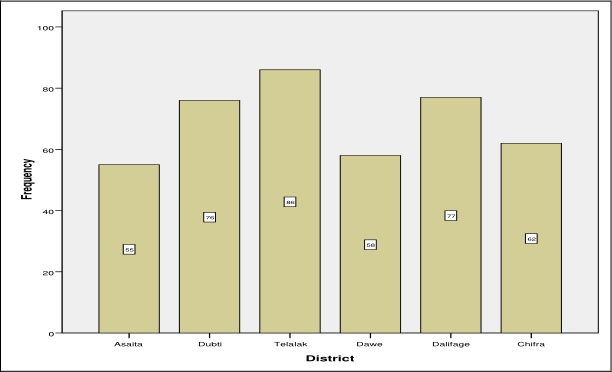 Figure 10
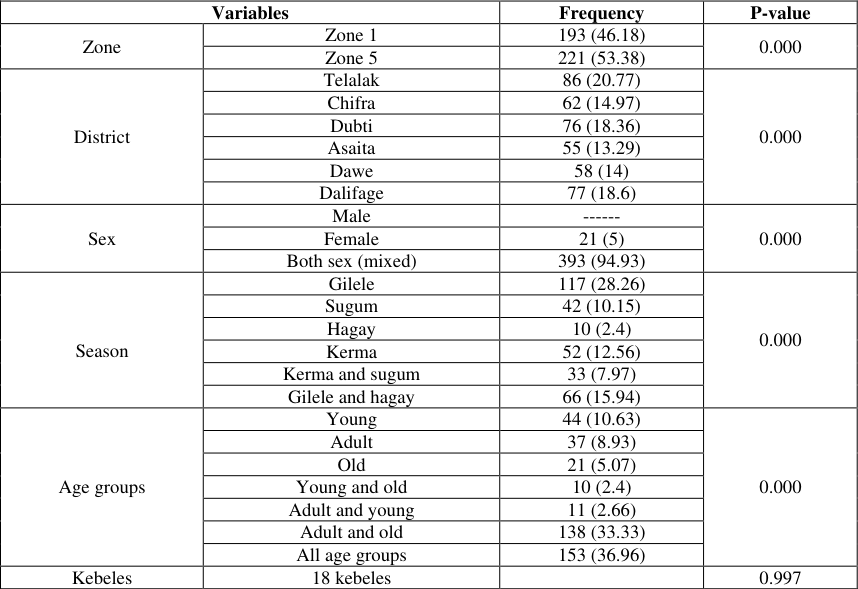 Table 7
Introduction
Geographically situated in the northeastern part of the country, the Afar region is located between 39 o 34' and 42 o 28' East Longitude and 8 o 49'and 14 o 30'North Latitude (CSA, 2008) [9] . The region shares common international boundaries with the state of Eritrea in the northeast and Djibouti in the east, as well as regional boundaries with the Regional States of Tigray in the north-west, Amhara in the south-west, Oromia in the south and Somali in the south-east. The Afar regional state comprises 5 administrative zones, 32 districts and 331 kebeles (PFE, 2009) where the region is situated in the Great Rift Valley of East Africa. There are four distinct seasons in the region, namely, Kerma (summer), Hagay (autumn), Gilele (winter), and Sugum (spring) and climatically characterized by an arid and semi-arid climate with low and erratic rainfall. The annual temperature and rainfall in the region are 30-50 °C and 200-600 mm, respectively. The altitude in the region ranges from 100-1000 meters above sea level (Berhanu, 2008) [6] . The production system of the region is pastoralism (90%) and agro-pastoralism (10%).
The northern part of the Afar Region is a semi-desert with thorny species of shrubs and acacia; further south in the awash valley, steppe vegetation is dominant. Both ecological stages are facing bush encroachment with Prosopis juliflora (Woyane) (Piguet, 2001) [12] . Major crops cultivated in the region include cereals, maize, sorghum, teff, pulses, and oilseeds (CSA, 2009/2010) [8] . The total human population is estimated to be 1,493,409 (PFE, 2009) and the total estimated livestock population included 2,336,488 heads of cattle 4,267,969 head of goats, 2,463,632 head of sheep, 852,016 head of camels, and 187,287 head of equines that support the region and contribute to the national economy (ARS, 2010).
For the pastoral community, livestock is the most important economic factor influencing all other socio-political and cultural activities. However, benefits from the livestock sector remained marginal, which could be attributed to inadequate year-round feed resources, losses from widespread diseases interacting with a lack of adequate veterinary services, pastoral conflict, poor management under which they are served, the low genetic potential for milk production of the indigenous livestock breeds and poor access to input and output market services and inadequate institutions (Assegid, 2000; Garry, 2001) [4,13] . The primary challenge for the region's community has remained to be livestock diseases including Pasteurellosis, contagious bovine pleuropneumonia (CCPP and CBPP), foot and mouse disease, anthrax, PPR, bloody diarrhea, skin and lung diseases, and internal and external parasites and others (Save the children, UK, 2008; MOA, 2004; Gelagay, 1996; Asfaw and Sintaro, 2000) [18,16,14,13] . Research based reliable, organized and prioritized livestock disease information is unavailable. Experiences have shown that (Coppock, 1994) information on animal health had been the focus of research. However, knowing the type and extent of the common and/or major health problems is very important to livestock owners. Veterinarians and researchers can assist in further study of an epidemiological study on diseases of livestock the development of herd health strategies and the selection of possible interventions (Radiostatis et al., 1994; Damte, 2003) [7, 11] . Significant seasonal migrations within the vast lowlands are leading factors for the spread of many endemic and epidemic livestock diseases. According to some studies, livestock diseases accounted for more than 50% of the total mortality in the lowlands (Coppock, 1994) [7] . Disease, therefore, reduces household food consumption both directly and indirectly. This situation necessitates urgently identifying those livestock diseases followed by designing of appropriate control and prevention strategies. This general scenario holds true also for domestic ruminants (cattle, goats, and sheep) in the Afar region. The unavailability of organized and prioritized camel diseases in the region has instigated research activity aimed at a generation of preliminary data on camel diseases. Therefore, the objectives of this study were to assess and prioritize potential cattle and small ruminants' diseases identify risk factors associated with disease occurrence in the study areas.
Materials and Methods
Materials and Methods
Description of the study areas
The study was carried out from January to August 2014 in an attempt to identify and prioritize major camel diseases in six selected Afar region districts. Three districts (Asaita, Dubti, and Chifra) and three districts (Telalak, Dewew and Dalifage) were selected from Zone 1 and 5, respectively. In Zone 1, as of the 2007 census, the total human and camel population was estimated to be 421,790; 891,330, and 2,473,290, respectively. Maize, rice, groundnut, and chickpea were major crops cultivated in Zone 1. On the other hand, in Zone 5, the census study carried out at the same time of the year indicated the total human, cattle, and shoat population to be 183,701; 201,337 and 875,130, respectively. Maize, sessame, masho, groundnut, chickpea, and rice to be major crops and green pepper, tomato, Onion, and sweet potato to be major vegetables in Zone 5. Four seasons circulate in the region each year: Kerma (summer), Hagay (autumn), Gilele (winter) and Sugum (spring).
The study population
The study was conducted on local domestic cattle, goat and sheep reared by Afar pastoral and agro-pastoral camel owners. All age groups and sex were included in the study.
The study design
The study was carried out applying a cross-sectional study design. Methodologically, questionnaires and retrospective data analysis were used to generate the required information. Two zones of the region (Zone 1 and zone 5) were selected randomly. Three districts were selected from each zone and three kebeles in turn were selected of each district. Eight camel owners were selected for each kebele for interview. As a result, 144 camel owners interviewed. Retrospective data of five years (2009-2013 GC) was collected of six selected veterinary clinics in the study districts.
Sampling methods and sample size determination
A combination of both probability and non-probability sampling methods was applied in the study. Zones (Zone 1 and 5), districts and kebeles were purposively selected based on the accessibility of selected study areas, study population density and argo-ecologic differences. From Zone 1, three districts (Asaita, Dubti and Chifra) and Zone 5, three districts (Telalak, Dawe and Dalifage) were purposively selected. Similarly, three kebeles from each selected district were in turn selected purposively. However, interviewees per each selected kebele were selected using a simple random sampling method. The total number of interviewees (sample size) required for this study was determined using a formula given by (Thrusfield, 1995) [21] . N= [1.96 2 P exp (1-P exp )]/d 2 (Where, N= Sample size, P exp = Expected prevalence, d= Absolute precision).
In determining the total number of samples to be taken, the absolute precision was taken to be 0.05 and the expected prevalence of 0.5. Substituting variables the formula has provided the total sample to be 384. However, due to information redundancy observed during the study period, the total number of interviewees to be taken was reduced from 384 to 144 which indirectly fixed the selection of eight livestock owners/respondents to be randomly selected for each study kebeles.
Study methodology
Two complementary study methods (questionnaire and retrospective data analysis) were parallelly carried out to generate combined possible valid information.
Questionnaire survey
Prior to the administration of questionnaires, the study questionnaires were carefully drafted and structurally organized, and pretested. Each question paper comprised nine pages and 21 targeted questions written in the English language. During the study period, 144 questionnaire papers were prepared and administered to 144 randomly selected different livestock owners (both adult men and women). Translating English to Amharic and then to Afar local language, each camel owner was asked 21 specific questions pertaining to camel disease conditions. The same study questionnaire formats were used in all study areas.
Retrospective data collection
To questionnaire outputs, retrospective data of five years (2000-2004 E.C) were also collected from six selected veterinary clinics present in the six selected districts using a separate type of paper format prepared for this purpose. This was assumed to increase the validity and truth of the respondents' responses or to correlate clinical data with community responses.
Data management and analysis
Relevant data collected from livestock owners and veterinary clinical records were organized and further analyzed us analytical software statistical packages for social sciences (SPSS, Version 15.0, 2005) ware. Descriptive statistics were conducted to determine the frequency (priority) of cattle and small ruminant diseases and associated rates of zones, districts, age groups, sex, and seasons. Chi-square test was employed to assess the existence of an association between disease occurrence and risk factors. Both binomial and multinomial logistic regression analyzes were performed to evaluate the significance of the association between disease occurrence and risk factors.
Results
The combined results of 144 livestock owners' interviews and analysis of veterinary clinical records identified 23, 22, and 21 cattle, goats, and sheep diseases, respectively, as prioritized in Table 2. The community responses on livestock diseases were also further supported by an analysis of five years' retrospective data records gathered from study districts. On the basis of etiologic agents, domestic ruminants' diseases reported in the current study were categorized into six groups: Bacterial, parasitic, fungal, viral, unknown etiology, and miscellaneous diseases as shown in the following table (Table 1).
| Disease | — | Frequency (%) |
|---|---|---|
| Local name | Another name | |
| Kirbi | Fasciolosis | 46 (10.38) |
| Klim | Tick | 41 (9.26) |
| Sole/Tuffo/waydolele | Pasteurellosis | 45 (10.16) |
| Kahu/Gosom | Respiratory problems | 6 (1.35) |
| Degehawe | RP | 9 (2.03) |
| Abib | FMD | 23 (5.19) |
| Fentidele | Brucellosis | 4 (0.9) |
| Waybo/Gudufe | Lumpy skin disease/LSD | 24 (5.42) |
| Gublo | CBPP | 44 (9.93) |
| Hunkof | Footrot | 7 (1.58) |
| Begudaria | Internal parasites | 21 (4.74) |
| Agara | Menage | 34 (7.68) |
| Uruguta | Diarrhea | 5 (1.13) |
| Armeco | Jaws disease/mouth bent | 2 (0.45) |
| Haleb | Ephemeral fever | 2 (0.45) |
| Angubiack/Duduba | Mastitis | 11 (2.48) |
| Begikefna | Constipation | 3 (0.68) |
| Sangite | BTB | 20 (4.52) |
| Andedo | Jaundice | 18 (4.06) |
| Nooke | Tetanus | 3 (0.68) |
| Geno/Ladore | Anthrax | 39 (8.80) |
| Haramude/harabiti | Black leg | 31 (7) |
| Dahoable | Babesiosis | 5 (1.13) |
Table text extracted from the original PDF; superscript letters are shown inline. The original table image is below.
View original table image
| Livestock species | Frequency and disease category by etiology/causative agent | — | — | — | — | — |
|---|---|---|---|---|---|---|
| Bacterial (%) | Viral (%) | Fungal (%) | Parasitic (%) | Miscellaneous (%) | Unknown (%) | |
| Cattle | 9 (39.13) | 4 (17.4) | 1(4.34) | 4(17.4) | 3 (13.04) | 2(8.7) |
| Goat | 6 (27.27) | 4(18.18) | 1(4.55) | 4(18.18) | 4(18.18) | 3(13.64) |
| Sheep | 6 (28.57) | 4(19.05) | 1(4.76) | 4(19.05) | 4(19.05) | 2(9.5) |
Table text extracted from the original PDF; superscript letters are shown inline. The original table image is below.
View original table image
Identified cattle diseases and associated findings
The study identified about 23 potential cattle diseases based on the responses of 144 livestock owners and retrospective data analysis of six selected veterinary clinical records. These findings are summarized using bar graphs, pie charts and tables below. In an attempt to assess the impact of age as a risk factor on disease occurrence, a statistically significant difference (P= 0.000) was observed using multinomial logistic regression. Analysis has also made to see sex as a factor and found as a statistically significant association (P=0.000) existed between sex and disease occurrence. On the other hand, statistical analysis indicated as kebeles or pastoral villages had no statistically significant association (P=0.783) with disease occurrence (Table 2).
Identified goat diseases and associated findings
This study identified about 22 influential goat diseases based on the responses of 144 livestock owners and retrospective data analysis of six selected veterinary clinical records. These findings are summarized using bar graphs and tables below.
Discussion
Combined analysis of retrospective data and community interviews revealed 23;22 and 21 potential cattle, goat, and sheep diseases as indicated (Tables 2,4, and 6), respectively. Dagnachew (1997) [10] conducted a livestock disease survey in zone 2 and reported 19 cattle, 13 camels, 22 goats, and 18 sheep diseases. His report agrees with the findings of the present study. The local and scientific names of the diseases he reported in each species are also similar with few variations due to local differences in the naming of the same disease. The more numerous disease lists reported in this present study in cattle and camel species compared to his findings may be due to sampling of more study areas (six selected districts from zones 1 and 5) in contrast to a single study woreda, Aba'ala. In addition, though not all, those dominant diseases reported by Dagnachew (1997) [10] are also dominantly reported in the present study areas. This might be attributed to the fact that the study areas are ecologically identical (Zones 1, 2, and 5). Furthermore, factors like animal breeds, management, and intermingling (communal grazing) of livestock in the study areas.
Cattle diseases
This survey has revealed 23 cattle diseases, including their respective frequencies as indicated (Table 2) which were supposed (by livestock owners) to affect cattle health and expected productivity levels. Most frequent cattle diseases in decreasing order included Fasciolosis/Kirbi (10.38%), Pasteurellosis/Sole (10.16%), CBPP/Gublo (9.93%), Ticks/Kilim (9.26%), Anthrax/Geno (8.80%) and others. This study revealed as that Fasciolosis/Kirbi (10.38%) the most frequent disease in cattle. A high prevalence of Fasciolosis was reported by Ameni et al., (2001) [23] in northeast Ethiopia in cattle. These most frequent and other cattle diseases (listed in Table 2) are also reported by different authors including Tekle (2007) [20] in Alamata district, Tigray region, and Dagnachew (1997) [10] in zone 2 of Afar region. However, the occurrence of these diseases indicated significant variation (p<0.05) among study areas.
Goat diseases
The study assessed and revealed 22 potential goat diseases of all the study sites. Goat diseases identified were ranked based on occurrence or frequency as tabulated (Table 4). A few most frequent sheep diseases in decreasing order include: Undahi/Pasteurellosis (11.06%, and meange/agara/(11.06%) both are ranked first), secondly kilim/ticks (10.21%), thirdly Mesengele/CCPP (9.78%), Fasciolosis/kirbi (8.72%), and others as indicated (Table 5) were found to be the most challenging sheep diseases reported by respondents and clinical data analysis. The reports of Dagnachew (1997) [10] , from zone 2 of the Afar region agree with the present findings though variations exist. He reported 22 major goat diseases which coincided with the present findings though a few diseases he reported are slightly different from the diseases found in zone 1 and 5. He found CCPP/Mesengele to be the leading goat disease in zone 2 followed by meange/Agara and thirdly Undahi/Pasterollosis. Despite existence of the diseases, the prevalence/frequencies of tick/kilim and Fasciolosis/kirbi which were placed third and fifth in this study were ranked 15 th and 20 th , respectively in zone 2 in contrast to their frequencies in zones 1 and 5 (present study areas). Variations might be an ecologic preference of diseases, animal management practices, the geography of the study areas, study methods, and the like. A few goat diseases identical to the present study were also reported by Tekle (2007) [20] , from Tigray region.
| Variables | — | Frequency | P-value |
|---|---|---|---|
| Zone | Zone 1 | 219 (46.6) | 0.000 |
| Zone 5 | 251 (53.4) | ||
| District | Telalak | 99 (21.06) | 0.000 |
| Chifra | 63 (13.4) | ||
| Dubti | 88 (18.72) | ||
| Asaita | 68 (14.47) | ||
| Dawe | 62 (13.19) | ||
| Dalifage | 90 (14.15) | ||
| Sex | Male | --- | 0.000 |
| Female | 20 (4.25) | ||
| Both sex ( mixed) | 450 (95.75) | ||
| Season | Gilele | 130 (27. 66) | 0.000 |
| Sugum | 36 (7.67) | ||
| Hagay | 10 (2.13) | ||
| Kerma | 59 (12.55) | ||
| Kerma and sugum | 42 (8.94) | ||
| Gilele and hagay | 89 (18.94) | ||
| All seasons | 104 (22.13) | ||
| Age groups | Young | 36 (7.7) | 0.000 |
| Adult | 1 (0.2) | ||
| Old | 4 (0.85) | ||
| Young and old | 10 (2.13) | ||
| Adult and young | 15 (3.19) | ||
| Adult and old | 203 (43.19) | ||
| All age groups | 201 (42.77) | ||
| Kebeles | 18 kebeles | 0.865 |
Table text extracted from the original PDF; superscript letters are shown inline. The original table image is below.
View original table image
| Disease | — | Frequency (%) |
|---|---|---|
| Local name | Another name | |
| Kirbi | Fasciolosis | 41 (8.72) |
| Klim | Tick | 48 (10.21) |
| Sole/Tuffo/waydolele | Pasteurellosis | 52 (11.06) |
| Kahu/Gosom | Respiratory problems | 22 (4.9) |
| Andegule/Undahe | PPR | 38 (8.09) |
| Abib | FMD | 11 (2.34) |
| Fentidele | Brucellosis | 16 (3.4) |
| Ambrarisso/Korboda | Goatpox | 36 (7.7) |
| Mesengele | CCPP | 46 (9.78) |
| Begudaria | Endoparasites | 29 (6.17) |
| Agara | Meange | 52 (11.06) |
| Uruguta | Diarrhea | 10 (2.13) |
| Surato | Nasal discharge | 5 (1.06) |
| Angubiack/Duduba | Mastitis | 13 (2.8) |
| Begikefna | Constipation | 5 (1.06) |
| Sandera/Amerraro | Orf | 19 (4.04) |
| Hunkof/eibba/Koss | Footrot | 10 (2.13) |
| Beguharbite | Bloat | 4 (0.85) |
| Andedo | jaundice | 7 (1.5) |
| Nooke | Tetanus | 1 (0.22) |
| Slaitu | Twisted neck syndrome | 3 (0.63) |
| Hama | Ringworm | 2 (0.43) |
Table text extracted from the original PDF; superscript letters are shown inline. The original table image is below.
View original table image
Sheep Diseases
This study assessed and established 21 major sheep diseases from all the study sites. Sheep diseases identified were ranked based on occurrence or frequency as tabulated (Table 6). A few most frequent sheep diseases in decreasing order include: Meange (locally termed as "Agara" is found to be the leading disease of sheep followed by Pasteurellosis/Tuffo (12.1%), thirdly Fasciolosis/Kirbi (10.4%), fourthly ticks/kilim (10.2%), and two diseases of sheep were equally frequent (CCPP/Mesengele (6.8%) and Begudaria/internal parasites (6.8%)), theses and others mentioned in table 6 were found to be the most challenging sheep diseases reported by respondents and clinical data analysis. Majority of these sheep diseases were also reported by Dagnachew (1997) [10] , from zone 2 of Afar region. He reported 18 sheep diseases and ranked Pasteurellosis/Undahi/ Tuffo/first, Agara/meange second/, tick/kilim/12 th , Begudaria/ internal parasite 5 th and lastly Fasciolosis/kirbi. These variations can attributed to ecological difference which can enhance/hinder the occurrence diseases, season of study between study areas and better clinical data recording system. Moreover, Tekle (2007) [20] had conducted a study in one of Tigray region districts, Alamata and reported majority of these sheep diseases. A statistically significant variation (p<0.05) has been indicated among different age groups of each species (cattle, goat and sheep) respectively. The questionnaire survey indicated as disease occurrence is far more frequent in young once followed by older animals. In support of other observations (Urquhart, et al., 1996 and Melauncon, 1993) [22,15] , young animals are more severely affected than older animals, this is perhaps because they possess a higher ratio of accessible surface to body volume, inefficient grooming behavior and other defense capabilities/immunological maturity (Melauncon, 1993) [15] as the animals get older and the development of acquired resistance due to repeated exposure. It was also observed that a much lower frequency of diseases was observed in adult cattle compared to young and old once. There was statistically significant variations (p<0.05) between sex indicating that identified diseases in each species were more frequent in female animals compared to male animals (Tables 3,5, and 7 for cattle, goat and sheep, respectively). But, most diseases were found to influence both sex in each species. This may be due to the exposure of female animals stress conditions, especially lactating and pregnant animals. Generally, identified in the three species (cattle, sheep and goat) diseases were more frequent in female animals than male animals. The study of seasonal dynamics on the occurrence of diseases had implied that there were statistically significant variations (p<0.05) among the four common seasons in the region (Tables3, 5 and 7 for cattle, goat and sheep, respectively). As indicated majority of the diseases in each species occur in the season winter/gielele followed by summer/kerma season, thirdly in spring/sugum and least in the season autumn/hagay. Many riskfactors found to be significantly associated with domestic ruminants' diseases (p<0.05). Study sites, sex and age of the animals, and season showed significant differences with respect to disease occurrence. Zonal and district level significant variations could be attributed to the difference in ecology, nutritional impact, breed type, geography, and management practices through kebeles were found to have no impact on disease occurrence (p>0.05). Husbandry practices and breeds of animals kept could be probable reasons. Statistically significant variation (p<0.05) was observed among different age groups. Young ruminants were frequently affected followed by older ones which could be attributed to strength of immunity in adult and followed by older animals. Urquhart, et al., 1996 [22] and Melauncon, 1993 [15] supported the current findings that young animals are severely affected than older animals, since they possess a higher ratio of accessible surface to body volume, inefficient grooming behavior and other defense capabilities/ immunological maturity (Melauncon, 1993) [15] as the animals get older and the development of acquired resistance due to repeated exposure. It was also observed that much lower frequency of diseases was observed in adult cattle compared to young and old once. Sex of ruminants was found to influence occurrence of diseases statistically (p<0.05) where more frequency was identified in female animals compared to male animals. This may be due to the exposure of female animals to stress conditions, especially lactating and pregnant animals. Season was found to influence significantly (p<0.05) the occurrence of diseases in ruminants. The current studies found that majority of domestic ruminants' diseases occur in the season winter/gielele followed by summer/kerma season, thirdly in spring/sugum and least in the season autumn/hagay.
| Disease | — | Frequency (%) |
|---|---|---|
| Local name | Another name | |
| Kirbi | Fasciolosis | 43 (10.4) |
| Klim | Tick | 42 (10.2) |
| Sole/Tuffo/Undahi/ | Pasteurellosis | 50 (12.1) |
| Kahu/Gosom | Coughing | 23 (5.6) |
| Andegule/Undahe/Harogiti | PPR | 26 (6.28) |
| Abib | FMD | 4 (0.97) |
| Fentidele | Brucellosis | 16 (3.87) |
| Ambrarisso/Korboda/Amararo | Sheep pox | 26 (6.28) |
| Mesengele | CCPP | 28 (6.8) |
| Begudaria | Internal parasites | 28(6.8) |
| Agara | Ectoparasites/meange | 55 (12.29) |
| Uruguta | Diarrhea | 10 (2.42) |
| Andedo | Jaundice | 5 (1.21) |
| Surato | Nasal discharge | 3 (0.72) |
| Angubiack/Duduba | Mastitis | 13 (3.14) |
| Begikefna | Constipation | 5 (1.21) |
| Sandera/Ambrarugu | Orf | 18 (4.35) |
| Hunkof/eibba/Koss | Footrot | 11 (2.66) |
| Beguharbite | Bloat | 5(1.21) |
| Nooke | Tetanus | 1 (0.24) |
| Hama | Ringworm | 2 (0.48) |
Table text extracted from the original PDF; superscript letters are shown inline. The original table image is below.
View original table image
Conclusion and recommendations
Interview and retrospective data analysis methods have revealed prevalent domestic ruminants 'diseases which are impacting health and productivity along with their frequency of occurrence. Except kebeles, all factors (age and sex of animals, season, and study sites) were found to influence disease occurrence. Based on the findings, the following recommendations were forwarded Confirmatory investigations should be done on those identified diseases Extensive and continued epidemiological investigations on ruminants' diseases should be launched besides disease identification and characterization Further continued studies on the remaining areas of the region must strongly and urgently be conducted
Figures and tables from the paper
| Variables | — | Frequency (%) | p-value |
|---|---|---|---|
| Zone | Zone 1 | 228 (51.47) | 0.000 |
| Zone 5 | 215 (48.53) | ||
| District | Telalak | 86 (19.4) | 0.000 |
| Chifra | 84 (18.96) | ||
| Dubti | 63 (14.2) | ||
| Asaita | 81 (18.3) | ||
| Dawe | 58 (13.08) | ||
| Dalifage | 71 (16.03) | ||
| Sex | Male | 5 (1.13) | 0.000 |
| Female | 17 (3.84) | ||
| Both sex ( mixed) | 421 (95) | ||
| Season | Gilele | 176 (39.73) | 0.000 |
| Sugum | 67 (15.12) | ||
| Hagay | 25 (5.64) | ||
| Kerma | 102 (23) | ||
| Kerma and sugum | 18 (4.06) | ||
| Gilele and hagay | 7 (1.58) | ||
| All seasons | 48 (10.84) | ||
| Age groups | Young | 61 (13.77) | 0.000 |
| Adult | 7 (1.58) | ||
| Old | 56 (12.64) | ||
| Young and old | 14 (3.16) | ||
| Adult and young | 19 (4.29) | ||
| Adult and old | 173 (39.05) | ||
| All age groups | 113 (25.51) | ||
| Kebeles | 18 kebeles | 0.783 |
Table text extracted from the original PDF; superscript letters are shown inline. The original table image is below.
View original table image
| Variables | — | Frequency | P-value |
|---|---|---|---|
| Zone | Zone 1 | 193 (46.18) | 0.000 |
| Zone 5 | 221 (53.38) | ||
| District | Telalak | 86 (20.77) | 0.000 |
| Chifra | 62 (14.97) | ||
| Dubti | 76 (18.36) | ||
| Asaita | 55 (13.29) | ||
| Dawe | 58 (14) | ||
| Dalifage | 77 (18.6) | ||
| Sex | Male | ------ | 0.000 |
| Female | 21 (5) | ||
| Both sex (mixed) | 393 (94.93) | ||
| Season | Gilele | 117 (28.26) | 0.000 |
| Sugum | 42 (10.15) | ||
| Hagay | 10 (2.4) | ||
| Kerma | 52 (12.56) | ||
| Kerma and sugum | 33 (7.97) | ||
| Gilele and hagay | 66 (15.94) | ||
| Age groups | Young | 44 (10.63) | 0.000 |
| Adult | 37 (8.93) | ||
| Old | 21 (5.07) | ||
| Young and old | 10 (2.4) | ||
| Adult and young | 11 (2.66) | ||
| Adult and old | 138 (33.33) | ||
| All age groups | 153 (36.96) | ||
| Kebeles | 18 kebeles | 0.997 |
Table text extracted from the original PDF; superscript letters are shown inline. The original table image is below.
View original table image
References
6 in the original paper- Asfaw W, Sintaro T. The status of foot and mouth disease in Ethiopia, a growing concern. Ethiopian veterinary Epidemiology Newsletter. Addis Ababa, Ethiopia, 2000;1(2):1-5.
- Ayelet G, Yigezu L, Gelaye E, Tariku S, Asmare K. Epidemiologic and Serologic investigation of multifactorial respiratory diseases of sheep in Center high land of Ethiopia. Journal of applied research in Veterinary Medicine. 2004;2(4):274-278.
- Coopreck DL. The Borenaplaute of southern Ethiopia. Synthesis of pastoral research, development and change, 1986-91. System study. International Livestock Center for Africa (ILCA), Addis Ababa, Ethiopia; c1994, p. 4.
- CSA (Central Statistical Agency), Agricultural sampling survey report on area and crop production, Addis Ababa; c2009-2010.
- CSA (Central Statistical Authority), Summary and statistical report of the 2007. Population and Housing Census. Addis Ababa, Ethiopia; c2008.
- Ragassa AL, Ameni GO. Sensitivity and specificity of a single intradermal tuberculin test at the cervical and caudal folds in zabu cattle in Ethiopia. The Indian Journal of Animal Sciences (India). 2001;71(4):325-327.