
Research article · 2022 · Full text
International Journal of Veterinary Sciences and Animal HusbandryVariation in response of Mubende, Boer and Boer x Mubende goat breeds to gastrointestinal nematode infection under field conditions in Uganda
Volume 7(2) · Pages 07–16 · DOI: 10.22271/veterinary.2022.v7.i2a.406 ↗
Research areasHelminth infection and controlMilk Quality and Mastitis in Dairy Cows
Abstract
Author-writtenMore productive exotic Boer goats are increasing replacing indigenous Mubende goats in Uganda in a crossbreeding program, yet Boer goats easily succumb to gastrointestinal nematode (GIN) infection to which indigenous Mubende goats are more tolerant. Hence, a cross-sectional study was conducted in Ssembabule, Mpigi, Masaka and Mubende districts in Uganda to understand whether variation in susceptibility to GIN infection exists among Mubende, Boer and Boer x Mubende goats under field conditions. A total of 2423 goats, consisting of Mubende (n =1,667), Boer (n = 87) and Boer x Mubende (n = 669) goats were randomly sampled. Faecal Egg Count (FEC) and Packed Cell Volume (PCV) were determined and data on factors: gender, age, location, flock size and management were collected. The findings revealed that age and location had significant (P
Summary
Source-checkedPlain-language reading of the full paper, prepared with AI and checked against the text. Each point links to the authors' own words.
Why it matters
- Gastrointestinal nematode (GIN) infections are a major cause of death, stunted growth, and production losses for goats in tropical regions. View evidence ↗
- In Uganda, productive exotic Boer goats are replacing indigenous Mubende goats, but Boer goats are more susceptible to GIN infections than the tolerant Mubende breed. View evidence ↗
- Current GIN control in Uganda relies on anthelmintic treatments, which are often too expensive for smallholders and are increasingly compromised by drug resistance. View evidence ↗
The question
- The study aimed to determine if there are differences in susceptibility to GIN infections among Mubende, Boer, and Boer x Mubende goats in field conditions across four Ugandan districts. View evidence ↗
What they did
- The researchers randomly sampled 2,423 goats, including 1,667 Mubende, 87 Boer, and 669 Boer x Mubende goats. View evidence ↗
- The study measured Faecal Egg Count (FEC) and Packed Cell Volume (PCV) while recording data on age, gender, location, management, and flock size. View evidence ↗
- FEC was determined as eggs per gram (EPG) using a modified McMaster technique with a detection level of 100 EPG. View evidence ↗
- Data analysis involved t-tests for mean FEC and multivariate linear regression to identify factors influencing FEC and PCV variance, with significance set at p < 0.05. View evidence ↗
What they found
- Faecal Egg Counts (FEC) were negatively affected by age and district, but positively affected by flock size. View evidence ↗
- Boer x Mubende crosses had a highly significant positive effect on FEC (p < 0.001), whereas the Boer breed did not show a significant effect (p = 0.17). View evidence ↗
- Both Mubende (p < 0.001) and Boer (p < 0.05) breeds had a significant negative effect on FEC. View evidence ↗
- Boer x Mubende crosses showed the highest proportion of goats with an EPG of 100-1000 (25%), compared to Boer (16%) and Mubende (14%) goats. View evidence ↗
- Most Mubende and Boer goats had a mean Packed Cell Volume (PCV) of 26-30%, while Boer x Mubende crosses had a lower mean PCV of 21-25%. View evidence ↗
- Both female and male Boer x Mubende crosses had significantly higher mean FEC than their Mubende counterparts (p < 0.05). View evidence ↗
- Regardless of management quality, Mubende goats had significantly higher mean FEC than Boer goats (p < 0.001). View evidence ↗
- Boer x Mubende crosses had significantly higher mean FEC than Boer goats (p < 0.05), independent of management level. View evidence ↗
What it means
- The authors concluded that Boer x Mubende crosses are more susceptible to GIN than Mubende goats, but both are less susceptible than pure Boer goats. View evidence ↗
- The authors recommend follow-up studies under experimental conditions to confirm the susceptibility levels observed in this field study. View evidence ↗
Visual summary
3 visualsIllustrations explain the paper; charts are replotted from the paper's own table values.
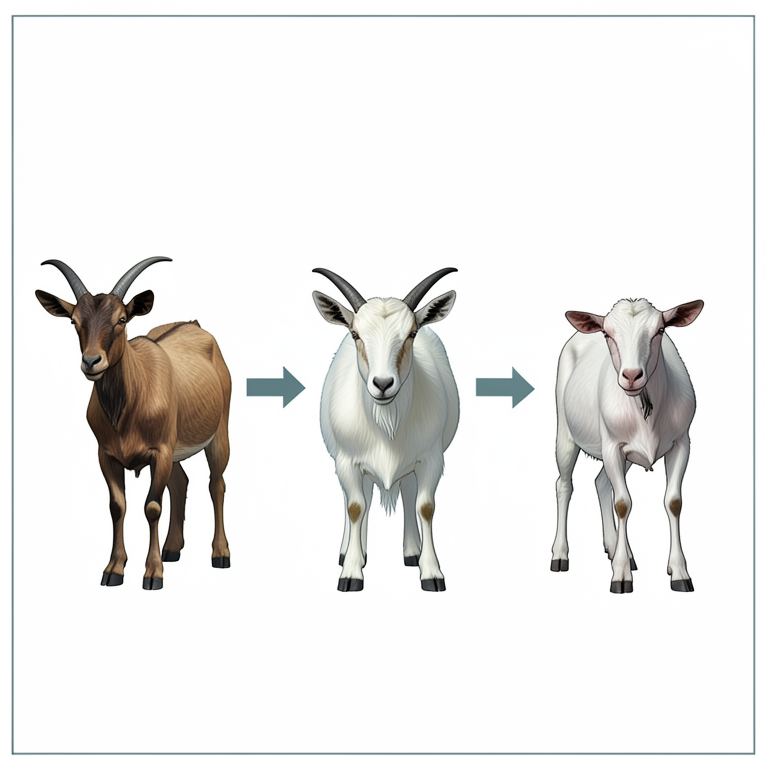
Susceptibility Hierarchy
AI-generated conceptual illustration (Mubende, Boer, and Boer x Mubende goat breeds). It explains the idea and does not show study data.
View source evidence ↗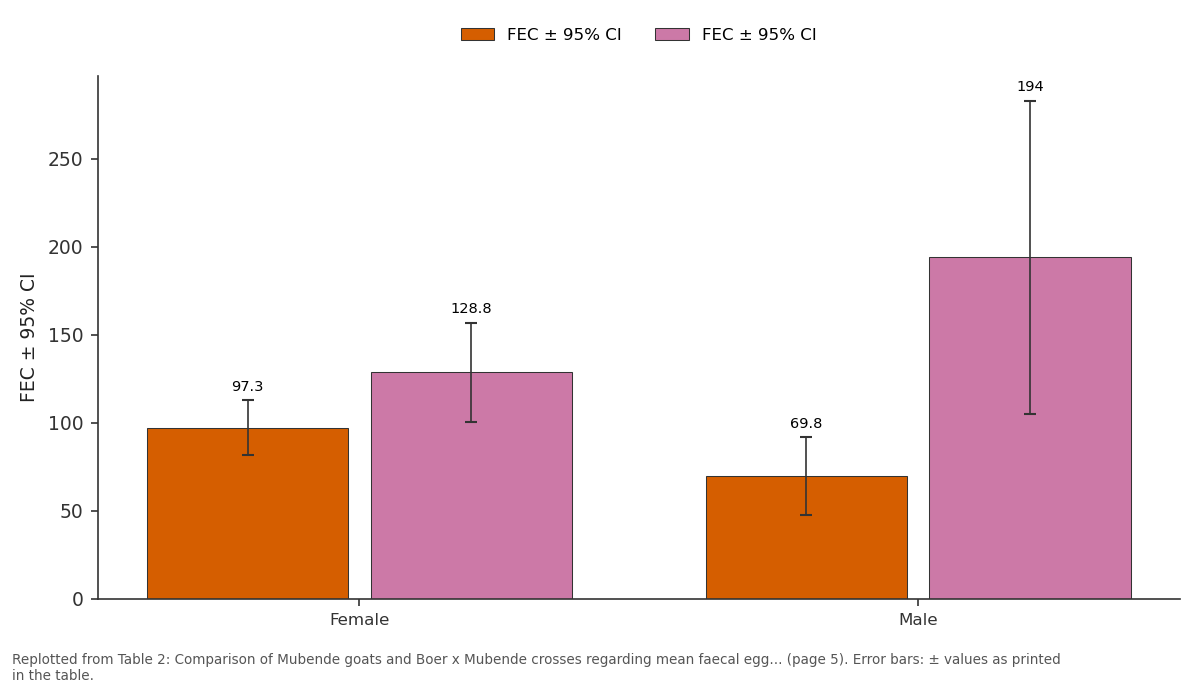
FEC ± 95% CI and FEC ± 95% CI: Female vs Male
Replotted from Table 2 (page 5) of the original paper. Every bar is the paper's own table value.
View source evidence ↗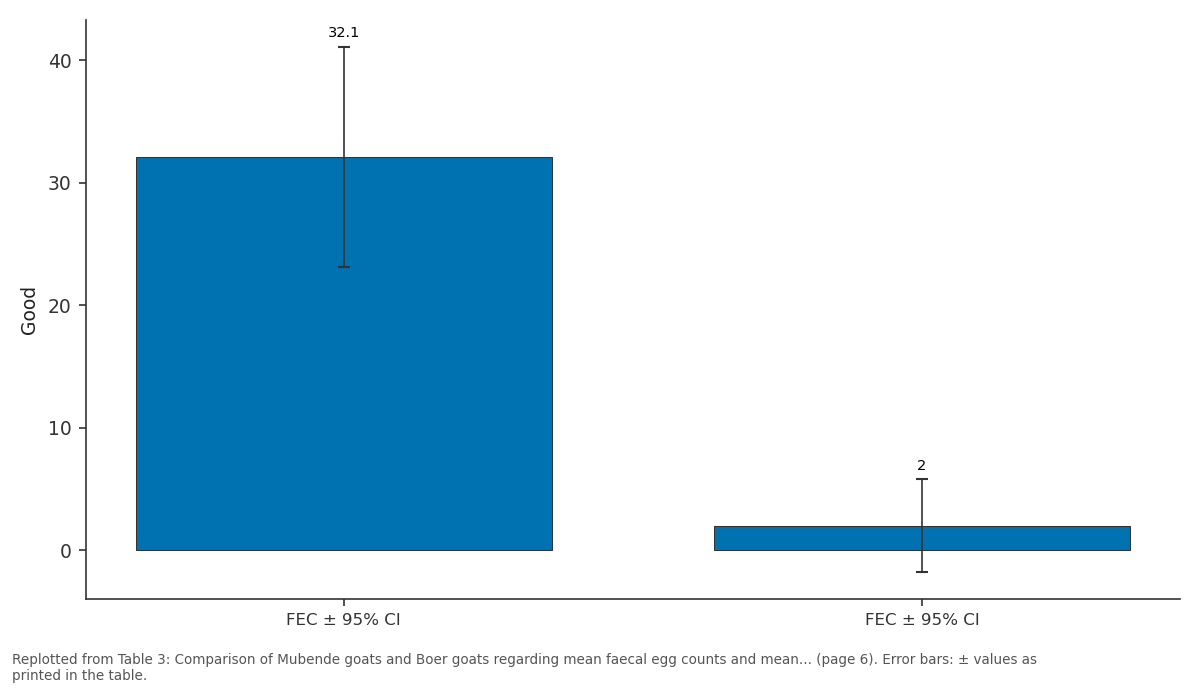
Good: FEC ± 95% CI vs FEC ± 95% CI
Replotted from Table 3 (page 6) of the original paper. Every bar is the paper's own table value.
View source evidence ↗Figures & tables
From the original paper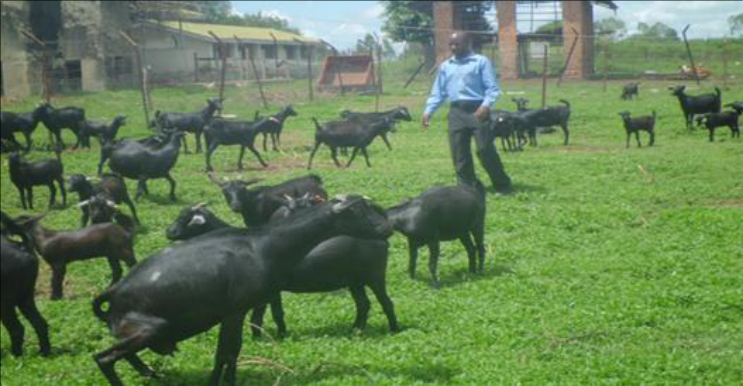 Figure 1
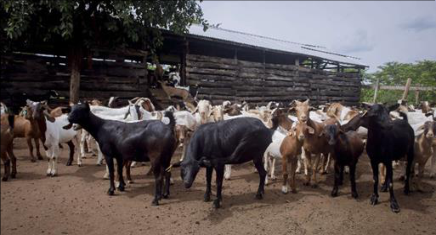 Figure 2
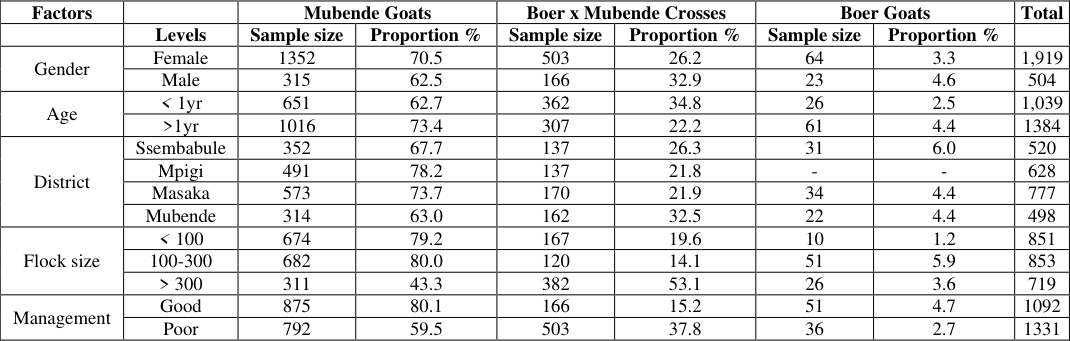 Table 1
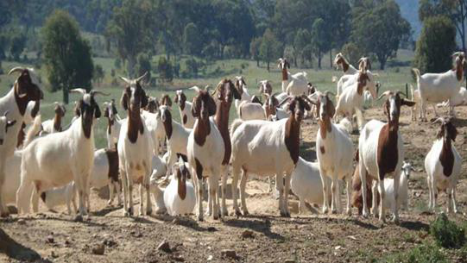 Figure 3
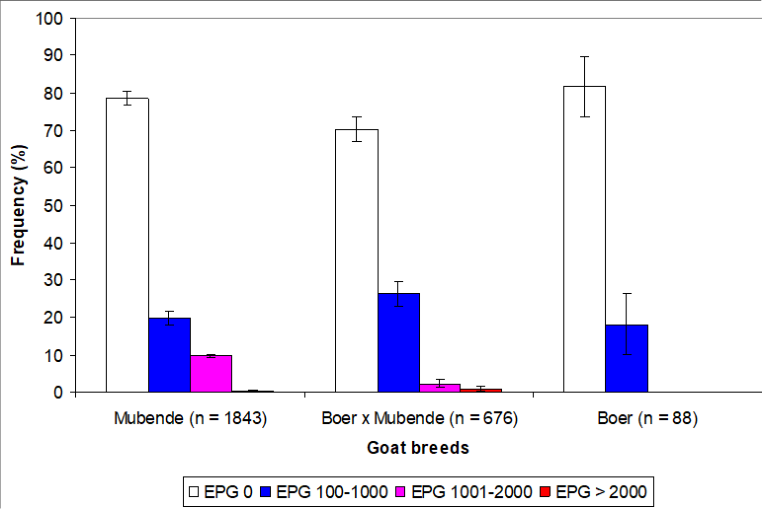 Figure 4
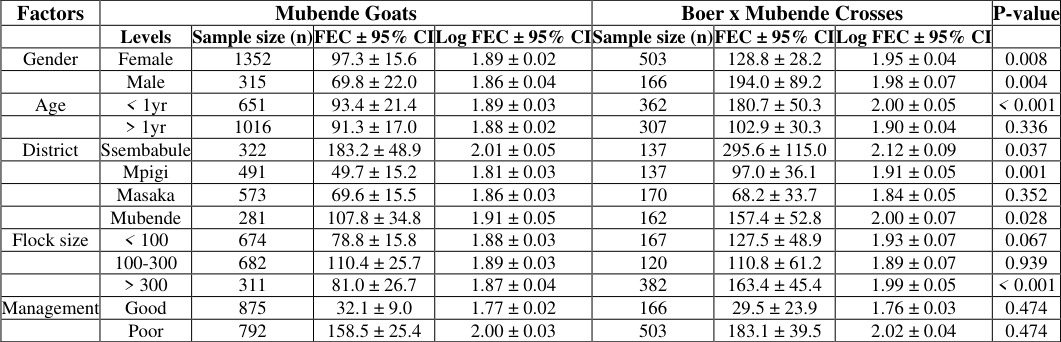 Table 2
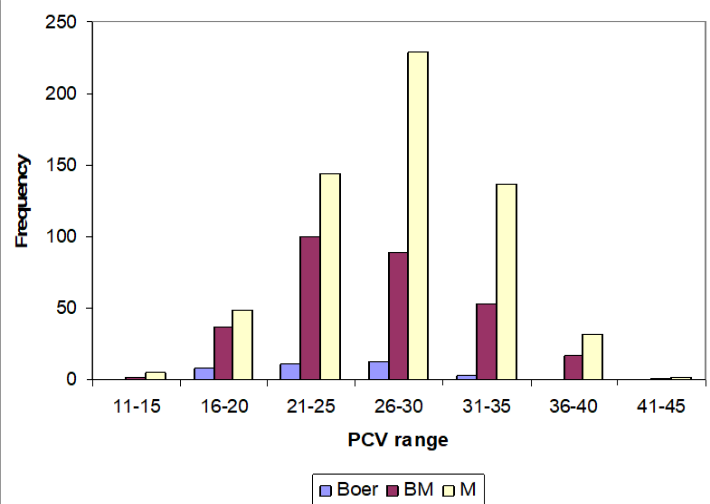 Figure 5
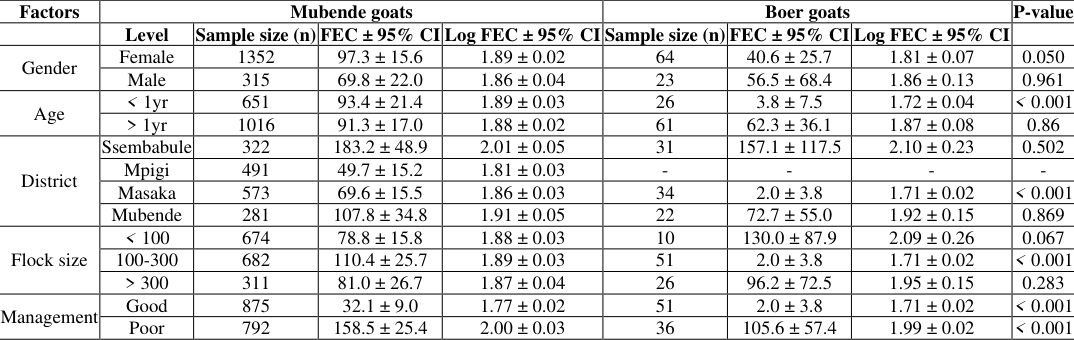 Table 3
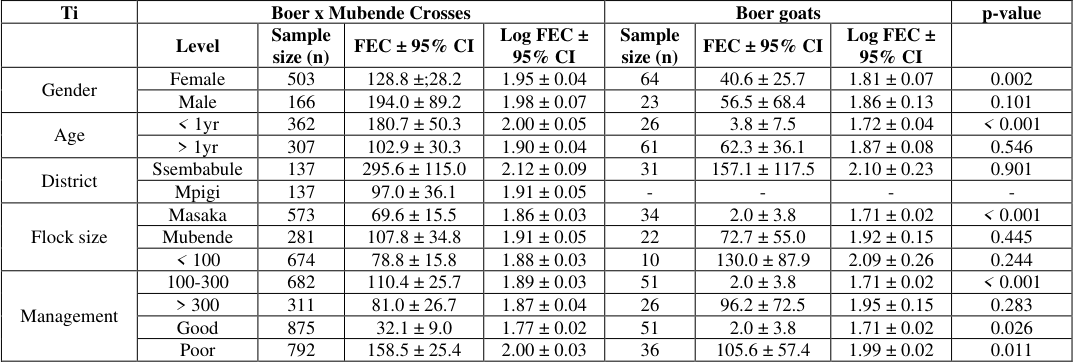 Table 4
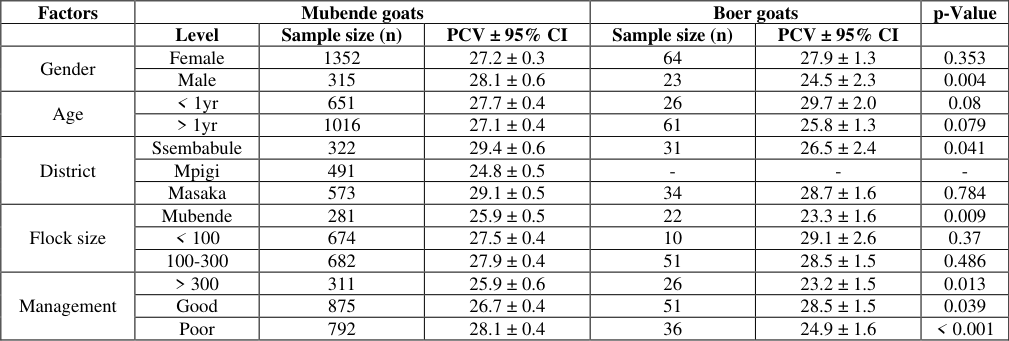 Table 5
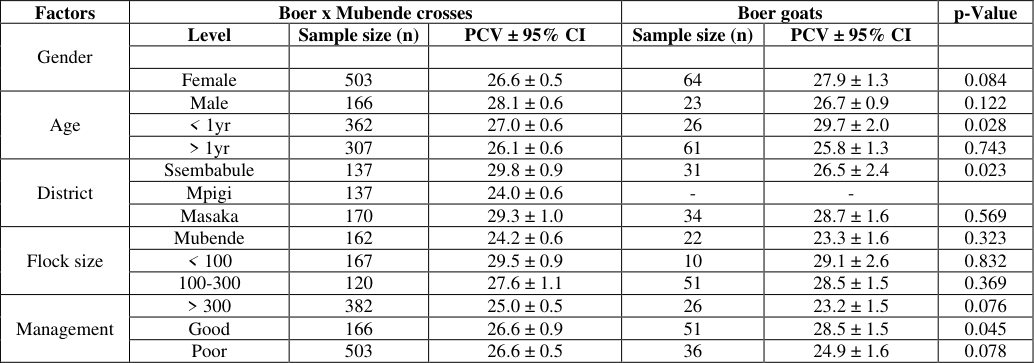 Table 6
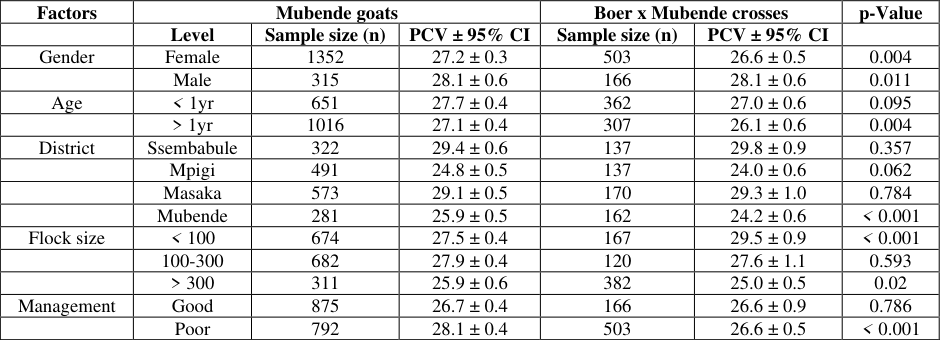 Table 7
Introduction
Gastrointestinal nematode (GIN) infections pose the greatest challenge to commercial goat production worldwide. In the tropics, GIN infections are the principal cause of mortality, retarded growth and general production losses in goats (Baker et al., 2001) [1] . Indigenous Mubende breed of goats in Uganda, a product of centuries of selection for traits adapted to harsh conditions, is increasingly being replaced by a more productive exotic Boer breed (Rege, 1999; Sewannyana, Oluka and Masaba, 2004) [2,3] . However, the Boer breed easily succumbs to the overwhelming disease challenge, especially gastrointestinal nematode infections to which the Mubende breed is adapted. Disease resistance is arguably one of the important traits possessed by indigenous breeds and is an important attribute of livestock in low-input livestock production systems (Gibson and Bishop, 2005) [4] . Such traits if identified are useful in breed improvement programs involving crossbreeding of productivity exotic breeds with indigenous breeds. The goat population in Uganda is currently estimated at 12.4 million goats. Goats are important in Uganda as producers of meat, as it is generally preferred over other meats. Socio-economically, goats play a traditional role as dowry and financial assets (Okello and Obwolo, 1984) [5] . In addition, goats provide resource-poor farmers, especially women, with income, manure, and animal protein in form of meat and milk.
However, the productivity of goats is constrained by parasitic infections, the most important of all being gastrointestinal nematode infections that cause production losses and the death of infected animals. Control of gastrointestinal nematode infections in goats in Uganda hugely relies on anthelmintic treatments (Magona and Musisi, 2002) [6] . However, anthelmintic treatments are prohibitively costly to many smallholder goat farmers. Moreover, present control strategies for ruminant parasitic nematodes worldwide are complicated by the problem of anthelmintic resistance, particularly in Haemonchus contortus (Van Wyk and Malan, 1988; Waller et al., 1996; Nsereko et al., 2012) [7,8,9] . This necessitates designing of alternative low-cost control strategies relying on breed resistance. However, little or no information has been documented about disease resistance among goat breeds in Uganda. A study was, therefore, conducted to understand whether variation in susceptibility to gastrointestinal nematode infections existed among Mubende, Boer and Boer x Mubende goats under field conditions.
Materials and Methods 2.1 Study area
The study was conducted in Ssembabule, Mpigi, Masaka and Mubende districts on commercial goat farms. All farms enlisted in the project for enhancing goat export in Uganda were selected for the study. The farms undertook crossbreeding of imported Boer goats with the indigenous Mubende goats. A total of 30 farms were visited including, seven in Ssembabule, nine in Mpigi district, eight in Masaka and six in Mubende district.
The main vegetation type in the study area is savannah grassland. The area receives 1200-1500 mm of rainfall annually, which is bimodal in distribution. There are two wet seasons (March to June and September to November) and two dry seasons (December to February and July to August). The daily mean minimum and mean maximum temperatures are 15 °C and 27 °C, respectively. Goats are kept under extensive grazing in rangelands in South-western Uganda in often well-fenced farms. They graze freely on pastures during the day and are housed in wooden structures with raised floors during the night.
Goat breed characteristics 2.2.1 Mubende goats
The Mubende goat (see Figure 1) is found in humid southern and central Uganda. It is adapted to Sub-humid and warm tropical Savannah climatic conditions (Sewannyana, Oluka and Masaba, 2004) [3] . The breed has promising meat and skin characteristics (Gall, 1981; Devendra and Burns, 1983) [10,11] . It has good reproductive and growth characteristics with a twinning rate of 30%; adult male live weights of 40 Kg; adult female live weight of 30 Kg; fecundity rates of 1.5 young per litter; and kidding intervals of 300 days (Mason and Maule, 1960; Sacker and Trail, 1966; Sewannyana, Oluka and Masaba, 2004) [12,13,3] . Birth weight of 1.98 Kg, weaning weight of 8.27 Kg at 16 weeks and daily pre-weaning growth rates of 56.11 Kg for Mubende goats have been reported under experimental conditions (Sewannyana, Oluka and Masaba, 2004) [3] .
Boer x Mubende crosses
Boer x Mubende crosses (see Figure 2) are reported to have the advantage of combining ability of the adaptation genes from Mubende breed and meat producing ability from the Boer breed (Sewannyana, Oluka and Masaba, 2004) [3] . Under experimental conditions, F 1 (50% Boer) Boer x Mubende crosses are reported to have birth weight of 1.91 Kg, weaning weight of 8.94 Kg at 16 weeks and daily pre-weaning growth rate of 62.77 Kg, and F 2 (75% Boer) Boer x Mubende crosses are reported to have birth weight of 2.06 Kg, weaning weight of 7.16 Kg at 16 weeks and a daily pre-weaning growth rate of 47.15 g/day (Sewannyana, Oluka and Masaba, 2004) [3] .
Boer goats
The South African Boer goat has been selected for high meat production and quality (Devandra and Burns, 1983; Jindal, 1984; Sewannyana, Oluka and Masaba, 2004) [11,14,3]
Sampling
A sample size of at least 384 goats was required per district based on an estimated prevalence of 50% and a 95% confidence interval (CI) at a 5% desired precision. The sample size was calculated using the formula n = 1.96 2 P (1-P)/d 2 derived from Thrusfield (1995) [17] with P = 0.5 and d = 0.05. Faecal samples were collected from a minimum of 384 goats per district. Goats were selected from identified farms, using systematic sampling strategy. Every second animal in the flock was sampled. For each animal sampled, its district, location, farm owner, farm flock size, breed, age, management and gender were recorded.
Collection and handling of faecal samples
The faecal sample was collected per rectum. Using gloved fingers, about 10 grams of sample were obtained from each goat and placed immediately in a plastic bag. The plastic bag was tightly held close to the faecal sample to keep off air. For identification, each sample was labelled with the details of the individual goat and farm before being put in a cold box containing ice packs. The samples were transported for laboratory analysis at the National Livestock Resources Research Institute (NaLIRRI), Tororo, Uganda within 12 hours. All samples were collected between 9-10 hours just before the goats were released for grazing each morning.
Detection of nematode eggs and estimation of faecal egg counts
Flotation method as described by Hansen and Perry 18 was used in the detection of nematode eggs. Parasitological identification of nematode eggs was performed using morphological features as described by Soulsby (1982) [19] . Using a modified McMaster technique, FEC was determined as number of eggs per gram (EPG) for each sample (Kaplan and Miller, 2006) [20] . A detection level of 100 EPG for the McMaster method was used.
Statistical Analysis
Descriptive statistics on the data were generated using the frequency functions of Excel. t-tests were used to compare mean values for faecal egg counts using GENSTAT (GENSTAT®, Version 13). P-values < 0.05 were considered significant. Multivariate linear regression was performed to assess which factors: breed, gender, age, district, flock size and level of management did influence the variance in faecal egg count and PCV values.
Results
The distribution of Mubende (n = 1667), Boer (n = 87) and Boer-Mubende (n = 669) goats sampled disaggregated by gender, age, district, flock size and management is shown in Table 1. Of all goats sampled (n =2423), 1,919 (79.2%) were females and 504 (20.8%) were males. In terms of age, 1039 (42.9%) goats were below 1 year, and 1384 (57.1%) goats were above 1 year. In terms of areas, 520 (21.5%), 628 (25.9%), 777 (32.0%) and 498 (20.6%) goats were sampled in Ssembabule, Mpigi, Masaka and Mubende districts, respectively. Of all goats sampled, 851(35.1%), 853(35.2%) and 719 (29.7%) belonged to small flocks (<100 goats), medium flocks (100-300 goats) and large flocks (>300 goats), respectively. In terms of management, 1092 (45%) goats were sampled from farms with good management, while 1331 (55%) goats were from farms with poor management. The multivariable linear regression model indicated that district had a highly significant effect (p<0.001), while age and flock size had significant effect (p<0.05) on FEC. The regression equation was: FEC = 178.8-27.6 AGE-29.23 DISTRICT+22.06 FLOCKSIZE. Age and district had negative effect while flock size had positive effect on FEC.
| Factors | — | Mubende Goats | — | Boer x Mubende Crosses | — | Boer Goats | — | Total |
|---|---|---|---|---|---|---|---|---|
| Levels | Sample size | Proportion % | Sample size | Proportion % | Sample size | Proportion % | ||
| Gender | Female | 1352 | 70.5 | 503 | 26.2 | 64 | 3.3 | 1,919 |
| Male | 315 | 62.5 | 166 | 32.9 | 23 | 4.6 | 504 | |
| Age | < 1yr | 651 | 62.7 | 362 | 34.8 | 26 | 2.5 | 1,039 |
| >1yr | 1016 | 73.4 | 307 | 22.2 | 61 | 4.4 | 1384 | |
| District | Ssembabule | 352 | 67.7 | 137 | 26.3 | 31 | 6.0 | 520 |
| Mpigi | 491 | 78.2 | 137 | 21.8 | - | - | 628 | |
| Masaka | 573 | 73.7 | 170 | 21.9 | 34 | 4.4 | 777 | |
| Mubende | 314 | 63.0 | 162 | 32.5 | 22 | 4.4 | 498 | |
| Flock size | < 100 | 674 | 79.2 | 167 | 19.6 | 10 | 1.2 | 851 |
| 100-300 | 682 | 80.0 | 120 | 14.1 | 51 | 5.9 | 853 | |
| > 300 | 311 | 43.3 | 382 | 53.1 | 26 | 3.6 | 719 | |
| Management | Good | 875 | 80.1 | 166 | 15.2 | 51 | 4.7 | 1092 |
| Poor | 792 | 59.5 | 503 | 37.8 | 36 | 2.7 | 1331 |
Table text extracted from the original PDF; superscript letters are shown inline. The original table image is below.
View original table image
The overall regression fit was highly significant (p<0.001). In addition, multivariable linear regression model indicated Boer x Mubende had highly significant (p<0.001) effect on FEC, but Boer did not (P = 0.17). Boer and Boer x Mubende were responsible for 60% of the variance in FEC. The regression equation was: FEC =92.3 +47.4 Boer+52.7 Boer-Mubende, suggesting the factors, Boer and Boer x Mubende had positive effect on FEC. The overall regression fit was highly significant (p<0.001). Furthermore, the multivariable linear regression model indicated Mubende had highly significant (p<0.001) effect, while Boer had a significant (p<0.05) effect on FEC. Both factors, Mubende and Boer were responsible for 60% of the variance in FEC. The regression equation was: FEC =145-52.7 MUBENDE -100.2 Boer, suggesting both factors, Mubende and Boer had negative effect on FEC. The overall regression fit was highly significant (p<0.001).
In addition, district and flock size had highly significant effect (p<0.001), while age had significant effect (p<0.05) on PCV.
The regression equation was: PCV = 31.6-0.6 AGE-0. In Table 2, Mubende goats are compared to Boer x Mubende crosses in terms of mean faecal egg counts and mean Log faecal egg counts disaggregated by gender, age, district (location), flock size and management. Female Boer x Mubende crosses had significantly higher (p<0.05) mean faecal egg counts than female Mubende goats. Equally, male Boer x Mubende crosses had significantly higher (p<0.05) mean faecal egg counts than male Mubende goats.
| Factors | Mubende Goats | — | — | — | Boer x Mubende Crosses | — | — | P-value |
|---|---|---|---|---|---|---|---|---|
| Levels | Sample size (n) | FEC ± 95% CI | Log FEC ± 95% CI | Sample size (n) | FEC ± 95% CI | Log FEC ± 95% CI | ||
| Gender | Female | 1352 | 97.3 ± 15.6 | 1.89 ± 0.02 | 503 | 128.8 ± 28.2 | 1.95 ± 0.04 | 0.008 |
| Male | 315 | 69.8 ± 22.0 | 1.86 ± 0.04 | 166 | 194.0 ± 89.2 | 1.98 ± 0.07 | 0.004 | |
| Age | < 1yr | 651 | 93.4 ± 21.4 | 1.89 ± 0.03 | 362 | 180.7 ± 50.3 | 2.00 ± 0.05 | < 0.001 |
| > 1yr | 1016 | 91.3 ± 17.0 | 1.88 ± 0.02 | 307 | 102.9 ± 30.3 | 1.90 ± 0.04 | 0.336 | |
| District | Ssembabule | 322 | 183.2 ± 48.9 | 2.01 ± 0.05 | 137 | 295.6 ± 115.0 | 2.12 ± 0.09 | 0.037 |
| Mpigi | 491 | 49.7 ± 15.2 | 1.81 ± 0.03 | 137 | 97.0 ± 36.1 | 1.91 ± 0.05 | 0.001 | |
| Masaka | 573 | 69.6 ± 15.5 | 1.86 ± 0.03 | 170 | 68.2 ± 33.7 | 1.84 ± 0.05 | 0.352 | |
| Mubende | 281 | 107.8 ± 34.8 | 1.91 ± 0.05 | 162 | 157.4 ± 52.8 | 2.00 ± 0.07 | 0.028 | |
| Flock size | < 100 | 674 | 78.8 ± 15.8 | 1.88 ± 0.03 | 167 | 127.5 ± 48.9 | 1.93 ± 0.07 | 0.067 |
| 100-300 | 682 | 110.4 ± 25.7 | 1.89 ± 0.03 | 120 | 110.8 ± 61.2 | 1.89 ± 0.07 | 0.939 | |
| > 300 | 311 | 81.0 ± 26.7 | 1.87 ± 0.04 | 382 | 163.4 ± 45.4 | 1.99 ± 0.05 | < 0.001 | |
| Management | Good | 875 | 32.1 ± 9.0 | 1.77 ± 0.02 | 166 | 29.5 ± 23.9 | 1.76 ± 0.03 | 0.474 |
| Poor | 792 | 158.5 ± 25.4 | 2.00 ± 0.03 | 503 | 183.1 ± 39.5 | 2.02 ± 0.04 | 0.474 |
Table text extracted from the original PDF; superscript letters are shown inline. The original table image is below.
View original table image
In addition, Boer x Mubende crosses younger than one year had significantly higher (p<0.001) mean faecal egg counts than their counterparts among the Mubende goats. Furthermore, Boer x Mubende crosses in Ssembabule, Mpigi and Mubende districts had significantly higher (p<0.05) mean faecal egg counts than Mubende goats. Boer x Mubende crosses from large flocks (> 300) had significantly higher (p<0.001) mean faecal egg counts than Mubende goats. [21,6,22,23] . Variation of worm infection risk according to districts or locations has been reported by others (Ratanapob et al. 2012) [24] . This has been attributed to variations in temperature and rainfall patterns in different locations that negatively influence patterns of parasite infective stages and their severity (Ratanapob et al., 2012) [24] . This as well concurred with other reports by Kantzoura et al. (2011) [25] , Mushonga et al. (2018) [26] and Namutosi et al. (2020) [27] . Increasing flock size has been reported to increase worm egg shedding on pasture as stocking density and level of intensification increases on such farms (Magona and Musisi, 2002; Namutosi et al., 2020) [6,27] . Boer x Mubende goats and Mubende goats had highly significant negative effect on worm infection while Boer goats exhibited significant negative effect on FEC, suggesting that different goat breeds exhibited varying levels of host resistance to worm infection. This is in line with previous reports by others (Makun et al., 2008; Nsereko et al., 2015) [28, 29] . Location (district) and flock size had highly significant negative effect, while age had significant negative effect on PCV values. This was attributed to variation in worm infection intensity on pasture caused by variation in temperature and rainfall in different locations and increasing worm egg shedding on pasture as flock size increases. Increasing severity in gastrointestinal nematode infection in goats manifests anaemia associated with lower PCV values. Younger goats with lower immunity to worm infection experienced higher worm burden and hence lower PCV values and anaemia. Goat infection with Haemonchus contortus has been reported to cause a significant reduction in the erythrocyte counts, haemoglobin concentrations and PCV values (Alam et al., 2020) [30] . [31,32,33] . However, at EPG higher than 1000, Boer goats could only be maintained healthy using regular worm control. Interestingly, Boer goats sampled did not have EPG of 1000 and above, suggesting regular worm control targeting the highly susceptible Boer goats was undertaken on farms visited. Generally, Boer x Mubende crosses were more susceptible to worm infection than Mubende goats, given significantly higher FEC exhibited compared to their counterpart Mubende goats. This is in line with earlier reports (Nsereko et al., 2015) [29] . [29] . Boer x Mubende goats exhibited highly significant negative effect, while Mubende goats exhibited a significant positive effect on PCV values. PCV of 15% and below, normally denoting anaemic animals, were rare amongst Boer goats but limited among Mubende goats and Boer x Mubende crosses. Suggesting worm control was practised especially against clinical cases of gastrointestinal nematode infection amongst the goats in line with previous reports (Magona and Musisi, 2002) [6] . Generally, Mubende goats had significantly higher mean PCV values than Boer goats. Suggesting Mubende goats, an indigenous goat breed, had host resistance against gastrointestinal nematode infection (Gibson and Bishop, 2005; Nsereko et al., 2015) [4,29] . Host resistance allowed Mubende goats cope with gastrointestinal nematode infection. On contrast, Boer goats largely relied on good management and regular worm control for survival in the face of gastrointestinal nematode infection. Worm control hugely relies on anthelmintic treatment in Uganda (Magona and Musisi, 2002) [6] . Data suggested that Boer x Mubende crosses exhibited breed resistance to gastrointestinal nematode infection and better minimized associated anaemic effects. Contrastingly, Boer goats largely relied on less exposure to worm infection or good management and worm control to cope with anaemic conditions. Mubende goats had significantly higher mean PCV values than Boer x Mubende crosses. Suggesting Mubende goats were less susceptible to gastrointestinal nematode infection and were more tolerant to the associated anaemic effects than Boer x Mubende crosses. This was attributed to the adaptation gene of the Mubende goat (Sewannyana, Oluka, Masaba, 2004) [3] .
Conclusion
The increasing age of goats had a suppression effect on faecal worm egg counts. Different areas or districts had different worm infection intensity on pastures that dictated different levels of worm infection risk to the goats. The increasing size of goat flocks led to increasing worm egg shedding on pasture and increased faecal worm egg counts.
Acknowledgement
We thank Joseph Muboli and Patrick Odyek for their technical assistance. We thank Dr. Charles Peter Otim, the former Director of Livestock Health Research Institute, Tororo, Uganda for his support during the study. In addition, we thank the District Veterinary staff from Ssembabule, Mpigi, Masaka, and Mubende districts for their incredible support during the study.
Figures and tables from the paper
| Factors | Mubende goats | — | — | — | Boer goats | — | — | P-value |
|---|---|---|---|---|---|---|---|---|
| Level | Sample size (n) | FEC ± 95% CI | Log FEC ± 95% CI | Sample size (n) | FEC ± 95% CI | Log FEC ± 95% CI | ||
| Gender | Female | 1352 | 97.3 ± 15.6 | 1.89 ± 0.02 | 64 | 40.6 ± 25.7 | 1.81 ± 0.07 | 0.050 |
| Male | 315 | 69.8 ± 22.0 | 1.86 ± 0.04 | 23 | 56.5 ± 68.4 | 1.86 ± 0.13 | 0.961 | |
| Age | < 1yr | 651 | 93.4 ± 21.4 | 1.89 ± 0.03 | 26 | 3.8 ± 7.5 | 1.72 ± 0.04 | < 0.001 |
| > 1yr | 1016 | 91.3 ± 17.0 | 1.88 ± 0.02 | 61 | 62.3 ± 36.1 | 1.87 ± 0.08 | 0.86 | |
| District | Ssembabule | 322 | 183.2 ± 48.9 | 2.01 ± 0.05 | 31 | 157.1 ± 117.5 | 2.10 ± 0.23 | 0.502 |
| Mpigi | 491 | 49.7 ± 15.2 | 1.81 ± 0.03 | - | - | - | - | |
| Masaka | 573 | 69.6 ± 15.5 | 1.86 ± 0.03 | 34 | 2.0 ± 3.8 | 1.71 ± 0.02 | < 0.001 | |
| Mubende | 281 | 107.8 ± 34.8 | 1.91 ± 0.05 | 22 | 72.7 ± 55.0 | 1.92 ± 0.15 | 0.869 | |
| Flock size | < 100 | 674 | 78.8 ± 15.8 | 1.88 ± 0.03 | 10 | 130.0 ± 87.9 | 2.09 ± 0.26 | 0.067 |
| 100-300 | 682 | 110.4 ± 25.7 | 1.89 ± 0.03 | 51 | 2.0 ± 3.8 | 1.71 ± 0.02 | < 0.001 | |
| > 300 | 311 | 81.0 ± 26.7 | 1.87 ± 0.04 | 26 | 96.2 ± 72.5 | 1.95 ± 0.15 | 0.283 | |
| Management | Good | 875 | 32.1 ± 9.0 | 1.77 ± 0.02 | 51 | 2.0 ± 3.8 | 1.71 ± 0.02 | < 0.001 |
| Poor | 792 | 158.5 ± 25.4 | 2.00 ± 0.03 | 36 | 105.6 ± 57.4 | 1.99 ± 0.02 | < 0.001 |
Table text extracted from the original PDF; superscript letters are shown inline. The original table image is below.
View original table image
| Ti | Boer x Mubende Crosses | — | — | — | Boer goats | — | — | p-value |
|---|---|---|---|---|---|---|---|---|
| Level | Sample size (n) | FEC ± 95% CI | Log FEC ± 95% CI | Sample size (n) | FEC ± 95% CI | Log FEC ± 95% CI | ||
| Gender | Female | 503 | 128.8 ±;28.2 | 1.95 ± 0.04 | 64 | 40.6 ± 25.7 | 1.81 ± 0.07 | 0.002 |
| Male | 166 | 194.0 ± 89.2 | 1.98 ± 0.07 | 23 | 56.5 ± 68.4 | 1.86 ± 0.13 | 0.101 | |
| Age | < 1yr | 362 | 180.7 ± 50.3 | 2.00 ± 0.05 | 26 | 3.8 ± 7.5 | 1.72 ± 0.04 | < 0.001 |
| > 1yr | 307 | 102.9 ± 30.3 | 1.90 ± 0.04 | 61 | 62.3 ± 36.1 | 1.87 ± 0.08 | 0.546 | |
| District | Ssembabule | 137 | 295.6 ± 115.0 | 2.12 ± 0.09 | 31 | 157.1 ± 117.5 | 2.10 ± 0.23 | 0.901 |
| Mpigi | 137 | 97.0 ± 36.1 | 1.91 ± 0.05 | - | - | - | - | |
| Flock size | Masaka | 573 | 69.6 ± 15.5 | 1.86 ± 0.03 | 34 | 2.0 ± 3.8 | 1.71 ± 0.02 | < 0.001 |
| Mubende | 281 | 107.8 ± 34.8 | 1.91 ± 0.05 | 22 | 72.7 ± 55.0 | 1.92 ± 0.15 | 0.445 | |
| < 100 | 674 | 78.8 ± 15.8 | 1.88 ± 0.03 | 10 | 130.0 ± 87.9 | 2.09 ± 0.26 | 0.244 | |
| Management | 100-300 | 682 | 110.4 ± 25.7 | 1.89 ± 0.03 | 51 | 2.0 ± 3.8 | 1.71 ± 0.02 | < 0.001 |
| > 300 | 311 | 81.0 ± 26.7 | 1.87 ± 0.04 | 26 | 96.2 ± 72.5 | 1.95 ± 0.15 | 0.283 | |
| Good | 875 | 32.1 ± 9.0 | 1.77 ± 0.02 | 51 | 2.0 ± 3.8 | 1.71 ± 0.02 | 0.026 | |
| Poor | 792 | 158.5 ± 25.4 | 2.00 ± 0.03 | 36 | 105.6 ± 57.4 | 1.99 ± 0.02 | 0.011 |
Table text extracted from the original PDF; superscript letters are shown inline. The original table image is below.
View original table image
| Factors | Mubende goats | — | — | Boer goats | — | p-Value |
|---|---|---|---|---|---|---|
| Level | Sample size (n) | PCV ± 95% CI | Sample size (n) | PCV ± 95% CI | ||
| Gender | Female | 1352 | 27.2 ± 0.3 | 64 | 27.9 ± 1.3 | 0.353 |
| Male | 315 | 28.1 ± 0.6 | 23 | 24.5 ± 2.3 | 0.004 | |
| Age | < 1yr | 651 | 27.7 ± 0.4 | 26 | 29.7 ± 2.0 | 0.08 |
| > 1yr | 1016 | 27.1 ± 0.4 | 61 | 25.8 ± 1.3 | 0.079 | |
| District | Ssembabule | 322 | 29.4 ± 0.6 | 31 | 26.5 ± 2.4 | 0.041 |
| Mpigi | 491 | 24.8 ± 0.5 | - | - | - | |
| Masaka | 573 | 29.1 ± 0.5 | 34 | 28.7 ± 1.6 | 0.784 | |
| Flock size | Mubende | 281 | 25.9 ± 0.5 | 22 | 23.3 ± 1.6 | 0.009 |
| < 100 | 674 | 27.5 ± 0.4 | 10 | 29.1 ± 2.6 | 0.37 | |
| 100-300 | 682 | 27.9 ± 0.4 | 51 | 28.5 ± 1.5 | 0.486 | |
| Management | > 300 | 311 | 25.9 ± 0.6 | 26 | 23.2 ± 1.5 | 0.013 |
| Good | 875 | 26.7 ± 0.4 | 51 | 28.5 ± 1.5 | 0.039 | |
| Poor | 792 | 28.1 ± 0.4 | 36 | 24.9 ± 1.6 | < 0.001 |
Table text extracted from the original PDF; superscript letters are shown inline. The original table image is below.
View original table image
| Factors | Boer x Mubende crosses | — | — | Boer goats | — | p-Value |
|---|---|---|---|---|---|---|
| Gender | Level | Sample size (n) | PCV ± 95% CI | Sample size (n) | PCV ± 95% CI | |
| Female | 503 | 26.6 ± 0.5 | 64 | 27.9 ± 1.3 | 0.084 | |
| Age | Male | 166 | 28.1 ± 0.6 | 23 | 26.7 ± 0.9 | 0.122 |
| < 1yr | 362 | 27.0 ± 0.6 | 26 | 29.7 ± 2.0 | 0.028 | |
| > 1yr | 307 | 26.1 ± 0.6 | 61 | 25.8 ± 1.3 | 0.743 | |
| District | Ssembabule | 137 | 29.8 ± 0.9 | 31 | 26.5 ± 2.4 | 0.023 |
| Mpigi | 137 | 24.0 ± 0.6 | - | - | ||
| Masaka | 170 | 29.3 ± 1.0 | 34 | 28.7 ± 1.6 | 0.569 | |
| Flock size | Mubende | 162 | 24.2 ± 0.6 | 22 | 23.3 ± 1.6 | 0.323 |
| < 100 | 167 | 29.5 ± 0.9 | 10 | 29.1 ± 2.6 | 0.832 | |
| 100-300 | 120 | 27.6 ± 1.1 | 51 | 28.5 ± 1.5 | 0.369 | |
| Management | > 300 | 382 | 25.0 ± 0.5 | 26 | 23.2 ± 1.5 | 0.076 |
| Good | 166 | 26.6 ± 0.9 | 51 | 28.5 ± 1.5 | 0.045 | |
| Poor | 503 | 26.6 ± 0.5 | 36 | 24.9 ± 1.6 | 0.078 |
Table text extracted from the original PDF; superscript letters are shown inline. The original table image is below.
View original table image
| Factors | Mubende goats | — | — | Boer x Mubende crosses | — | p-Value |
|---|---|---|---|---|---|---|
| Level | Sample size (n) | PCV ± 95% CI | Sample size (n) | PCV ± 95% CI | ||
| Gender | Female | 1352 | 27.2 ± 0.3 | 503 | 26.6 ± 0.5 | 0.004 |
| Male | 315 | 28.1 ± 0.6 | 166 | 28.1 ± 0.6 | 0.011 | |
| Age | < 1yr | 651 | 27.7 ± 0.4 | 362 | 27.0 ± 0.6 | 0.095 |
| > 1yr | 1016 | 27.1 ± 0.4 | 307 | 26.1 ± 0.6 | 0.004 | |
| District | Ssembabule | 322 | 29.4 ± 0.6 | 137 | 29.8 ± 0.9 | 0.357 |
| Mpigi | 491 | 24.8 ± 0.5 | 137 | 24.0 ± 0.6 | 0.062 | |
| Masaka | 573 | 29.1 ± 0.5 | 170 | 29.3 ± 1.0 | 0.784 | |
| Mubende | 281 | 25.9 ± 0.5 | 162 | 24.2 ± 0.6 | < 0.001 | |
| Flock size | < 100 | 674 | 27.5 ± 0.4 | 167 | 29.5 ± 0.9 | < 0.001 |
| 100-300 | 682 | 27.9 ± 0.4 | 120 | 27.6 ± 1.1 | 0.593 | |
| > 300 | 311 | 25.9 ± 0.6 | 382 | 25.0 ± 0.5 | 0.02 | |
| Management | Good | 875 | 26.7 ± 0.4 | 166 | 26.6 ± 0.9 | 0.786 |
| Poor | 792 | 28.1 ± 0.4 | 503 | 26.6 ± 0.5 | < 0.001 |
Table text extracted from the original PDF; superscript letters are shown inline. The original table image is below.
View original table image
References
24 in the original paper- Baker RL, Audho JO, Aduda EO, Thorpe W. Genetic resistance to gastro-intestinal nematode parasites in Gala and small East African goats in the sub-humid tropics. Animal Science. 2001 Apr;73(1):61-70.
- Rege JEO. The state of African cattle genetic resources I. Classification framework and identification of threatened and extinct breeds. Animal Genetic Resources Information. 1999 Apr;25:1-25.
- Sewannyana E, Oluka J, Masaba JK. Growth and performance of indigenous and crossbred goats. Uganda Journal of Agricultural Sciences. 2004;9(1):537-42.
- Gibson JP, Bishop SC. Use of molecular markers to enhance resistance of livestock to disease: A global approach. Revue Scientifique et technique (International Office of Epizootics). 2005 Apr 1;24(1):343-353.
- Okello KL, Obwolo MJ. Uganda: Review of the potentialities of goat production. World Animal Review. 1984;53:27-32.
- Magona JW, Musisi G. Influence of age, grazing system, season and agroclimatic zone on the prevalence and intensity of gastrointestinal strongylosis in Ugandan goats. Small Ruminant Research. 2002;44:187-192.
- Van Wyk JA, Malan FS. Resistance of field strains of Haemonchus contortus to ivermectin, closantel, rafoxanide and the benzimidazoles in South Africa. Vet. Rec. 1988;123:226-228. http://www.tropentag.de/2011/abstracts/full/1166.pdf
- Waller P, Echevarria F, Eddi C, Macial S, Nari A, Hansen JW. The prevalence of anthelmintic resistance in nematode parasites of sheep in Southern Latin America: general overview. Veterinary Parasitology. 1996;62:181187.
- Nsereko G, Emudong P, Magona JW, Odoch T, OkweeAcai J. Anthelmintic efficacy of Albendazole, Levamisole and Ivermectin against gastrointestinal nematode (GIN) infections in goats on natural pastures in Gomba District, Uganda. Uganda Journal of Agricultural Sciences. 2013;14(1):75-85.
- Sacker GD, Trail JCM. Production characteristics of a herd of East African Mubende goats. Tropical Agriculture. 1966;43:43-51.
- Babigumira BM, Galukande E, Nakimbugwe H, Kifudde W, Semambo DNK. Comparison between Mubende and Boer x Mubende goat crosses based on biometric measurements and weight-for-age in Uganda, 2011. https://www.tropentag.de/2011/abstracts/full/,1166. pdf •
- Onzima R, Ahesibwe AR, Katali BK, Kanis E, van Arendonk JAM. Economic analysis of cross breeding programs for indigenous goat breeds in Uganda. Proceedings, 10 th World Congress on Genetics Applied to Livestock Production. Vancouver, Canada, 17 th -22 nd , 2014.
- Assoku RKG. Studies of parasitic helminths of sheep and goats in Ghana. Bulletin of Animal Health and Production in African. 1981;29(1):1-0.
- Sohail M, Nauman-ul-Islam M, Shah SSA, Shah IA, Raziq A, Khan MI. Incidence of gastrointestinal parasites in beetal goats at District Peshawar, Pakistan. Advances in Animal and Veterinary Sciences. 2017;5(5):205-7.
- Poddar PR, Begum N, Alim MA, Dey AR, Hossain MS, Labony SS. Prevalence of gastrointestinal helminths of sheep in Sherpur, Bangladesh. Journal of Advanced Veterinary and Animal Research. 2017;4(3):274-280.
- Ratanapob N, Arunvipas P, Kasemsuwan S, Phimpraphai W, Panneum S. Prevalence and risk factors for intestinal parasite infection in goats raised in Nakhom Pathom Province, Thailand. Tropical Animal Health Production. 2012 Apr;44(4):741-5.
- Kantzoura V, Kouam MK, Theodoropoulou H, Feidas H, Theodoropoulos G. Prevalence and Risk Factors of Gastrointestinal Parasitic Infections in Small Ruminants in the Greek Temperate Mediterranean Environment. Journal of Veterinary and Animal Science. 2012;2(1):2533. https://doi.org/10.4236/ ojvm.2012.21005.
- Mushonga B, Habumugisha D, Kandiwa E, Madzingira O, Samkange A, Segwagwe BE, et al., Prevalence of Haemonchus contortus infections in sheep and goats in Nyagatare District, Rwanda. Hindawi Journal of Veterinary Medicine 2018 (9). Article ID 3602081 http:// doi.org/10.1155/2018/3602081.
- Namutosi W, Higenyi J, Elizabeth Kizito E, Omodo M. Prevalence and risk factors of gastrointestinal parasite infection in goats in Sironko district, Eastern Uganda. International Journal of Veterinary Sciences and Animal Husbandry. 2020;5(3):27-35.
- Makun HJ, Ajanusi JO, Lakpini CAM, Ehoche OW, Rekwot PI. Response of Red Sokoto and Sahelian goats to trickle Haemonchus contortus infection. Journal of Biological Sciences. 2008;8(4):753-759.
- Nsereko G, Emudong P, Mulindwa H, Okwee-Acai J. Prevalence of common gastro-intestinal nematode infections in commercial goat farms in Central Uganda. Uganda Journal of Agricultural Sciences. 2015;6(1):99106.
- Rasha TM, Alam Eman AA, Hassanen Shefaa AM, ElMandrawy. Haemonchus contortus infection in Sheep and Goats: alterations in haematological, biochemical, immunological, trace element and oxidative stress markers. Journal of Applied Animal Research. 2020;48(1):357-364. DOI: 10.1080/09712119.2020.1802281.
- Baker RL, Nagda S, Rodriguez-Zas SL, Southey BR, Audho JO, Aduda EO, et al. Resistance and resilience to gastrointestinal nematode parasites and relationships with productivity of Red Maasai, Dorper and Red Maasai' Dorper crossbred lambs in the sub-humid tropics. British Society of Animal Science. 2003 Feb;76(1):119-36.
- Okwee-Acai J, Ssajjakambwe P, Okech SG, Agwai B, Ekakoro E, Acon J. Haemonchosis associated mortalities and treatment of severe anaemia by syringe infusion of blood in Boer goats in a model breeding farm in Lyantonde District. Uganda. African Journal of Animal and Biomedical Sciences. 2010;5(1):80-84.
Cited by 1
From OpenAlex, OpenCitations and reference lists read by Scinovex
- Enhancing diagnostic accuracy and health monitoring in goats of Sub-Saharan Africa: the role of haematological parameters and their molecular genetics ↗
D. Nemukula, Khathutshelo Agree Nephawe, Bohani Joseph Mtileni, K. Mdladla, Takalani Judas Mpofu · Frontiers in Animal Science · 2026
Haematological markers are extensively utilised as diagnostic and monitoring tools for evaluating health, physiological state, and disease conditions in goats. This review integrates existing literature on haematological parameters in goats, with a particular emphasis on Sub-Saharan Africa, where goats play a central role in smallholder livelihoods, food security, and climate resilience. The literature indicates significant differences in blood values among…
❝ 0PDF