
Research article · 2022 · Full text
International Journal of Veterinary Sciences and Animal HusbandryFarmer-led protected zero-grazed dairy cattle initiative in tsetse-infested areas of Southeast Uganda
Volume 7(3) · Pages 25–37 · DOI: 10.22271/veterinary.2022.v7.i3a.419 ↗
Research areasTrypanosoma species research and implicationsVector-Borne Animal Diseases
Abstract
Author-writtenA farmer-led protected zero-grazed dairy cattle initiative, involving pyrethroid treated netting around zero-grazing cowsheds, was implemented over a four-year period in tsetse-infested areas of Southeast Uganda. The pyrethroid treated netting was intended to prevent dairy cattle against tsetse bites and consequently transmission of trypanosomosis, while boosting milk production as an economic venture. A longitudinal study was conducted in six districts, including Budaka, Busia, Iganga, Manafwa, Mayuge and Tororo, during which a total of 184 protected zero-grazing units holding 289 dairy cattle were visited five times. The prevalence of trypanosomosis, mortality, mean packed cell volume (PCV), status of netting, spraying practices, and pasture and legume feed status, cowshed hygiene status, and milk yield were monitored. The findings revealed low prevalence of trypanosomosis among dairy cattle (1.0-5.5%), due to Trypanosoma brucei (0.0-0.4%), Trypanosoma congolense (0.0-0.7%) and Trypanosoma vivax (0.4-3.4%) infections. Only 25 adult cattle and 40 calves were reported dead. Dairy cattle had good health, given high mean PCV values (27.7 - 30.6). 99.2% and 100.0% of the zero-grazing units had lost netting by visit IV and V, respectively. By the second to the fourth year, prevention of dairy cattle from tsetse or tick bites hugely relied on spraying because all zero-grazing units had lost netting. Dual tsetse and tick control was practised by 66.9% of the 184 zero-grazing units, while only 33.1% of the units applied tick-selective control. Correct spraying intervals were observed by 57.8% of the zero-grazing units. Most zero-grazing units (range 67.9-97.5%) had sufficient pasture, while few units (range 17.9-34.8%) had sufficient legumes. Poorest cowshed hygiene was observed in zero-grazing units in Budaka district (93.1%), followed by Busia district (33.3%), Iganga district (31.1%), Mayuge district (12.1%), Tororo district (10.0%) and Manafwa district (6.3%).The best average milk yield per cow per day was registered in Iganga district (6.2 L-8.7 L), followed by Mayuge district (4.5 L- 8.2 L), Manafwa district (4.5 L-6.2 L), Busia district (4.0 L-6.3 L), Tororo district (3.3 L-6.7 L), and Budaka district (3.7 L-6.0 L). Overall average milk yield per cow per day of 5.0 L to 6.4 L across visits with a minimum of 0.5 L and maximum of 19.0 L per cow per day were achieved. In conclusion, pyrethroid treated netting around zero-grazing units supplemented with spraying of cattle effectively protected dairy cattle against trypanosomosis and maintained their good health. However, farmers’ observation indicated that as netting became older, it became more fragile. Larger nets of 1.5 m high had a longer duration of 6 to 8 months than smaller nets of 1.0 m high (shorter duration of 3 to 4 months). Replacement of netting for all zero-grazing units was desirable after the first year of installation, however, farmers could not afford the cost of 100,000 Uganda shillings (approx. USD 30) per zero-grazing unit.
Summary
Source-checkedPlain-language reading of the full paper, prepared with AI and checked against the text. Each point links to the authors' own words.
Why it matters
- Pyrethroid-treated netting is used in zero-grazing cowsheds to protect dairy cattle from tsetse fly bites, which prevents the transmission of trypanosomosis and aims to increase milk production for economic gain. View evidence ↗
- Previous control efforts in Southeast Uganda typically used a 'One Health' approach, targeting both animal and human forms of trypanosomosis. View evidence ↗
The question
- The study aimed to evaluate the effectiveness of a farmer-led protected zero-grazing initiative by monitoring trypanosomosis prevalence, cattle health (PCV), milk yield, netting durability, and farmer management practices. View evidence ↗
What they did
- The longitudinal study monitored 289 dairy cattle across 184 protected zero-grazing units over five separate visits. View evidence ↗
- The research was conducted in six districts of Southeast Uganda: Budaka, Busia, Iganga, Manafwa, Mayuge, and Tororo. View evidence ↗
- Trypanosome detection was performed on blood samples from the jugular vein using the Haematocrit Centrifugation Technique (HCT) and the Buffy Coat Technique (BCT). View evidence ↗
What they found
- The prevalence of trypanosomosis was low, ranging from 1.0% to 5.5%, with T. vivax being the most common species (0.4-3.4%). View evidence ↗
- Cattle health was generally good, as indicated by mean packed cell volume (PCV) values between 27.7 and 30.6. View evidence ↗
- The protective netting was not durable; 99.2% of units had lost their netting by the fourth visit, and 100% had lost it by the fifth visit. View evidence ↗
- Most farmers (66.9%) used acaricides for dual tsetse and tick control, while 33.1% used tick-selective control. View evidence ↗
- The overall average milk yield across the initiative ranged from 5.0 to 6.4 liters per cow per day. View evidence ↗
- While most units had sufficient pasture (67.9-97.5%), very few had sufficient legume feed (17.9-34.8%). View evidence ↗
- Cowshed hygiene varied by district, with Budaka having the highest rate of poor hygiene (93.1%) and Manafwa the lowest (6.3%). View evidence ↗
What it means
- The authors conclude that combining pyrethroid-treated netting with periodic cattle spraying effectively protects dairy cattle from trypanosomosis and maintains health. View evidence ↗
- A significant limitation is the cost of netting replacement (approx. USD 30), which farmers could not afford despite the need to replace nets after the first year. View evidence ↗
Visual summary
1 visualsIllustrations explain the paper; charts are replotted from the paper's own table values.
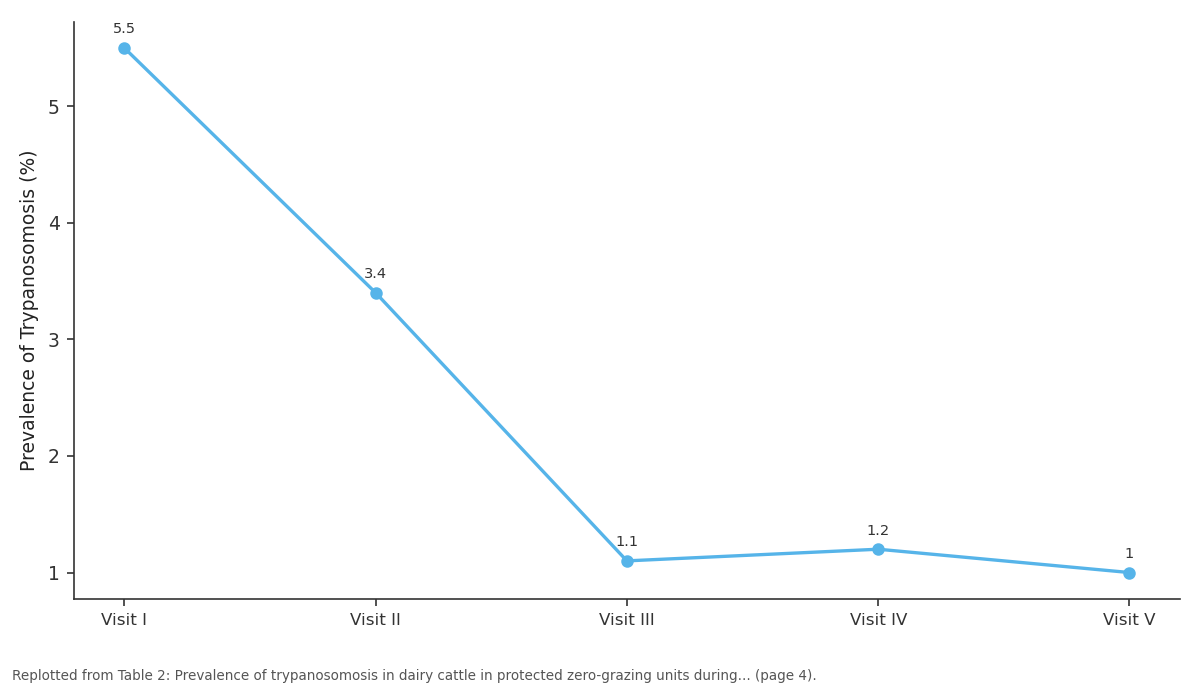
Dairy Cattle Categories Tested in the...: Visit I vs Visit II vs Visit III vs Visit IV vs Visit V
Replotted from Table 2 (page 4) of the original paper. Every bar is the paper's own table value.
View source evidence ↗Figures & tables
From the original paper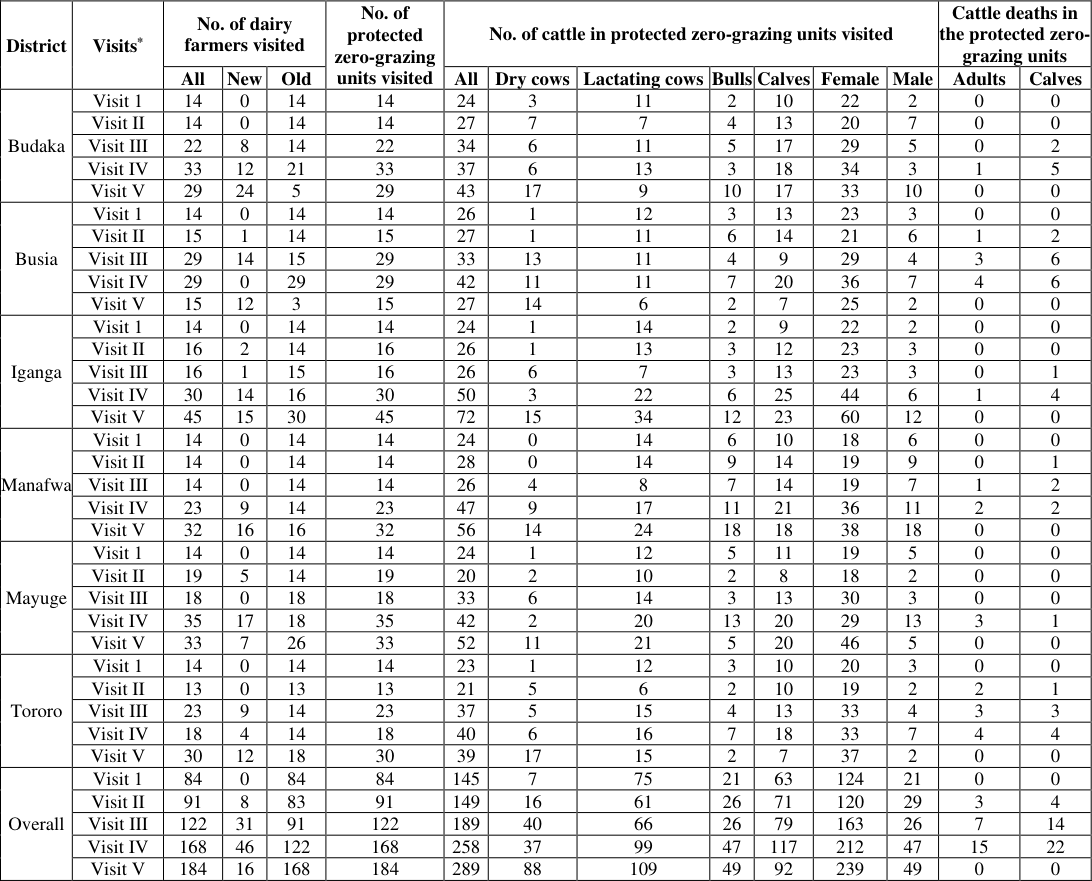 Table 1
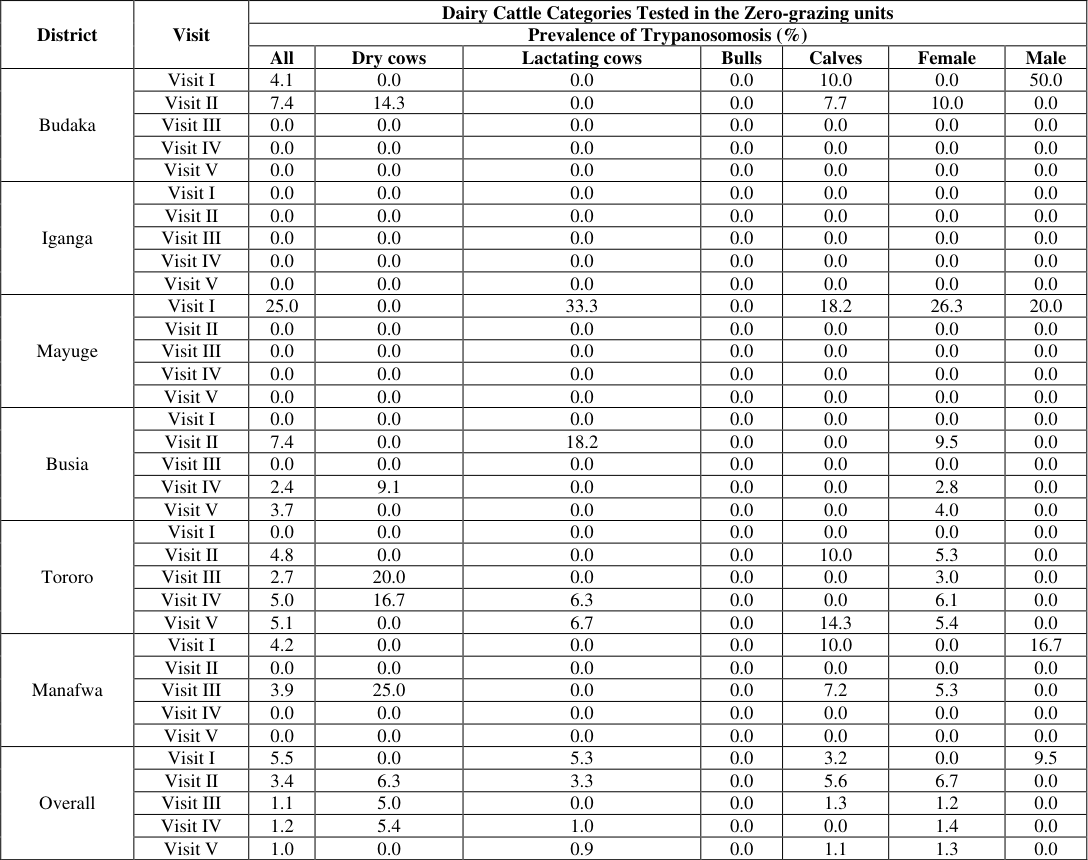 Table 2
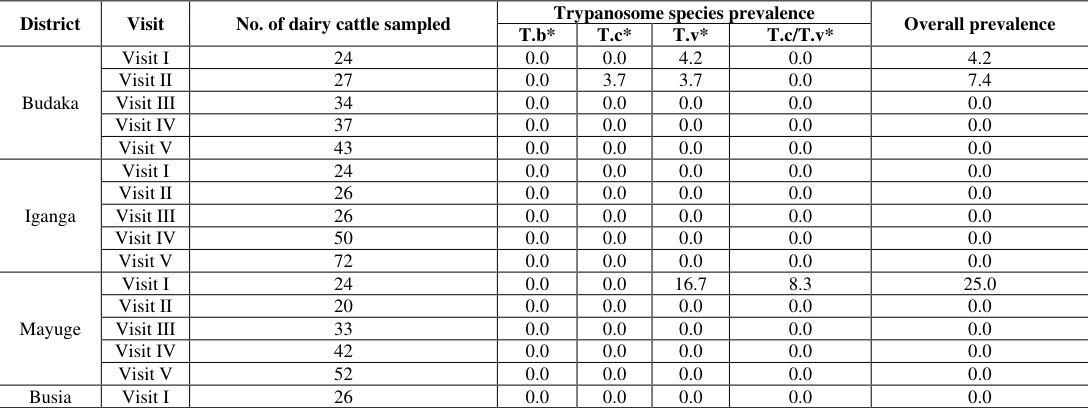 Table 3
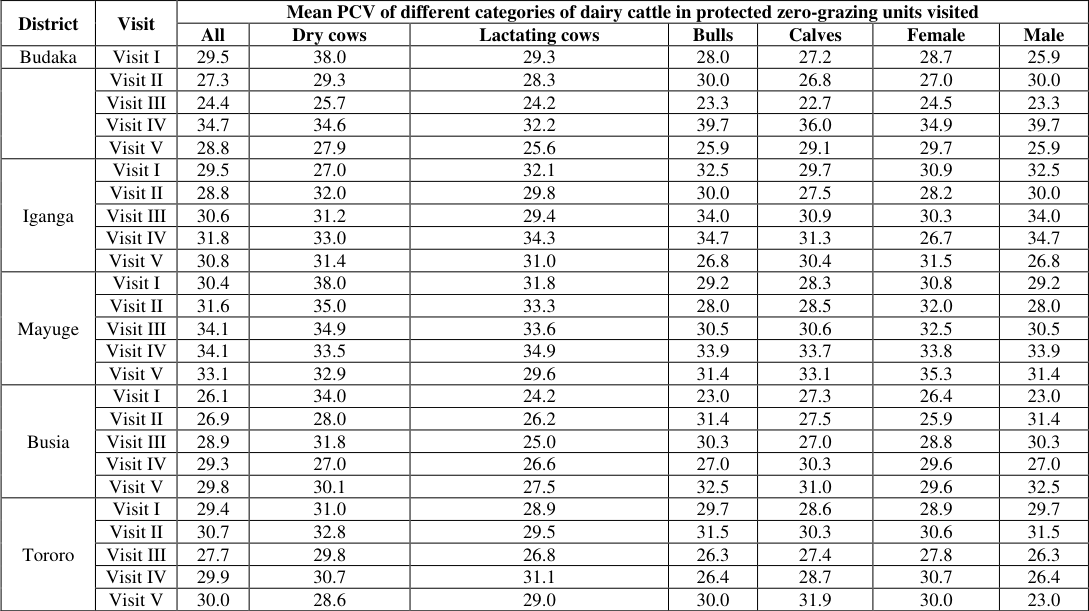 Table 4
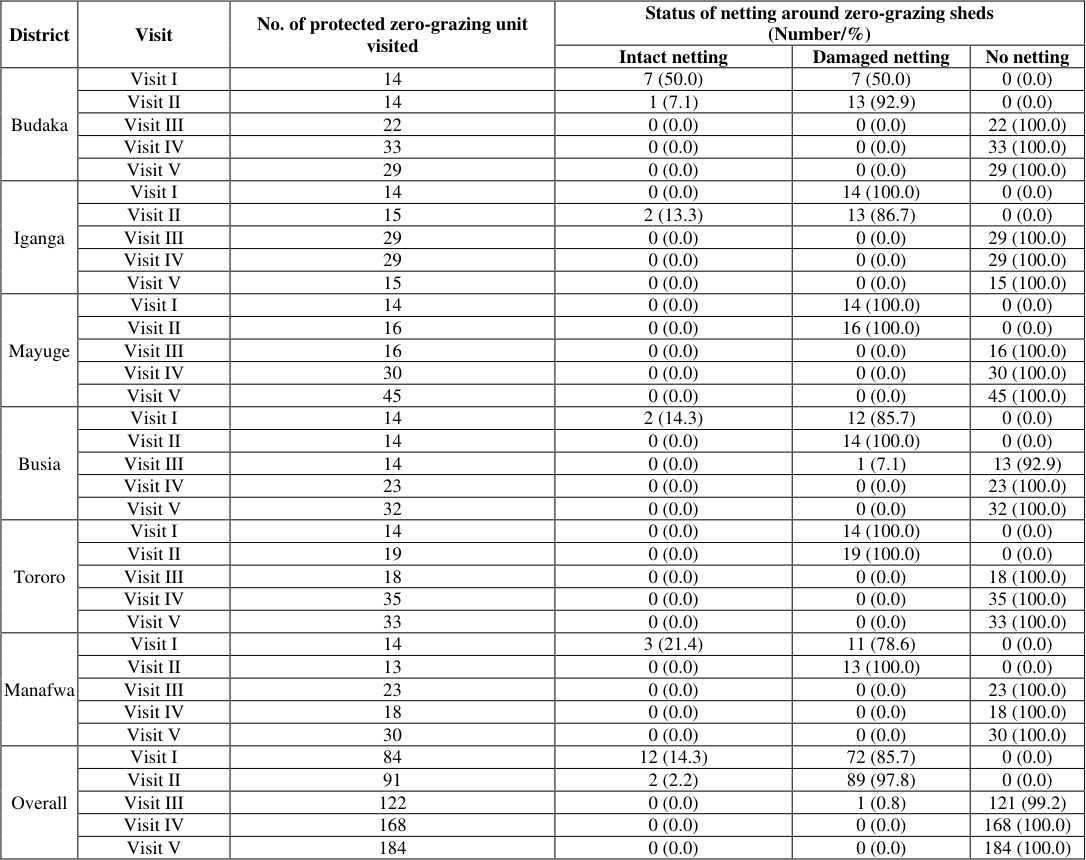 Table 5
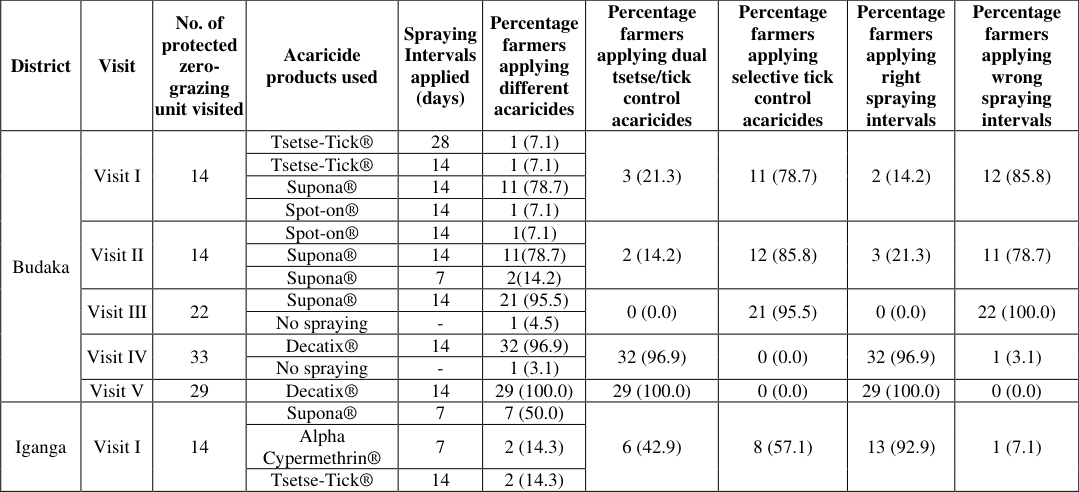 Table 6
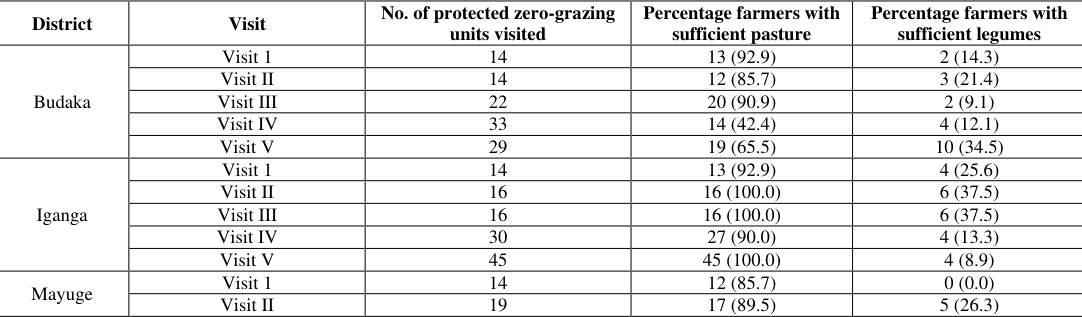 Table 7
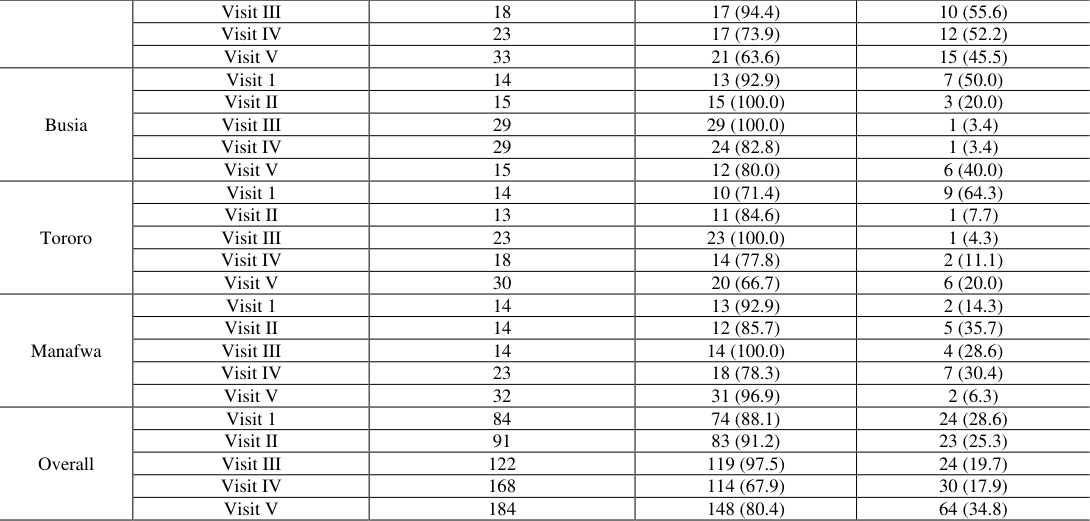 Table 8
 Table 8
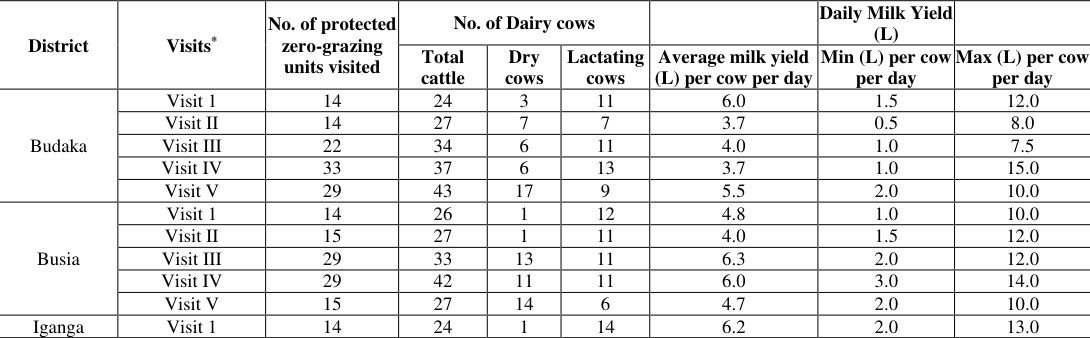 Table 9
Introduction
As tsetse invaded new areas of Uganda during the 20 th Century, numerous control campaigns have been conducted in various areas of Uganda, but none have been sustainable in the longterm (Okoth, 1999; Meyer et al., 2016) [1,2] . The Farming in Tsetse-Controlled Areas (FITCA) programme was implemented from 1997 to 2004 in East Africa (Meyer et al., 2016) [2] . Funded by the European Development Fund, it operated in Kenya, Uganda, Ethiopia and Tanzania. Initially it made use of impregnated targets and traps set up by government officials and then followed-up with insecticide treatment of cattle (Meyer et al., 2016) [2] . The project also encouraged the use of zero-grazing dairy units protected by insecticide-treated nets (Bauer et al., 2006) [3] . During FITCA project, attempts were made to control tsetse through tsetsetrapping and pour-on application, and trypanosomosis by means of block treatment of cattle in high-risk sub-counties (5% prevalence) with isometamidium chloride and diminazene aceturate in 12 districts in Uganda (Magona et al., 2017) [4] . But was not effective due to insufficient coverage and unsustained control efforts. FITCA faced sustainability issues, such as management and financial challenges often associated with community-based projects, attributed to a lack of engagement of project recipients (Meyer et al., 2016) [2] . Most previous tsetse and trypanosomosis control campaigns implemented in Southeast Uganda had a One Health focus, combining the control of African Animal Trypanosomosis (AAT) with Human African Trypanosomosis (HAT) through treatment of animal reservoirs for Trypanosoma rhodesiense (Magona et al., 1998; Févre et al., 2001; Kabasa, 2007; Magona and Walubengo, 2011) [5,6,7,8] . Uniquely, the pyrethroid treated netting intervention supplemented with periodic spraying of cattle and other animal management strategies applied by smallholder farmers was intended to prevent dairy cattle from tsetse bites and transmission of trypanosomosis, while boosting milk production as an economic venture. In the aftermath of tsetse and trypanosomosis control programme, such a campaign advocated for creating a milk value-chain for economic empowerment of rural communities living in tsetse-infested areas. Pyrethroid treated netting (zero fly livestock fence) have been used elsewhere to combat fly challenges affecting smallholder cattle kept under zero-grazing (Bauer et al., 2011; Maia et al., 2012; Megersa et al., 2017) [9,10,11] . However, little has been documented about the effectiveness of such a tsetse and trypanosomosis control intervention that was implemented in Uganda over a four-year period in the aftermath of the FITCA project. We report on the prevalence of trypanosomosis and PCV values of dairy cattle, milk yield, status of pyrethroid netting, farmer spraying practices, and status of pasture and legume feed monitored in a longitudinal study conducted among protected zero-grazing units in six districts in Southeast Uganda.
Materials and Methods
Materials and Methods
Study area
The longitudinal study was conducted among protected zerograzing units in six districts, including Budaka, Busia, Iganga, Manafwa, Mayuge and Tororo in Southeast Uganda, an area largely infested with Glossina f. fuscipes and a limited extent with G. pallidipes (Magona et al., 2008) [18] . The main vegetation type in Southeast Uganda is savannah grassland. The area receives an annual rainfall of 1,200-1500 mm that is bimodally distributed. There are two wet seasons (March to June and September to November) and two dry seasons (December to February and July to August). The daily mean minimum and mean maximum temperatures are 15 °C and 27 °C, respectively.
Protected zero-grazing cattle initiative
Upon completion of the FITCA tsetse and trypanosomosis campaign in Southeast Uganda in 2005, the protected zerograzing dairy initiative was established. Amongst 14 farmers from Budaka subcounty, Chali parish in Budaka district; 14 farmers from Busitema subcounty, Tira, Ajuket, Buchicha and Sikunda parishes in Busia district; 14 farmers from Bulamagi subcounty, Bulamagi parish in Iganga district; 14 farmers from Sibanga subcounty, Butta parish and Bugobero subcounty, Bugobero parish in Manafwa district; and 15 farmers from Imanyiro subcounty, Mbale parish in Mayuge district. The basis for selection of specific subcounties and parishes in the districts was areas being high-risk for trypanosomosis and having felt the highest negative impact from tsetse and trypanosomosis as per earlier baseline data. Selected farmers were largely women from rural communities. FITCA project procured crossbred Friesian in-calf heifers and distributed to selected farmers. In addition, constructed zerograzing units covered with pyrethroid treated netting. Furthermore, assorted acaricides, spray pumps and veterinary drugs were provided as well. Farmers were also supplied with pasture and legume seed for cultivation. Full veterinary attention was provided for the dairy groups. Veterinary advisory services and milk marketing guidance were provided as well. Recruitment of new farmer group members was through pass-on of female calves. The project then constructed zero-grazing units protected with pyrethroid treated netting for new members. This approach ran for fouryears until project funding expired. A farmer group in each district selected a chairperson that guided regular group meetings and mobilized members for regular veterinary extension training. Cattle were periodically sprayed using Knapsack spray pumps with either dual acaricides for tsetse and tick control or for tick-selective control. Farmers were advised to use dilutions and spraying intervals as per Manufacturers' recommendations. Cattle were stall-fed largely pasture-Elephant grass and legumes-Lablab using a cut and carry method. Additional supplementary feeding with maize bran was practised by a few farmers. PCV values of dairy cattle was extracted through testing of blood samples. Data on milk yield, livestock deaths and farmer spraying practices was extracted from farm records and farmer interviews. Data on the status of pyrethroid treated netting, status of cowshed hygiene and status of pasture and legume feed was collected through direct farm inspection.
Monitoring visits of the longitudinal study
Monitoring visits of the longitudinal study
Detection of trypanosomes and measurement of PCV values
During each visit, all dairy cattle in the protected zero-grazing units in the districts were bled from the jugular vein and blood examined for trypanosomes using both the Haematocrit Centrifugation Technique (HCT) (Woo, 1969) [12] and Buffy Coat Technique (BCT) (Murray et al., 1977) [13] . The PCV value for a blood sample for each dairy animal was determined using the micro-haematocrit reader (Hawksley, England).
Statistical Analysis
Descriptive statistics on the data were generated using the frequency functions of Excel. Statistical analysis was performed using GENSTAT (GENSTAT®, Version 13). Pvalues < 0.05 were considered significant.
Results
A summary of the number of dairy farmers, protected zerograzing units and number of dairy cattle per district is presented in Table 1. Overall, the dairy farmers visited ranged from 84 in visit I to 184 in visit V. While dairy cattle ranged from 145 in visit I to 289 in visit V. Most of the dairy cattle were lactating cows (61-109) with few dry cows (7-88), bulls (21-49) and calves (63-117). Females ranged from 124 in visit I to 239 in visit V, while males ranged from 21 in visit I to 49 in visit V. Protected zero-grazing registered low death, only 25 adult cattle and 40 calves were reported. The prevalence of trypanosomosis disaggregated according to dairy cattle categories and gender per district is shown in Table 2. Generally, the prevalence of trypanosomosis among dairy cattle under protected zero-grazing was extremely low, suggesting the pyrethroid treated netting intervention supplemented by spraying of cattle was effective. The prevalence of trypanosomosis declined from 5.5% in visit I to 1.0% in visit V. Iganga district registered no prevalence of trypanosomosis in dairy cattle. Mayuge district registered a prevalence of trypanosomosis of 25% in dairy cattle during visit I but remained free from visit II to visit V. Meanwhile, Budaka district registered a prevalence of trypanosomosis in dairy cattle ranging from 4.1% to 7.4%, with Busia district ranging from 2.4% to 7.4%, Tororo district ranging from 2.7% to 5.1% and Manafwa district ranging from 3.9% to 4.2%. Regarding dairy cattle categories, dry cows registered a prevalence of trypanosomosis ranging from 0.0% to 6.2%, with lactating cows ranging from 1.0% to 5.3% and calves ranging from 0.0% to 5.6%. Bulls were free from trypanosomosis. Regarding gender, females registered a prevalence of trypanosomosis ranging from 0.0% to 6.7%, but males registered a prevalence of trypanosomosis of 9.5% during visit I and remained free from visit II to V. Mean PCV values for dairy cattle in protected zero-grazing units visited are presented in Table 4. Generally, dairy cattle under protected zero-grazing had good health, given mean PCV values ranging 27.7 to 30.6. However, there was variation between districts. Dairy cattle in Mayuge district had the best mean PCV values (range 30.4-34.1), followed by Iganga district (range 28.8-31.8), Tororo district (range 27.7-30.0), Budaka district (range 24.4-34.7), Manafwa district (range 26.1-31.7) and Busia district (range 26.1-29.8). Mean PCV values of dairy cattle in Mayuge district during visits II and III were significantly higher (p<0.05) than of those from Manafwa district. As well, mean PCV of dairy cattle in Tororo district during visits II and III were significantly higher (p<0.05) than those from Busia district. Regarding dairy cattle categories, dry cows had the best PCV values (range 29.9 to 33.6), followed by bulls (range 28.3-32.1), calves (range 27.6-32.0) and lactating cows (range 26.3 to 30.3). As regards gender, females and males equally had good PCV values, ranging from 28.3 to 31.2 for females and ranging from 28.3 to 32.1 for males. Low PCV values of 15 and below, denoting cattle experiencing anaemia because of either trypanosomosis or tick-borne diseases that were endemic in the area, were not observed among dairy cattle under protected zero-grazing across all districts. These findings suggest that the pyrethroid treated netting around zero-grazing units supplemented by periodic spraying of cattle effectively protected dairy cattle against tsetse-transmitted trypanosomosis and tick-transmitted diseases-theileriosis, anaplasmosis and babesiosis. Diseases often causing anaemia in cattle in areas visited. The status of the pyrethroid treated netting around zerograzing sheds is described in Table 5. Netting status varied from district to district. 50% of the zero-grazing units had intact netting in Budaka district during visit I, while 50% had damaged netting. However, only 7.1% of the zero-grazing units had intact netting by visit II, while 92.9% of the units had damaged netting. All units had lost netting by visit III to V. All zero-grazing units had damaged netting by visit I and 86.7% of the units had damaged netting by visit II with a few (13.3%) replaced in Iganga district. However, all zero-grazing units had lost netting by visit III to V. Similarly, all zerograzing units had damaged netting by visit I and II with all units having lost netting by visit III to V in Mayuge district. Likewise, 14.3% of the zero-grazing units had intact netting while 85.7% of the units had damaged netting by visit I in Busia district. However, all units had damaged netting by visit II and 7.1% of the units had damaged netting by visit III and 92.9% of the units had lost the netting. All units had lost netting by visit IV to V.
| District | Visit | No. of protected zero-grazing unit visited | Status of netting around zero-grazing sheds (Number/%) | — | — |
|---|---|---|---|---|---|
| Intact netting | Damaged netting | No netting | |||
| Budaka | Visit I | 14 | 7 (50.0) | 7 (50.0) | 0 (0.0) |
| Visit II | 14 | 1 (7.1) | 13 (92.9) | 0 (0.0) | |
| Visit III | 22 | 0 (0.0) | 0 (0.0) | 22 (100.0) | |
| Visit IV | 33 | 0 (0.0) | 0 (0.0) | 33 (100.0) | |
| Visit V | 29 | 0 (0.0) | 0 (0.0) | 29 (100.0) | |
| Iganga | Visit I | 14 | 0 (0.0) | 14 (100.0) | 0 (0.0) |
| Visit II | 15 | 2 (13.3) | 13 (86.7) | 0 (0.0) | |
| Visit III | 29 | 0 (0.0) | 0 (0.0) | 29 (100.0) | |
| Visit IV | 29 | 0 (0.0) | 0 (0.0) | 29 (100.0) | |
| Visit V | 15 | 0 (0.0) | 0 (0.0) | 15 (100.0) | |
| Mayuge | Visit I | 14 | 0 (0.0) | 14 (100.0) | 0 (0.0) |
| Visit II | 16 | 0 (0.0) | 16 (100.0) | 0 (0.0) | |
| Visit III | 16 | 0 (0.0) | 0 (0.0) | 16 (100.0) | |
| Visit IV | 30 | 0 (0.0) | 0 (0.0) | 30 (100.0) | |
| Visit V | 45 | 0 (0.0) | 0 (0.0) | 45 (100.0) | |
| Busia | Visit I | 14 | 2 (14.3) | 12 (85.7) | 0 (0.0) |
| Visit II | 14 | 0 (0.0) | 14 (100.0) | 0 (0.0) | |
| Visit III | 14 | 0 (0.0) | 1 (7.1) | 13 (92.9) | |
| Visit IV | 23 | 0 (0.0) | 0 (0.0) | 23 (100.0) | |
| Visit V | 32 | 0 (0.0) | 0 (0.0) | 32 (100.0) | |
| Tororo | Visit I | 14 | 0 (0.0) | 14 (100.0) | 0 (0.0) |
| Visit II | 19 | 0 (0.0) | 19 (100.0) | 0 (0.0) | |
| Visit III | 18 | 0 (0.0) | 0 (0.0) | 18 (100.0) | |
| Visit IV | 35 | 0 (0.0) | 0 (0.0) | 35 (100.0) | |
| Visit V | 33 | 0 (0.0) | 0 (0.0) | 33 (100.0) | |
| Manafwa | Visit I | 14 | 3 (21.4) | 11 (78.6) | 0 (0.0) |
| Visit II | 13 | 0 (0.0) | 13 (100.0) | 0 (0.0) | |
| Visit III | 23 | 0 (0.0) | 0 (0.0) | 23 (100.0) | |
| Visit IV | 18 | 0 (0.0) | 0 (0.0) | 18 (100.0) | |
| Visit V | 30 | 0 (0.0) | 0 (0.0) | 30 (100.0) | |
| Overall | Visit I | 84 | 12 (14.3) | 72 (85.7) | 0 (0.0) |
| Visit II | 91 | 2 (2.2) | 89 (97.8) | 0 (0.0) | |
| Visit III | 122 | 0 (0.0) | 1 (0.8) | 121 (99.2) | |
| Visit IV | 168 | 0 (0.0) | 0 (0.0) | 168 (100.0) | |
| Visit V | 184 | 0 (0.0) | 0 (0.0) | 184 (100.0) |
Table text extracted from the original PDF; superscript letters are shown inline. The original table image is below.
View original table image
| District | Visit | Mean PCV of different categories of dairy cattle in protected zero-grazing units visited | — | — | — | — | — | — |
|---|---|---|---|---|---|---|---|---|
| All | Dry cows | Lactating cows | Bulls | Calves | Female | Male | ||
| Budaka | Visit I | 29.5 | 38.0 | 29.3 | 28.0 | 27.2 | 28.7 | 25.9 |
| Visit II | 27.3 | 29.3 | 28.3 | 30.0 | 26.8 | 27.0 | 30.0 | |
| Visit III | 24.4 | 25.7 | 24.2 | 23.3 | 22.7 | 24.5 | 23.3 | |
| Visit IV | 34.7 | 34.6 | 32.2 | 39.7 | 36.0 | 34.9 | 39.7 | |
| Visit V | 28.8 | 27.9 | 25.6 | 25.9 | 29.1 | 29.7 | 25.9 | |
| Iganga | Visit I | 29.5 | 27.0 | 32.1 | 32.5 | 29.7 | 30.9 | 32.5 |
| Visit II | 28.8 | 32.0 | 29.8 | 30.0 | 27.5 | 28.2 | 30.0 | |
| Visit III | 30.6 | 31.2 | 29.4 | 34.0 | 30.9 | 30.3 | 34.0 | |
| Visit IV | 31.8 | 33.0 | 34.3 | 34.7 | 31.3 | 26.7 | 34.7 | |
| Visit V | 30.8 | 31.4 | 31.0 | 26.8 | 30.4 | 31.5 | 26.8 | |
| Mayuge | Visit I | 30.4 | 38.0 | 31.8 | 29.2 | 28.3 | 30.8 | 29.2 |
| Visit II | 31.6 | 35.0 | 33.3 | 28.0 | 28.5 | 32.0 | 28.0 | |
| Visit III | 34.1 | 34.9 | 33.6 | 30.5 | 30.6 | 32.5 | 30.5 | |
| Visit IV | 34.1 | 33.5 | 34.9 | 33.9 | 33.7 | 33.8 | 33.9 | |
| Visit V | 33.1 | 32.9 | 29.6 | 31.4 | 33.1 | 35.3 | 31.4 | |
| Busia | Visit I | 26.1 | 34.0 | 24.2 | 23.0 | 27.3 | 26.4 | 23.0 |
| Visit II | 26.9 | 28.0 | 26.2 | 31.4 | 27.5 | 25.9 | 31.4 | |
| Visit III | 28.9 | 31.8 | 25.0 | 30.3 | 27.0 | 28.8 | 30.3 | |
| Visit IV | 29.3 | 27.0 | 26.6 | 27.0 | 30.3 | 29.6 | 27.0 | |
| Visit V | 29.8 | 30.1 | 27.5 | 32.5 | 31.0 | 29.6 | 32.5 | |
| Tororo | Visit I | 29.4 | 31.0 | 28.9 | 29.7 | 28.6 | 28.9 | 29.7 |
| Visit II | 30.7 | 32.8 | 29.5 | 31.5 | 30.3 | 30.6 | 31.5 | |
| Visit III | 27.7 | 29.8 | 26.8 | 26.3 | 27.4 | 27.8 | 26.3 | |
| Visit IV | 29.9 | 30.7 | 31.1 | 26.4 | 28.7 | 30.7 | 26.4 | |
| Visit V | 30.0 | 28.6 | 29.0 | 30.0 | 31.9 | 30.0 | 23.0 |
Table text extracted from the original PDF; superscript letters are shown inline. The original table image is below.
View original table image
| District | Visit | Dairy Cattle Categories Tested in the Zero-grazing units | — | — | — | — | — | — |
|---|---|---|---|---|---|---|---|---|
| Prevalence of Trypanosomosis (%) | ||||||||
| All | Dry cows | Lactating cows | Bulls | Calves | Female | Male | ||
| Budaka | Visit I | 4.1 | 0.0 | 0.0 | 0.0 | 10.0 | 0.0 | 50.0 |
| Visit II | 7.4 | 14.3 | 0.0 | 0.0 | 7.7 | 10.0 | 0.0 | |
| Visit III | 0.0 | 0.0 | 0.0 | 0.0 | 0.0 | 0.0 | 0.0 | |
| Visit IV | 0.0 | 0.0 | 0.0 | 0.0 | 0.0 | 0.0 | 0.0 | |
| Visit V | 0.0 | 0.0 | 0.0 | 0.0 | 0.0 | 0.0 | 0.0 | |
| Iganga | Visit I | 0.0 | 0.0 | 0.0 | 0.0 | 0.0 | 0.0 | 0.0 |
| Visit II | 0.0 | 0.0 | 0.0 | 0.0 | 0.0 | 0.0 | 0.0 | |
| Visit III | 0.0 | 0.0 | 0.0 | 0.0 | 0.0 | 0.0 | 0.0 | |
| Visit IV | 0.0 | 0.0 | 0.0 | 0.0 | 0.0 | 0.0 | 0.0 | |
| Visit V | 0.0 | 0.0 | 0.0 | 0.0 | 0.0 | 0.0 | 0.0 | |
| Mayuge | Visit I | 25.0 | 0.0 | 33.3 | 0.0 | 18.2 | 26.3 | 20.0 |
| Visit II | 0.0 | 0.0 | 0.0 | 0.0 | 0.0 | 0.0 | 0.0 | |
| Visit III | 0.0 | 0.0 | 0.0 | 0.0 | 0.0 | 0.0 | 0.0 | |
| Visit IV | 0.0 | 0.0 | 0.0 | 0.0 | 0.0 | 0.0 | 0.0 | |
| Visit V | 0.0 | 0.0 | 0.0 | 0.0 | 0.0 | 0.0 | 0.0 | |
| Busia | Visit I | 0.0 | 0.0 | 0.0 | 0.0 | 0.0 | 0.0 | 0.0 |
| Visit II | 7.4 | 0.0 | 18.2 | 0.0 | 0.0 | 9.5 | 0.0 | |
| Visit III | 0.0 | 0.0 | 0.0 | 0.0 | 0.0 | 0.0 | 0.0 | |
| Visit IV | 2.4 | 9.1 | 0.0 | 0.0 | 0.0 | 2.8 | 0.0 | |
| Visit V | 3.7 | 0.0 | 0.0 | 0.0 | 0.0 | 4.0 | 0.0 | |
| Tororo | Visit I | 0.0 | 0.0 | 0.0 | 0.0 | 0.0 | 0.0 | 0.0 |
| Visit II | 4.8 | 0.0 | 0.0 | 0.0 | 10.0 | 5.3 | 0.0 | |
| Visit III | 2.7 | 20.0 | 0.0 | 0.0 | 0.0 | 3.0 | 0.0 | |
| Visit IV | 5.0 | 16.7 | 6.3 | 0.0 | 0.0 | 6.1 | 0.0 | |
| Visit V | 5.1 | 0.0 | 6.7 | 0.0 | 14.3 | 5.4 | 0.0 | |
| Manafwa | Visit I | 4.2 | 0.0 | 0.0 | 0.0 | 10.0 | 0.0 | 16.7 |
| Visit II | 0.0 | 0.0 | 0.0 | 0.0 | 0.0 | 0.0 | 0.0 | |
| Visit III | 3.9 | 25.0 | 0.0 | 0.0 | 7.2 | 5.3 | 0.0 | |
| Visit IV | 0.0 | 0.0 | 0.0 | 0.0 | 0.0 | 0.0 | 0.0 | |
| Visit V | 0.0 | 0.0 | 0.0 | 0.0 | 0.0 | 0.0 | 0.0 | |
| Overall | Visit I | 5.5 | 0.0 | 5.3 | 0.0 | 3.2 | 0.0 | 9.5 |
| Visit II | 3.4 | 6.3 | 3.3 | 0.0 | 5.6 | 6.7 | 0.0 | |
| Visit III | 1.1 | 5.0 | 0.0 | 0.0 | 1.3 | 1.2 | 0.0 | |
| Visit IV | 1.2 | 5.4 | 1.0 | 0.0 | 0.0 | 1.4 | 0.0 | |
| Visit V | 1.0 | 0.0 | 0.9 | 0.0 | 1.1 | 1.3 | 0.0 |
Table text extracted from the original PDF; superscript letters are shown inline. The original table image is below.
View original table image
| District | Visits* | No. of dairy farmers visited | — | — | No. of protected zero-grazing units visited | No. of cattle in protected zero-grazing units visited | — | — | — | — | — | — | Cattle deaths in the protected zero- grazing units | — |
|---|---|---|---|---|---|---|---|---|---|---|---|---|---|---|
| All | New | Old | All | Dry cows | Lactating cows | Bulls | Calves | Female | Male | Adults | Calves | |||
| Budaka | Visit 1 | 14 | 0 | 14 | 14 | 24 | 3 | 11 | 2 | 10 | 22 | 2 | 0 | 0 |
| Visit II | 14 | 0 | 14 | 14 | 27 | 7 | 7 | 4 | 13 | 20 | 7 | 0 | 0 | |
| Visit III | 22 | 8 | 14 | 22 | 34 | 6 | 11 | 5 | 17 | 29 | 5 | 0 | 2 | |
| Visit IV | 33 | 12 | 21 | 33 | 37 | 6 | 13 | 3 | 18 | 34 | 3 | 1 | 5 | |
| Visit V | 29 | 24 | 5 | 29 | 43 | 17 | 9 | 10 | 17 | 33 | 10 | 0 | 0 | |
| Busia | Visit 1 | 14 | 0 | 14 | 14 | 26 | 1 | 12 | 3 | 13 | 23 | 3 | 0 | 0 |
| Visit II | 15 | 1 | 14 | 15 | 27 | 1 | 11 | 6 | 14 | 21 | 6 | 1 | 2 | |
| Visit III | 29 | 14 | 15 | 29 | 33 | 13 | 11 | 4 | 9 | 29 | 4 | 3 | 6 | |
| Visit IV | 29 | 0 | 29 | 29 | 42 | 11 | 11 | 7 | 20 | 36 | 7 | 4 | 6 | |
| Visit V | 15 | 12 | 3 | 15 | 27 | 14 | 6 | 2 | 7 | 25 | 2 | 0 | 0 | |
| Iganga | Visit 1 | 14 | 0 | 14 | 14 | 24 | 1 | 14 | 2 | 9 | 22 | 2 | 0 | 0 |
| Visit II | 16 | 2 | 14 | 16 | 26 | 1 | 13 | 3 | 12 | 23 | 3 | 0 | 0 | |
| Visit III | 16 | 1 | 15 | 16 | 26 | 6 | 7 | 3 | 13 | 23 | 3 | 0 | 1 | |
| Visit IV | 30 | 14 | 16 | 30 | 50 | 3 | 22 | 6 | 25 | 44 | 6 | 1 | 4 | |
| Visit V | 45 | 15 | 30 | 45 | 72 | 15 | 34 | 12 | 23 | 60 | 12 | 0 | 0 | |
| Manafwa | Visit 1 | 14 | 0 | 14 | 14 | 24 | 0 | 14 | 6 | 10 | 18 | 6 | 0 | 0 |
| Visit II | 14 | 0 | 14 | 14 | 28 | 0 | 14 | 9 | 14 | 19 | 9 | 0 | 1 | |
| Visit III | 14 | 0 | 14 | 14 | 26 | 4 | 8 | 7 | 14 | 19 | 7 | 1 | 2 | |
| Visit IV | 23 | 9 | 14 | 23 | 47 | 9 | 17 | 11 | 21 | 36 | 11 | 2 | 2 | |
| Visit V | 32 | 16 | 16 | 32 | 56 | 14 | 24 | 18 | 18 | 38 | 18 | 0 | 0 | |
| Mayuge | Visit 1 | 14 | 0 | 14 | 14 | 24 | 1 | 12 | 5 | 11 | 19 | 5 | 0 | 0 |
| Visit II | 19 | 5 | 14 | 19 | 20 | 2 | 10 | 2 | 8 | 18 | 2 | 0 | 0 | |
| Visit III | 18 | 0 | 18 | 18 | 33 | 6 | 14 | 3 | 13 | 30 | 3 | 0 | 0 | |
| Visit IV | 35 | 17 | 18 | 35 | 42 | 2 | 20 | 13 | 20 | 29 | 13 | 3 | 1 | |
| Visit V | 33 | 7 | 26 | 33 | 52 | 11 | 21 | 5 | 20 | 46 | 5 | 0 | 0 | |
| Tororo | Visit 1 | 14 | 0 | 14 | 14 | 23 | 1 | 12 | 3 | 10 | 20 | 3 | 0 | 0 |
| Visit II | 13 | 0 | 13 | 13 | 21 | 5 | 6 | 2 | 10 | 19 | 2 | 2 | 1 | |
| Visit III | 23 | 9 | 14 | 23 | 37 | 5 | 15 | 4 | 13 | 33 | 4 | 3 | 3 | |
| Visit IV | 18 | 4 | 14 | 18 | 40 | 6 | 16 | 7 | 18 | 33 | 7 | 4 | 4 | |
| Visit V | 30 | 12 | 18 | 30 | 39 | 17 | 15 | 2 | 7 | 37 | 2 | 0 | 0 | |
| Overall | Visit 1 | 84 | 0 | 84 | 84 | 145 | 7 | 75 | 21 | 63 | 124 | 21 | 0 | 0 |
| Visit II | 91 | 8 | 83 | 91 | 149 | 16 | 61 | 26 | 71 | 120 | 29 | 3 | 4 | |
| Visit III | 122 | 31 | 91 | 122 | 189 | 40 | 66 | 26 | 79 | 163 | 26 | 7 | 14 | |
| Visit IV | 168 | 46 | 122 | 168 | 258 | 37 | 99 | 47 | 117 | 212 | 47 | 15 | 22 | |
| Visit V | 184 | 16 | 168 | 184 | 289 | 88 | 109 | 49 | 92 | 239 | 49 | 0 | 0 |
Table text extracted from the original PDF; superscript letters are shown inline. The original table image is below.
View original table image
In Tororo district, all zero-grazing units had damaged netting by visit I and II. However, from visit III to V, all units had lost netting. Similarly, 21.4% of the zero-grazing units in Manafwa district had intact netting while 78.6% of the units had damaged netting by visit I. All zero-grazing units had damaged netting by visit II and all had lost netting by visit III to V. Generally, only 14.3% and 2.2% of the 184 zero-grazing units had intact netting by visit I and II, respectively. 85.7%, 97.8% and 1.8% of the units had damaged netting by visit I, II and III, respectively. 99.2% of the units had lost netting in visit III, while all (100%) zero-grazing units had lost netting by visit IV and V. Farmer spraying practices for supplementary dual tsetse-tick control amongst protected zero-grazing units visited are described in Table 6. Spraying practices differed from district to district. Tsetse-Tick®, Decatix® and Spot-on® were acaricides largely used for dual control of tsetse and ticks in Budaka district, with Supona® being the main tick-selective acaricide used. Most zero-grazing units focussed on tick control during visit I (78.7%), II (78.7%) and III (95.5%). The routine, however, shifted to dual control of tsetse and tick control during visit IV (96.9%) and V (100%). Unfortunately, 85.8%, 78.7% and 100% of farmers applied wrong spraying intervals during visit I, II and III, respectively. Supona®, an acaricide whose recommended spraying interval is 7 days was applied by farmers every 14 days. Tsetse-Tick®, Decatix® and Alpha Cypermethrin® were acaricides for dual tsetse and tick control, largely used in Iganga district, with Supona®, Amitraz® and Alfapor® being the main tick selective acaricides used. Most zero-grazing units focussed on tick control during visit I (57.1%) and II (75.0%). However, the trend shifted to dual tsetse and tick control during visit III (56.3%), IV (100.0%) and V (86.7%).
Unfortunately, 60% of the zero-grazing units did not follow correct spraying intervals during visit V. Tsetse-Tick®, Alpha Cypermethrin® and Decatix® were applied every 7 days rather than every 14 days as recommended. Decatix® and Tsetse-Tick® were the acaricides for dual tsetse and tick control largely used in Mayuge district, with Supona® and Amitraz® being the main tick-selective acaricides used. Most zero-grazing units focussed on tick control during visit I (78.6%), II (68.4%) and III (66.7%). However, 100% of the zero-grazing units shifted to dual tsetse and tick control during visit IV and V. Correct spraying intervals were not observed by 57.2% and 75.8% of the units during visit I and V, respectively. Supona® was applied every 14 days rather than every 7 days as recommended. In addition, Decatix® was applied every 7 days rather than every 14 days as recommended. Decatix®, Spot-on® and Tsetse-Tick® were the acaricides for dual tsetse and tick control largely used in Busia district, with Supona®, Amitraz®, Triatix® and Steladone® being the main tick selective acaricides used. Most zero-grazing units focussed on tick control during visit I (64.3%), II (60.0%) and III (75.9%). The focus however shifted to dual tsetse and tick control during visit IV (93.1%) and V (93.3%). However, 69.0%, 51.7% and 53.3% of the zero-grazing units did not follow correct spraying intervals during visit III, IV and V, respectively. Supona® and Amitraz® were applied every 14 days rather than every 7 days as recommended. In addition, Decatix® was applied 7 days rather than every 14 days as recommended.
Decatix®, Spot-on®, Tsetse-Tick®, Alpha Cypermethrin® were the acaricides for dual tsetse and tick control used in Tororo district, with Supona®, Renegede® and Amitraz® being the main tick-selective acaricides used. Most zerograzing units focussed on tick control during visit I (64.3%) and II (100%). The trend shifted to dual tsetse and tick control during visit III (78.3%), IV (94.4%) and V (86.7%). However, 53.8%, 65.2%, 72.7% and 70.0% of the zero-grazing units did not follow correct spraying interval during visit II, III, IV and V, respectively. Supona® and Amitraz® were applied every 14 days rather than every 7 days as recommended. In addition, Decatix®, Tsetse-Tick® and Spot-on® were applied every 7 days rather than every 14 days as recommended.
Worse still, Alpha Cypermethrin was applied every 4 days rather than every 14 days as recommended. Decatix® and Tsetse-Tick® were the acaricides for dual tsetse and tick control largely applied in Manafwa district, with Supona® and Taktic® as the main tick-selective acaricides used. Most zero-grazing units focussed on tick control during visit I (64.3%) and III (100.0%). However, 57.2%, 95.7% and 96.8% of the units shifted focus to dual tsetse and tick control during visit II, IV and V, respectively. Unfortunately, all (100%) zero-grazing units did not observe the correct spraying interval during visit III. Supona® and Taktic® were applied every 14 days rather than every 7 days as recommended. In addition, Decatix® was applied every 7 days rather than every 14 days as recommended. Overall, 66.9% of the 184 zero-grazing units largely used acaricides for dual tsetse and tick control and only 33.1% of the units largely used tick-selective acaricides. Of all zerograzing units, 57.8% observed correct acaricide spraying intervals while 42.2% of the units applied wrong spraying intervals. The status of pasture and legume feed produced by zerograzing units in terms of sufficiency in different districts visited is presented in Table 7. The proportion of zero-grazing dairy farmers with sufficient pasture varied from district to district. Iganga (range 90-100%), Busia (range 80-100%) and Manafwa (range 78.3-100%) districts had impressively high proportions of farmers with sufficient pasture feed. While Budaka (range 42.4-92.9%), Mayuge (range 63.6-94.4%) and Tororo (range 66.7-100%) districts had a good proportion of farmers with sufficient pasture feed. Overall, a high proportion of zero-grazing dairy farmers (range 67.9-97.5%) had sufficient pasture feed. Regarding legume production by zero-grazing units, Busia (range 3.4-50%), Mayuge (range 0.0-55.6%) and Tororo (range 7.7-64.3%) districts had a fair proportion of farmers with sufficient legume feed. While Budaka (range 9.1-34.5%), Iganga (range 8.9-37.5%) and Manafwa (range 6.3-35.6%) districts had a low proportion of farmers with sufficient legume feed. Overall, only 17.9% to 34.8% of the farmers had sufficient legume feed. The status of cowshed hygiene amongst zero-grazing units in different districts visited is presented in Table 8. Budaka district had the highest percentage of poorly managed cowsheds (93.1%), followed by Busia district (33.3%), then Iganga district (31.1%), Mayuge district 12.1%), Tororo district (10.0%) and lastly Manafwa district (6.3%). The status of milk yield in the zero-grazing dairy units in different districts visited is elaborated in Tsetse-Tick®, Decatix®, Spot-on® and Alpha Cypermethrin® were acaricides for dual tsetse and tick control and Supona®, Amitraz®, Alfapor®, Triatix®, Steladone®. Renegede® and Taktiz® were tick-selective acaricides used in all districts. This was dictated by the range of acaricide products available on the market. Initially, most zero-grazing units in Budaka, Busia and Mayuge districts focussed mainly on tick control during visit I, II and III. The spraying routine, however, shifted to dual tsetse and tick control during visit IV and visit V. This coincided with loss of netting by all zero-grazing units. On the contrary, most zero-grazing units in Iganga and Tororo districts focussed on tick control during visit I and visit II. However, the trend shifted to dual tsetse and tick control by during visit III, IV and V. For Manafwa district, most zerograzing units focussed on tick control during visit I and III and shifted to dual tsetse and tick control during visit II, IV and V. Use of acaricides for dual tsetse and tick control was dominant among the 184 zero-grazing units, while tick selective acaricides were less preferred. Farmers have been reported to prefer an insecticide-treatment interventions for cattle that controls both tsetse and ticks (Torr et al., (2007) [14] . Generally, most zero-grazing units applied correct spraying intervals while fewer units applied incorrect spraying intervals. However, the spraying practices differed from district to district. Incorrect spraying intervals were largely applied during visit I, II and III in Budaka district but the reverse did occur during visit IV and V. In Mayuge district, incorrect spraying intervals were largely applied during visit I and V and correct spraying intervals were applied during visit II, III and IV. On the contrary in Busia district, incorrect spraying intervals were applied during visit III, IV and V, while correct spraying intervals were applied during visit I and II. For Tororo district, incorrect spraying intervals were applied during visit II, III, IV and V, while correct spraying intervals were applied only during visit I. In Iganga district, incorrect spraying intervals were applied during visit V, while correct spraying intervals were applied during visit I, II, III and IV. For Manafwa district, incorrect spraying intervals were applied during visit III, while correct spraying intervals were applied during visit I, II, IV and V. Irregular spraying intervals by farmers have been reported in Uganda previously (Angwech et al., 2011) [15] . Such irregular spraying practices have a danger of pyrethroids leading to acaricide resistance in tick populations (Bruce and Wilson, 1998; Torr et al., 2007) [16, 14] . Incorrect spraying intervals in Budaka, Mayuge, Busia, Tororo and Manafwa districts, involved Supona®, Amitraz® and Taktic® being applied every 14 days rather than every 7 days as recommended. For Iganga, Mayuge, Busia, Tororo and Manafwa districts, Tsetse-Tick®, Alpha Cypermethrin®, Spot-on® and Decatix® were applied every 7 days rather than every 14 days as recommended. Worse still, Alpha Cypermethrin® in Tororo district was applied every 4 days rather than every 14 days as recommended. Incorrect spraying intervals were attributed to (1) Lack of familiarity among farmers of correct usage and understanding of new acaricide products; (2) Lack of training while changing over to new acaricide products; (3) Availability of a wide range of acaricide products within the project contributing to the mixup of acaricide spraying intervals; and (4) Farmers' limited awareness on the acaricides. Experience in Zimbabwe has shown that some farmers treat their cattle at preferably longer spraying intervals rather than at the recommended intervals to reduce costs (Torr et al., 2007) [14] . Sufficient pasture varied from district to district, with Iganga, Busia and Manafwa districts being the most pasture feed sufficient, while Budaka, Mayuge and Tororo districts were less pasture feed sufficient. Unfortunately, all districts were not legume feed sufficient. This was attributed to clear understanding of the need for sufficient pasture for the dairy cattle to meet the required milk production, while underestimating the importance of sufficient legume feed. Legume seed was scarce as well. Budaka district had the highest percentage of poorly managed cowsheds, followed by Busia, Iganga, Mayuge Tororo and Manafwa district. This was attributed to farmers being overwhelmed with too much work during the cultivation season and hence had limited time to properly manage the cowsheds. Incidentally, all dairy farmers visited did not recognize the fact that unhygienic cowshed would lead to increased cases of mastitis and as a result reduce milk production. Indeed, zerograzing units in Budaka district registered the lowest average milk yield per cow per day. The best average milk yield per cow per day was registered by zero-grazing units in Iganga district, followed by Mayuge, Manafwa, Busia, Tororo and Budaka districts. A milk yield increment of 56% in cows protected by zero fly fences has been reported previously in Ethiopia (Megersa et al., 2017) [11] .
| District | No. of protected zero-grazing units visited | Percentage zero-grazing units with poor cowshed hygiene |
|---|---|---|
| Budaka | 29 | 27 (93.1) |
| Iganga | 45 | 14 (31.1) |
| Busia | 15 | 5 (33.3) |
| Tororo | 30 | 3 (10.0) |
| Mayuge | 33 | 4 (12.1) |
| Manafwa | 32 | 2 (6.3) |
Table text extracted from the original PDF; superscript letters are shown inline. The original table image is below.
View original table image
| — | Visit III | 18 | 17 (94.4) | 10 (55.6) |
|---|---|---|---|---|
| Visit IV | 23 | 17 (73.9) | 12 (52.2) | |
| Visit V | 33 | 21 (63.6) | 15 (45.5) | |
| Busia | Visit 1 | 14 | 13 (92.9) | 7 (50.0) |
| Visit II | 15 | 15 (100.0) | 3 (20.0) | |
| Visit III | 29 | 29 (100.0) | 1 (3.4) | |
| Visit IV | 29 | 24 (82.8) | 1 (3.4) | |
| Visit V | 15 | 12 (80.0) | 6 (40.0) | |
| Tororo | Visit 1 | 14 | 10 (71.4) | 9 (64.3) |
| Visit II | 13 | 11 (84.6) | 1 (7.7) | |
| Visit III | 23 | 23 (100.0) | 1 (4.3) | |
| Visit IV | 18 | 14 (77.8) | 2 (11.1) | |
| Visit V | 30 | 20 (66.7) | 6 (20.0) | |
| Manafwa | Visit 1 | 14 | 13 (92.9) | 2 (14.3) |
| Visit II | 14 | 12 (85.7) | 5 (35.7) | |
| Visit III | 14 | 14 (100.0) | 4 (28.6) | |
| Visit IV | 23 | 18 (78.3) | 7 (30.4) | |
| Visit V | 32 | 31 (96.9) | 2 (6.3) | |
| Overall | Visit 1 | 84 | 74 (88.1) | 24 (28.6) |
| Visit II | 91 | 83 (91.2) | 23 (25.3) | |
| Visit III | 122 | 119 (97.5) | 24 (19.7) | |
| Visit IV | 168 | 114 (67.9) | 30 (17.9) | |
| Visit V | 184 | 148 (80.4) | 64 (34.8) |
Table text extracted from the original PDF; superscript letters are shown inline. The original table image is below.
View original table image
| District | Visit | No. of protected zero-grazing units visited | Percentage farmers with sufficient pasture | Percentage farmers with sufficient legumes |
|---|---|---|---|---|
| Budaka | Visit 1 | 14 | 13 (92.9) | 2 (14.3) |
| Visit II | 14 | 12 (85.7) | 3 (21.4) | |
| Visit III | 22 | 20 (90.9) | 2 (9.1) | |
| Visit IV | 33 | 14 (42.4) | 4 (12.1) | |
| Visit V | 29 | 19 (65.5) | 10 (34.5) | |
| Iganga | Visit 1 | 14 | 13 (92.9) | 4 (25.6) |
| Visit II | 16 | 16 (100.0) | 6 (37.5) | |
| Visit III | 16 | 16 (100.0) | 6 (37.5) | |
| Visit IV | 30 | 27 (90.0) | 4 (13.3) | |
| Visit V | 45 | 45 (100.0) | 4 (8.9) | |
| Mayuge | Visit 1 | 14 | 12 (85.7) | 0 (0.0) |
| Visit II | 19 | 17 (89.5) | 5 (26.3) |
Table text extracted from the original PDF; superscript letters are shown inline. The original table image is below.
View original table image
Conclusion
In conclusion, pyrethroid treated netting around zero-grazing units supplemented with periodic spraying of cattle effectively protected dairy cattle against trypanosomosis and maintained their good health. Farmers' observation indicated that as netting became older, they became more fragile. Larger nets of 1.5m high had a longer duration of 6 to 8 months than smaller nets of 1.0 m high, whose duration was 3 to 4 months. While replacement of netting for all zero-grazing units was desirable after the first year of installation, farmers could not afford the cost of netting replacement of 100,000 Uganda shillings (approx. USD 30) per zero-grazing unit.
Acknowledgement
AcknowledgmentWe are grateful to Joseph Muboli and Patrick Odyek for their technical assistance. We thank the former Dr. Charles Peter Otim, the former Director, Livestock Health Research Institute, Tororo, Uganda for his support during the study. In addition, we thank the District Veterinary staff from Budaka, Busia, Iganga, Manafwa, Mayuge and Tororo districts of Uganda for their incredible support during the study.
Figures and tables from the paper
| District | Visit | No. of dairy cattle sampled | Trypanosome species prevalence | — | — | — | Overall prevalence |
|---|---|---|---|---|---|---|---|
| T.b* | T.c* | T.v* | T.c/T.v* | ||||
| Budaka | Visit I | 24 | 0.0 | 0.0 | 4.2 | 0.0 | 4.2 |
| Visit II | 27 | 0.0 | 3.7 | 3.7 | 0.0 | 7.4 | |
| Visit III | 34 | 0.0 | 0.0 | 0.0 | 0.0 | 0.0 | |
| Visit IV | 37 | 0.0 | 0.0 | 0.0 | 0.0 | 0.0 | |
| Visit V | 43 | 0.0 | 0.0 | 0.0 | 0.0 | 0.0 | |
| Iganga | Visit I | 24 | 0.0 | 0.0 | 0.0 | 0.0 | 0.0 |
| Visit II | 26 | 0.0 | 0.0 | 0.0 | 0.0 | 0.0 | |
| Visit III | 26 | 0.0 | 0.0 | 0.0 | 0.0 | 0.0 | |
| Visit IV | 50 | 0.0 | 0.0 | 0.0 | 0.0 | 0.0 | |
| Visit V | 72 | 0.0 | 0.0 | 0.0 | 0.0 | 0.0 | |
| Mayuge | Visit I | 24 | 0.0 | 0.0 | 16.7 | 8.3 | 25.0 |
| Visit II | 20 | 0.0 | 0.0 | 0.0 | 0.0 | 0.0 | |
| Visit III | 33 | 0.0 | 0.0 | 0.0 | 0.0 | 0.0 | |
| Visit IV | 42 | 0.0 | 0.0 | 0.0 | 0.0 | 0.0 | |
| Visit V | 52 | 0.0 | 0.0 | 0.0 | 0.0 | 0.0 | |
| Busia | Visit I | 26 | 0.0 | 0.0 | 0.0 | 0.0 | 0.0 |
Table text extracted from the original PDF; superscript letters are shown inline. The original table image is below.
View original table image
| District | Visits* | No. of protected zero-grazing units visited | No. of Dairy cows | — | — | — | Daily Milk Yield (L) | — |
|---|---|---|---|---|---|---|---|---|
| Total cattle | Dry cows | Lactating cows | Average milk yield (L) per cow per day | Min (L) per cow per day | Max (L) per cow per day | |||
| Budaka | Visit 1 | 14 | 24 | 3 | 11 | 6.0 | 1.5 | 12.0 |
| Visit II | 14 | 27 | 7 | 7 | 3.7 | 0.5 | 8.0 | |
| Visit III | 22 | 34 | 6 | 11 | 4.0 | 1.0 | 7.5 | |
| Visit IV | 33 | 37 | 6 | 13 | 3.7 | 1.0 | 15.0 | |
| Visit V | 29 | 43 | 17 | 9 | 5.5 | 2.0 | 10.0 | |
| Busia | Visit 1 | 14 | 26 | 1 | 12 | 4.8 | 1.0 | 10.0 |
| Visit II | 15 | 27 | 1 | 11 | 4.0 | 1.5 | 12.0 | |
| Visit III | 29 | 33 | 13 | 11 | 6.3 | 2.0 | 12.0 | |
| Visit IV | 29 | 42 | 11 | 11 | 6.0 | 3.0 | 14.0 | |
| Visit V | 15 | 27 | 14 | 6 | 4.7 | 2.0 | 10.0 | |
| Iganga | Visit 1 | 14 | 24 | 1 | 14 | 6.2 | 2.0 | 13.0 |
Table text extracted from the original PDF; superscript letters are shown inline. The original table image is below.
View original table image
References
18 in the original paper- Okoth JO. Tsetse and trypanosomosis control problems in South-east Uganda: Past, present and alternative strategies. Schweiz med. Wochenstr. 1999;129(3132):1091-1098, PMID: 10476547.
- Meyer A, Holt HR, Selby R, Guitan J. Past and ongoing tsetse and animal trypanosomiasis control operations in Five African countries: A systematic Review. PLOSNeglected Tropical Diseases. 2016;10(12):e-0005247. Doi: 10.1371/Journal.pntd.0005247.
- Bauer B, Gitau D, Oloo F, Karanja S. Evaluation of preliminary title to protect zero-grazed dairy cattle with insecticide-treated mosquito netting in Western Kenya. Tropical Animal Health and Production. 2006;38(1):2934. PMID: 24447638.
- Magona JW, Walubengo J, Kabi F, Odimin JT, Ocaido M. Mapping the distribution of tsetse and animal trypanosomosis in selected districts of Uganda to facilitate targeting control measures. Bulletin of Animal Health and Production in Africa. 2017;65(3):455-465.
- Magona J, Okuna N, Katabazi B, Omollo P, Okoth J, Mayende J. Control of tsetse and animal trypanosomosis using a combination of tsetse-trapping, pour-on and chemotherapy along the Uganda-Kenya border. Rev. Elev. Med. Vet pays Trop. 1998;51(4):311-5.
- Févre EM, Coleman PG, Odiit M, Magona JW, Welburn SC, Woolhouse ME. The origins of a new Trypanosoma brucei rhodesiense sleeping sickness outbreak in eastern Uganda. Lancet. 2001;358(9282):625-8. PMID: 11530149.
- Kabasa JD. Public-private partnership works to stamp out sleeping sickness in Uganda. Trends of Parasitology. 2007;23(5):191-2. Doi 10,1016/j.pt2007.03,006 PMID: 17392023.
- Magona JW, Walubengo J. Mass-treatment and insecticide-spraying of animal reservoirs for emergency control of Rhodesiense sleeping sickness in Uganda. Journal Vector Borne Diseases. 2011;48(2):105-8. PMID: 21715734.
- Bauer B, Holzgrefe B, Mahama CI, Baumann MM, Mehlitz D, Clausen PH. Managing tsetse transmitted trypanosomosis by insecticide treated nets: affordable and suitable method for resource poor pig farmers in Ghana. PLOS Neglected Tropical Diseases. 2011;5(10):e1343.
- Maia MF, Abonuusum A, Lorenz LM, Clausen PH, Bauer B. The Effect of Deltamethrin-treated Net Fencing around Cattle Enclosures on Outdoor biting Mosquitoes in Kumasi, Ghana. PLOS One. 2012;7(9):e45794.
- Megersa B, Seyoum W, Lejebo F, Moje N, Sheferew D. Effect of insecticide treated nets fence in protecting cattle against tsetse and other biting flies in Arba Minch Zuria district, Southern Ethiopia. Ethiopian Veterinary Journal. 2017;21(1):117-130. http://dx.doi.org/10.4314/evj.v2 (i).10.
- Woo PKT. The haematocrit centrifugation technique for the detection of trypanosomiasis in blood. Canadian Journal of Zoology. 1969 Sep 1;47(5):921-3.
- Murray M, Murray PK, McIntyre WIM. An improved parasitological technique for the diagnosis of African trypanosomiasis. Transactions of the Royal Society of Tropical Medicine and Hygiene. 1977;71(4):325-326.
- Torr SJ, Maudlin I, Vale GA. Less is more: restricted application of insecticide to cattle to improve the cost and efficacy of tsetse control. Medical and Veterinary Entomology. 2007;21(1):53-64.
- Angwech H, Kaddu JB, Nyeko JHP. Tick-borne parasites of domestic ruminants in Gulu district, Uganda: Prevalence varied with the intensity of management. Veterinary Research. 2011;4(2):28-33.
- Bruce D, Wilson A. A trial to control or eradicate Amblyomma hebraeum ticks and heartwater on three ranches in Zimbabwe. Annals of the New York Academy of Science. 1998;849:381-383.
- Lejebo F, Dumale D, Urga B, Balcha E. The effect of Deltamethrin treated net on tsetse and other insects in Shara Kebeles Gamo zones, Snnprs. International Journal of Research studies. 2019;7(9):27-36.
- Magona JW, Walubengo J, Odimin JT. Acute haemorrhagic syndrome of bovine trypanosomosis in Uganda. Acta Tropica. 2008;107(2):186-191.
Cited by 1
From OpenAlex, OpenCitations and reference lists read by Scinovex
- Participation of livestock farmers and community animal health workers in one health intervention to control zoonotic diseases in Rwanda: a qualitative study ↗
Shema Hugor, Jonathan Izudi, Anselme Shyaka · BMC Infectious Diseases · 2026
BACKGROUND: In zoonotic disease hotspots, engaging local communities in zoonotic disease monitoring and reporting is essential for effective prevention and early outbreak detection. In Rwanda, the Eastern Province has experienced nearly 90% of all zoonotic disease outbreaks. This qualitative study explored the participation of livestock farmers and community animal health workers (CAHWs) in One Health interventions aimed at controlling zoonotic…
❝ 2PDF