Scinovex

Research article · 2020 · Full text

International Journal of Advanced Biochemistry Research

Comparison of 150mmol/L and 250mmol/L concentration of sodium hydroxide in Jaffe's two point method for serum creatinine measurement with respect to linearity of assay

Riddhiben Harshil PatelGaurang Anandpara

Volume 4(1) · Pages 42–46 · DOI: 10.33545/26174693.2020.v4.i1a.79 ↗

Research areasClinical Laboratory Practices and Quality ControlHemodynamic Monitoring and Therapy

↓ Read full-text PDF0 citations

Abstract

Author-written

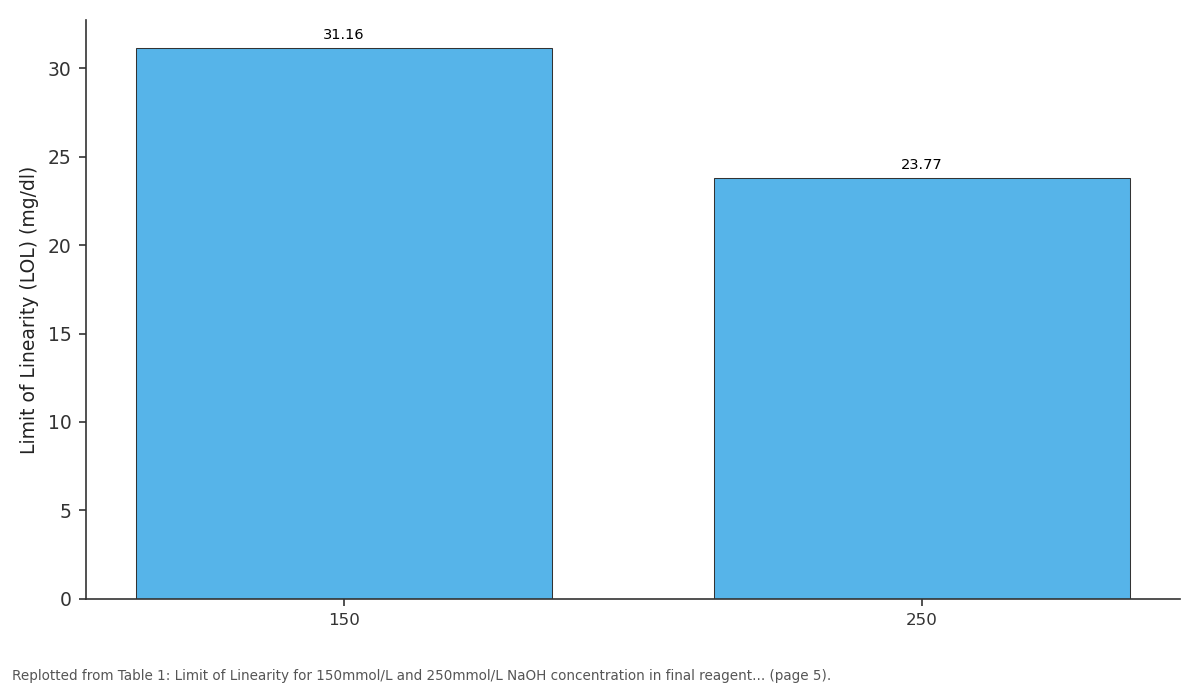
Objectives: Objective of the study is to perform linearity check for Creatinine measurement with Jaffe's two point method using CLSI EP-6 guideline for 150 mmol/L, 250mmol/L NaOH concentration in final reagent mixture. Material & Method: Leftover serum of samples received by the laboratory, devoid of patient identification, was used to make pool of serum. Serum creatinine reagents have NaOH of 150 mmol/L, 250 mmol/L were prepared. Serial dilution of pooled serum spiked with creatinine powder was prepared. Creatinines were measured in series of dilution. Linear regression analysis of each dilution series to find linearity limit was performed. esult & Discussion: This study evaluated Linearity difference plot using CLIA criteria (15% or 0.3 mg/dl whichever is higher) for creatinine at 95% confidence limit.7.5% of result or 0.15 mg/dl were used for plotting Linearity Difference plot. If any the two conditions are satisfied at a given point in the Linearity Difference Plot, the point is considered within linearity. 250 mmol/L NaOH in final reagent mixture gives limit of linearity 23.77mg/dl and 150 mmol/L NaOH in final reagent mixture gives limit of linearity 31.16 mg/dl. Conclusion: 150 mmol/L final reagent concentration of NaOH gives higher linearity of 31.16 mg/dl, low slop (a=29.23) indicating high sensitivity of the reagent, low y-intercept (b=-0.4578) indicating minimum effect of non-creatinine chromogens; i.e. high specificity than 250mmol/L final reagent concentration of NaOH.

Summary

Source-checked

Plain-language reading of the full paper, prepared with AI and checked against the text. Each point links to the authors' own words.

  1. Why it matters

    • Serum creatinine measurement is a common clinical chemistry test used to diagnose, monitor treatment, and judge the prognosis of renal disorders. View evidence ↗

      Why it matters

      Serum creatinine measurement is a common clinical chemistry test used to diagnose, monitor treatment, and judge the prognosis of renal disorders.

      In the paper's own words

      “Creatinine measurement in serum is one of the most frequently used laboratory examination in clinical chemistry laboratory. It is used in diagnosis, treatment monitoring and judging prognosis of renal disorders.”

      Page 1

      Found in: Introduction

      Read it in the full textOpen PDF at page 1 ↗
    • For clinical utility, creatinine reports must be accurate and precise, requiring well-defined parameters such as the limit of linearity. View evidence ↗

      Why it matters

      For clinical utility, creatinine reports must be accurate and precise, requiring well-defined parameters such as the limit of linearity.

      In the paper's own words

      “In order to be useful to the clinicians, the creatinine reporting should be accurate, precise, free from interference. It should have well defined limit of blank, limit of detection, limit of qualification and limit of linearity.”

      Page 1

      Found in: Introduction

      Read it in the full textOpen PDF at page 1 ↗
    • A higher limit of linearity (LoL) is beneficial because it reduces the need for sample dilution and repeat testing, thereby lowering costs. View evidence ↗

      Why it matters

      A higher limit of linearity (LoL) is beneficial because it reduces the need for sample dilution and repeat testing, thereby lowering costs.

      In the paper's own words

      “Too low of LoL increases repeat testing, increasing cost. Higher LoL decreases the dilution of sample and sample load.”

      Page 5

      Found in: Materials and Methods

      Read it in the full textOpen PDF at page 5 ↗
  2. The question

    • The study aimed to compare the limit of linearity (LoL) of Jaffe's reaction mixture using two different sodium hydroxide (NaOH) concentrations: 150 mmol/L and 250 mmol/L. View evidence ↗

      The question

      The study aimed to compare the limit of linearity (LoL) of Jaffe's reaction mixture using two different sodium hydroxide (NaOH) concentrations: 150 mmol/L and 250 mmol/L.

      In the paper's own words

      “This study aims at comparing 150mmol/L and 250mmol/L NaOH concentration in Jaffe's reaction mixture with respect to limit of linearity (LOL).”

      Page 1

      Found in: Introduction

      Read it in the full textOpen PDF at page 1 ↗
  3. What they did

    • The researchers used a pool of de-identified leftover serum samples from the laboratory. View evidence ↗

      What they did

      The researchers used a pool of de-identified leftover serum samples from the laboratory.

      In the paper's own words

      “Leftover serum of samples received by the laboratory, devoid of patient identification, was used to make pool of serum.”

      Page 1

      Found in: Materials and Methods

      Read it in the full textOpen PDF at page 1 ↗
    • A high-concentration serum pool was created by dissolving 25 mg of creatinine powder in 25 ml of the serum pool, while the remaining serum served as the low pool. View evidence ↗

      What they did

      A high-concentration serum pool was created by dissolving 25 mg of creatinine powder in 25 ml of the serum pool, while the remaining serum served as the low pool.

      In the paper's own words

      “Higher concentration pool was made by dissolving 25mg creatinine powder in 25ml leftover serum pool. Remaining serum pool was used as low serum pool.”

      Page 1

      Found in: Materials and Methods

      Read it in the full textOpen PDF at page 1 ↗
    • Following CLSI EP-6A guidelines, an 11-point serial dilution was performed using the high and low serum pools. View evidence ↗

      What they did

      Following CLSI EP-6A guidelines, an 11-point serial dilution was performed using the high and low serum pools.

      In the paper's own words

      “11 point serial dilution of prepared higher pool with lower pool was done as recommended by CLSI EP-6A guideline [1].”

      Page 2

      Found in: Materials and Methods

      Read it in the full textOpen PDF at page 2 ↗
    • Measurements were conducted in four replicates for each dilution using an Erba XL 640 autoanalyser. View evidence ↗

      What they did

      Measurements were conducted in four replicates for each dilution using an Erba XL 640 autoanalyser.

      In the paper's own words

      “Creatinine measurement with each reagent in each member of series of dilution in 4 replicates were performed in Erba XL 640 autoanalyser.”

      Page 2

      Found in: Materials and Methods

      Read it in the full textOpen PDF at page 2 ↗
    • The linearity difference plots were based on CLIA acceptability criteria, using limits of 7.5% of the result or 0.15 mg/dl. View evidence ↗

      What they did

      The linearity difference plots were based on CLIA acceptability criteria, using limits of 7.5% of the result or 0.15 mg/dl.

      In the paper's own words

      “As CLIA acceptability for creatinine is 15% or 0.3 mg/dl whichever is higher, 7.5% of result or 0.15 mg/dl were used for plotting Linearity Difference plot.”

      Page 2

      Found in: Results of

      Read it in the full textOpen PDF at page 2 ↗
  4. What they found

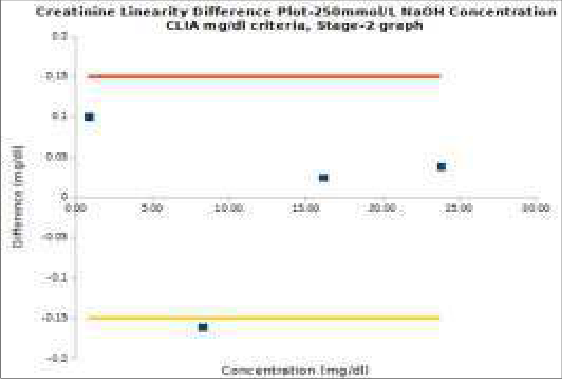
    • The 150 mmol/L NaOH reagent demonstrated a higher limit of linearity (31.16 mg/dl) compared to the 250 mmol/L NaOH reagent (23.77 mg/dl). View evidence ↗

      What they found

      The 150 mmol/L NaOH reagent demonstrated a higher limit of linearity (31.16 mg/dl) compared to the 250 mmol/L NaOH reagent (23.77 mg/dl).

      In the paper's own words

      “250 mmol/L NaOH in final reagent mixture gives limit of linearity 23.77mg/dl and 150 mmol/L NaOH in final reagent mixture gives limit of linearity 31.16 mg/dl.”

      Page 1

      Found in: Materials and Methods

      Read it in the full textOpen PDF at page 1 ↗
    • The 150 mmol/L NaOH reagent had a slope of 29.23 and a y-intercept of -0.4578, while the 250 mmol/L reagent had a slope of 28.27 and a y-intercept of -0.6996. View evidence ↗

      What they found

      The 150 mmol/L NaOH reagent had a slope of 29.23 and a y-intercept of -0.4578, while the 250 mmol/L reagent had a slope of 28.27 and a y-intercept of -0.6996.

      In the paper's own words

      “NaOH Concentration(mmol/L) | Limit of Linearity (LOL) (mg/dl) | Slop (a) | Y-Intercept 150 | 31.16 | 29.23 | -0.4578 250 | 23.77 | 28.27 | -0.6996”

      Page 5

      Found in: Table 1

      Read it in the full textOpen PDF at page 5 ↗
    • The 150 mmol/L reagent showed higher sensitivity due to its slope and lower interference from non-creatinine chromogens due to its lower y-intercept. View evidence ↗

      What they found

      The 150 mmol/L reagent showed higher sensitivity due to its slope and lower interference from non-creatinine chromogens due to its lower y-intercept.

      In the paper's own words

      “Lower Slope of 150mmol/L reagent shows higher sensitivity and lower y-intercept shows lower non creatinine chromogens interference.”

      Page 5

      Found in: Materials and Methods

      Read it in the full textOpen PDF at page 5 ↗
  5. What it means

    • The authors concluded that the 150 mmol/L NaOH concentration is superior to the 250 mmol/L concentration because it provides higher linearity, higher sensitivity, and higher specificity. View evidence ↗

      What it means

      The authors concluded that the 150 mmol/L NaOH concentration is superior to the 250 mmol/L concentration because it provides higher linearity, higher sensitivity, and higher specificity.

      In the paper's own words

      “Conclusion: 150 mmol/L final reagent concentration of NaOH gives higher linearity of 31.16 mg/dl, low slop (a=29.23) indicating high sensitivity of the reagent, low y-intercept (b=-0.4578) indicating minimum effect of non-creatinine chromogens; i.e. high specificity than 250mmol/L final reagent concentration of NaOH.”

      Page 1

      Found in: Materials and Methods

      Read it in the full textOpen PDF at page 1 ↗

Visual summary

2 visuals

Illustrations explain the paper; charts are replotted from the paper's own table values.
AI-generated illustration
AI-generated conceptual illustration (glass test tubes containing yellow-orange chemical reagents and serum). It explains the idea and does not show study data.↗ Enlarge
Comparison of Linearity Limits
AI-generated conceptual illustration (glass test tubes containing yellow-orange chemical reagents and serum). It explains the idea and does not show study data.

AI-generated conceptual illustration (glass test tubes containing yellow-orange chemical reagents and serum). It explains the idea and does not show study data.

Open full-size image ↗

Comparison of Linearity Limits

AI-generated conceptual illustration (glass test tubes containing yellow-orange chemical reagents and serum). It explains the idea and does not show study data.

View source evidence ↗
Replotted from source data
Replotted from Table 1 (page 5) of the original paper. Every bar is the paper's own table value.↗ Enlarge
Limit of Linearity (LOL) (mg/dl): 150 vs 250
Replotted from Table 1 (page 5) of the original paper. Every bar is the paper's own table value.

Replotted from Table 1 (page 5) of the original paper. Every bar is the paper's own table value.

Open full-size image ↗

Limit of Linearity (LOL) (mg/dl): 150 vs 250

Replotted from Table 1 (page 5) of the original paper. Every bar is the paper's own table value.

View source evidence ↗

Figures & tables

From the original paper
(Illustration 1): Creatinine Linearity-150mmol/L of NaOHFigure 1Page 2(Illustration 2) Creatinine Linearity Difference plot-150mmol/L NaOH concentration CLIA mg/dl criteria, Stage-1 Above graphFigure 2Page 2Illustration 3: Creatinine Linearity Difference plot-150mmol/L NaOH concentration CLIA% criteria, Stage-1Figure 3Page 3(Illustration 4) Creatinine Linearity Difference plot-150mmol/L NaOH concentration CLIA mg/dl criteria, Stage-2Figure 4Page 3(Illustration 5) Creatinine Linearity Difference plot-150mmol/L NaOH concentration CLIA% criteria, Stage-2Figure 5Page 3(Illustration 6) Creatinine linearity-250mmol/L NaOH concentrationFigure 6Page 4Creatinine Linearity Difference plot-250mmol/L NaOH concentration CLIA mg/dl criteria, Stage-1Figure 7Page 4Creatinine Linearity Difference plot-250mmol/L NaOH concentration CLIA mg/dl criteria, Stage-1Figure 8Page 4Limit of Linearity for 150mmol/L and 250mmol/L NaOH concentration in final reagent mixtureTable 1Page 5Creatinine Linearity Difference plot-250mmol/L NaOH concentration CLIA mg/dl criteria, Stage-2Figure 9Page 5
FULL TEXT Original article · reflowed for reading

Introduction

Creatinine measurement in serum is one of the most frequently used laboratory examination in clinical chemistry laboratory. It is used in diagnosis, treatment monitoring and judging prognosis of renal disorders. In order to be useful to the clinicians, the creatinine reporting should be accurate, precise, free from interference. It should have well defined limit of blank, limit of detection, limit of qualification and limit of linearity. It is required to compare NaOH concentration of these reactants to improve its clinical usefulness. This study aims at comparing 150mmol/L and 250mmol/L NaOH concentration in Jaffe's reaction mixture with respect to limit of linearity (LOL). Measurement of Limit of Linearity is essential to device alternate strategy for measuring samples when results are beyond the limit. Measurement of Limit of Linearity is essential to device alternate strategy for measuring samples when results are beyond the limit.

Materials and Methods

Leftover serum of samples received by the laboratory, devoid of patient identification, was used to make pool of serum which had creatinine concentration less than 1.0mg/dl with no visible lipemia, hemolysis and icterus. Higher concentration pool was made by dissolving 25mg creatinine powder in 25ml leftover serum pool. Remaining serum pool was used as low serum pool. Serum creatinine reagent 1 were made by adding SDS 3.47mmol/L and Brij 3gm/L and NaOH 300mmol/L in which final reagent mixture have NaOH reagent mixture have NaOH of 150 mmol/L. Serum creatinine reagent 1 were made by adding SDS 3.47mmol/L and Brij 3gm/L and NaOH 500mmol/L in which final reagent mixture have NaOH reagent mixture have NaOH of 250 mmol/L. Creatinine reagent 2 were made by adding picric acid 20mmol/L and Brij 3gm/L. 11 point serial dilution of prepared higher pool with lower pool was done as recommended by CLSI EP-6A guideline [1] . Calibration of each reagent was done by Randox Normal Calibrator (828UN), Randox Abnormal Calibrator (591UE) and Bovine Albumin Blank (5 gm%) whose assigned value was 1.37mg/dl, 4.01mg/dl and 0.0 mg/dl respectively.

Creatinine measurement with each reagent in each member of series of dilution in 4 replicates were performed in Erba XL 640 autoanalyser. Graph of relative concentration vs. observed concentration was plotted in. First, Second and third order polynominals were found for each plot using spreadsheet software. Deviations from linearity (DLi) were evaluated as follows for each point of the plot. DL2i were used to analyse linearity as it was closed to 1. CLIA acceptability criteria was used to analyse the sample.

Results

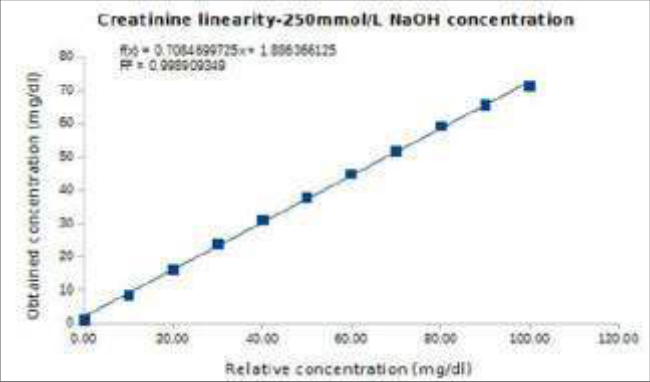
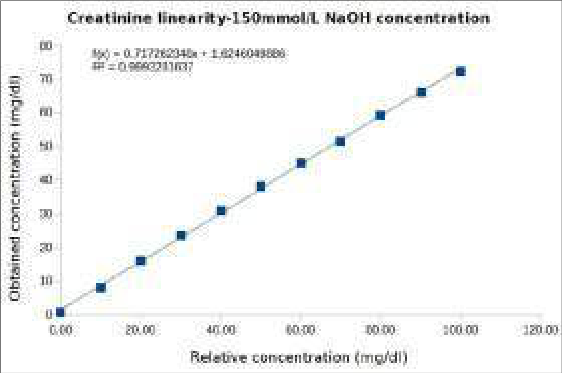
Following tables and graphs shows results of the study. Above graph shows relationship between relative concentration and obtained concentration. Relative concentration is taken from 0 to 100; as per CLSI EP-6A, any values can be used as relative concentrations so far as their relative values remain same [1] .

Results of

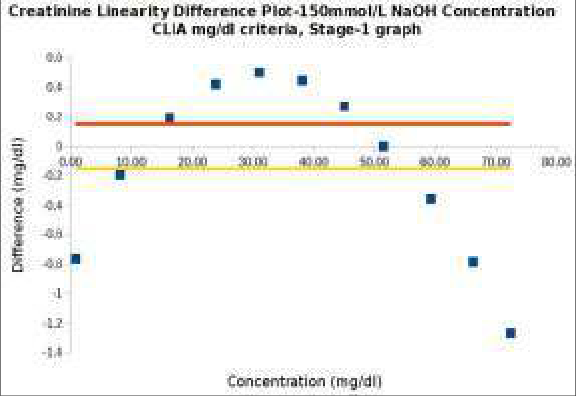
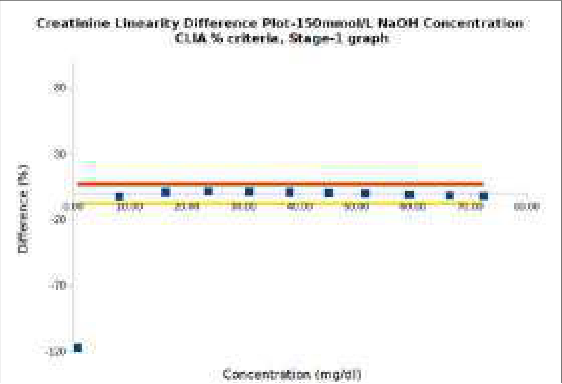
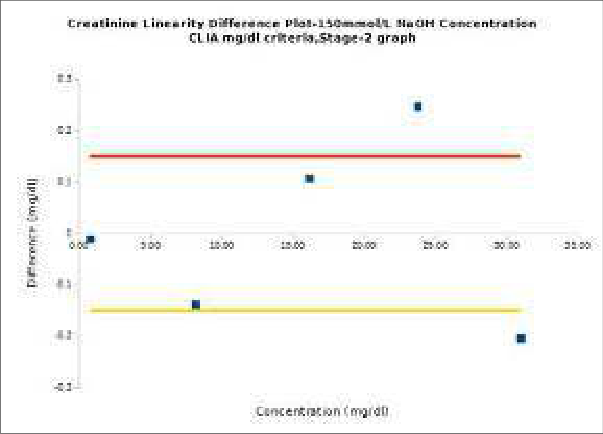
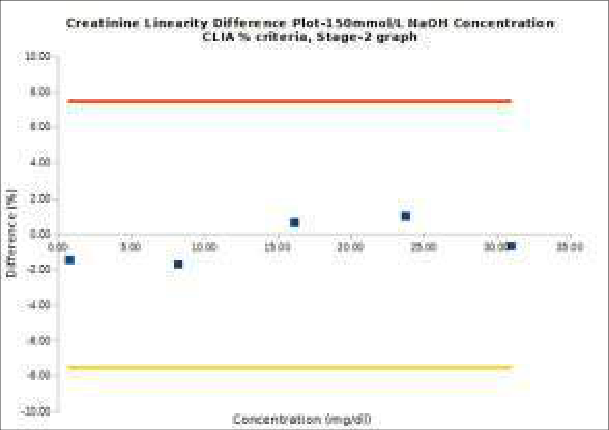
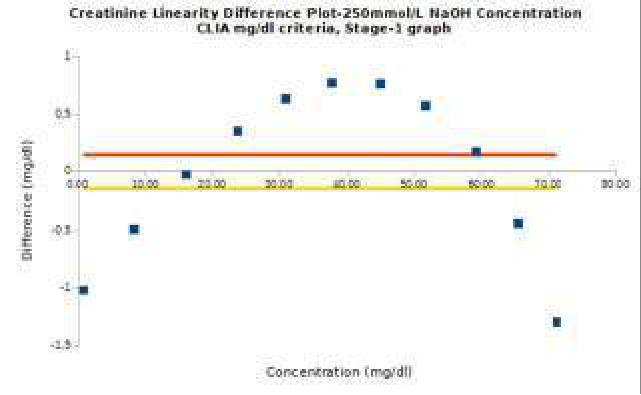
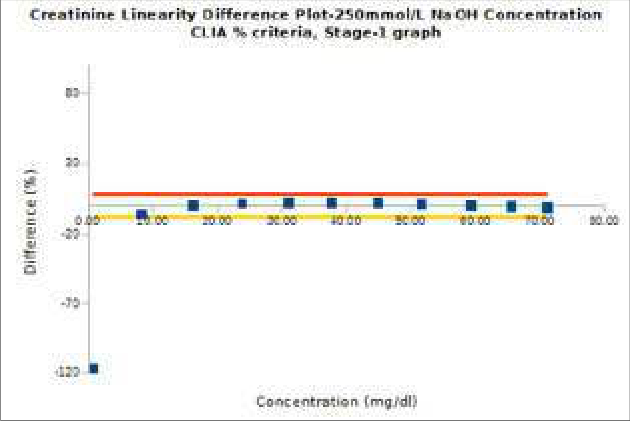
Creatinine Linearity Difference Plot for 150 mmol/L NaOH concentration, Stage-1: As described in CLSI EP-6A, calculations were done for making Linearity Difference plot. The plot requires definition of acceptability criteria. This study evaluated Linearity difference plot using CLIA criteria for creatinine at 95% confidence limit. As CLIA acceptability for creatinine is 15% or 0.3 mg/dl whichever is higher, 7.5% of result or 0.15 mg/dl were used for plotting Linearity Difference plot. If any the two conditions are satisfied at a given point in the Linearity Difference Plot, the point is considered within linearity. Stage-1 is Linearity Difference Plot which includes all the 11 points. Stage-2 is Linerarity Difference Plot which includes only those points which make linearity evaluation acceptable at all points. The calculations of Linearity Difference plot are explained in table 11 for 150 mmol/L NaOH. Above graph shows that except point 1, all other points are within the ±7.5% limit. By both, % and mg/dl criteria, point 1 is unacceptable, so, the analysis is repeated by removing highest point, one by one till the all the points come within the acceptable criteria. Above graph shows that except point 1, all other points are within the ±7.5% limit.Only 1 point is within the 0.15mg/dl. By both, % and mg/dl criteria, point 1 is unacceptable, so, the analysis is repeated by removing higest point, one by one till the all the points come within the acceptable criteria.

Creatinine Linearity Difference

Creatinine Linearity Difference

Creatinine Linearity Difference

Creatinine Linearity Difference

Figures and tables from the paper

Figure 1. (Illustration 1): Creatinine Linearity-150mmol/L of NaOH
(Illustration 1): Creatinine Linearity-150mmol/L of NaOH↗ Enlarge
Figure 1
(Illustration 1): Creatinine Linearity-150mmol/L of NaOH

(Illustration 1): Creatinine Linearity-150mmol/L of NaOH

Open full-size image ↗
Original paper figureSource PDF · page 2 ↗
Figure 2. (Illustration 2) Creatinine Linearity Difference plot-150mmol/L NaOH concentration CLIA mg/dl criteria, Stage-1 Above graph
(Illustration 2) Creatinine Linearity Difference plot-150mmol/L NaOH concentration CLIA mg/dl criteria, Stage-1 Above graph↗ Enlarge
Figure 2
(Illustration 2) Creatinine Linearity Difference plot-150mmol/L NaOH concentration CLIA mg/dl criteria, Stage-1 Above graph

(Illustration 2) Creatinine Linearity Difference plot-150mmol/L NaOH concentration CLIA mg/dl criteria, Stage-1 Above graph

Open full-size image ↗
Original paper figureSource PDF · page 2 ↗
Figure 3. Illustration 3: Creatinine Linearity Difference plot-150mmol/L NaOH concentration CLIA% criteria, Stage-1
Illustration 3: Creatinine Linearity Difference plot-150mmol/L NaOH concentration CLIA% criteria, Stage-1↗ Enlarge
Figure 3
Illustration 3: Creatinine Linearity Difference plot-150mmol/L NaOH concentration CLIA% criteria, Stage-1

Illustration 3: Creatinine Linearity Difference plot-150mmol/L NaOH concentration CLIA% criteria, Stage-1

Open full-size image ↗
Original paper figureSource PDF · page 3 ↗
Figure 4. (Illustration 4) Creatinine Linearity Difference plot-150mmol/L NaOH concentration CLIA mg/dl criteria, Stage-2
(Illustration 4) Creatinine Linearity Difference plot-150mmol/L NaOH concentration CLIA mg/dl criteria, Stage-2↗ Enlarge
Figure 4
(Illustration 4) Creatinine Linearity Difference plot-150mmol/L NaOH concentration CLIA mg/dl criteria, Stage-2

(Illustration 4) Creatinine Linearity Difference plot-150mmol/L NaOH concentration CLIA mg/dl criteria, Stage-2

Open full-size image ↗
Original paper figureSource PDF · page 3 ↗
Figure 5. (Illustration 5) Creatinine Linearity Difference plot-150mmol/L NaOH concentration CLIA% criteria, Stage-2
(Illustration 5) Creatinine Linearity Difference plot-150mmol/L NaOH concentration CLIA% criteria, Stage-2↗ Enlarge
Figure 5
(Illustration 5) Creatinine Linearity Difference plot-150mmol/L NaOH concentration CLIA% criteria, Stage-2

(Illustration 5) Creatinine Linearity Difference plot-150mmol/L NaOH concentration CLIA% criteria, Stage-2

Open full-size image ↗
Original paper figureSource PDF · page 3 ↗
Figure 6. (Illustration 6) Creatinine linearity-250mmol/L NaOH concentration
(Illustration 6) Creatinine linearity-250mmol/L NaOH concentration↗ Enlarge
Figure 6
(Illustration 6) Creatinine linearity-250mmol/L NaOH concentration

(Illustration 6) Creatinine linearity-250mmol/L NaOH concentration

Open full-size image ↗
Original paper figureSource PDF · page 4 ↗
Figure 7. Creatinine Linearity Difference plot-250mmol/L NaOH concentration CLIA mg/dl criteria, Stage-1
Creatinine Linearity Difference plot-250mmol/L NaOH concentration CLIA mg/dl criteria, Stage-1↗ Enlarge
Figure 7
Creatinine Linearity Difference plot-250mmol/L NaOH concentration CLIA mg/dl criteria, Stage-1

Creatinine Linearity Difference plot-250mmol/L NaOH concentration CLIA mg/dl criteria, Stage-1

Open full-size image ↗
Original paper figureSource PDF · page 4 ↗
Figure 8. Creatinine Linearity Difference plot-250mmol/L NaOH concentration CLIA mg/dl criteria, Stage-1
Creatinine Linearity Difference plot-250mmol/L NaOH concentration CLIA mg/dl criteria, Stage-1↗ Enlarge
Figure 8
Creatinine Linearity Difference plot-250mmol/L NaOH concentration CLIA mg/dl criteria, Stage-1

Creatinine Linearity Difference plot-250mmol/L NaOH concentration CLIA mg/dl criteria, Stage-1

Open full-size image ↗
Original paper figureSource PDF · page 4 ↗
Table 1. Limit of Linearity for 150mmol/L and 250mmol/L NaOH concentration in final reagent mixture
NaOH Concentration(mmol/L)Limit of Linearity (LOL) (mg/dl)Slop (a)Y-Intercept
15031.1629.23-0.4578
25023.7728.27-0.6996

Table text extracted from the original PDF; superscript letters are shown inline. The original table image is below.

View original table image
Limit of Linearity for 150mmol/L and 250mmol/L NaOH concentration in final reagent mixture↗ Enlarge
Table 1
Limit of Linearity for 150mmol/L and 250mmol/L NaOH concentration in final reagent mixture

Limit of Linearity for 150mmol/L and 250mmol/L NaOH concentration in final reagent mixture

Open full-size image ↗
Original paper tableSource PDF · page 5 ↗
Figure 9. Creatinine Linearity Difference plot-250mmol/L NaOH concentration CLIA mg/dl criteria, Stage-2
Creatinine Linearity Difference plot-250mmol/L NaOH concentration CLIA mg/dl criteria, Stage-2↗ Enlarge
Figure 9
Creatinine Linearity Difference plot-250mmol/L NaOH concentration CLIA mg/dl criteria, Stage-2

Creatinine Linearity Difference plot-250mmol/L NaOH concentration CLIA mg/dl criteria, Stage-2

Open full-size image ↗
Original paper figureSource PDF · page 5 ↗

References

2 in the original paper
  1. NCCLS. Evaluation of the Linearity of Quantitative measurement Procedures: A Statastical Approach; Approved guideline. NCCLS document EP-6A [ISBN 1-56238-498-8]. NCCLS, 940 West Valley Road, Suite 1400, Wayne Pennsylvania 19087-1898USA, 2003.
  2. Edi. New Delhi: Elsevier, a division of reed Elsevier India Private Limited, 2012.