
Research article · 2022 · Full text
International Journal of Statistics and Applied MathematicsComparison study on fuzzy two stage chain sampling plan
Volume 7(3) · Pages 01–05 · DOI: 10.22271/maths.2022.v7.i3a.815 ↗
Research areasSurvey Sampling and Estimation Techniques
Abstract
Author-writtenAcceptance sampling is effective tool in quality assurance. This paper compares the operating characteristics curve of Fuzzy two stage chain sampling plan with two stage chain sampling plan. OC curve of Fuzzy Two stage chain sampling plan is provided by calculating fuzzy acceptance probability of Fuzzy Two stage chain sampling plan using fuzzy Poisson distributions.
Summary
Source-checkedPlain-language reading of the full paper, prepared with AI and checked against the text. Each point links to the authors' own words.
Why it matters
- Acceptance sampling plans are widely used in industrial settings to decide whether to accept or reject product lots based on sample data. View evidence ↗
- The two-stage chain sampling plan is a specific type of acceptance sampling that incorporates cumulative results from current and previous samples. View evidence ↗
- In some cases, the parameters of acceptance sampling plans are not precise (crisp) values but are instead treated as linguistic variables. View evidence ↗
The question
- The study aims to compare the operating characteristics (OC) curves of a fuzzy two-stage chain sampling plan against a standard two-stage chain sampling plan. View evidence ↗
What they did
- The fuzzy version of the plan treats the sample size (n), fraction defective (p), and the allowable nonconformities (k1, k2) as linguistic variables. View evidence ↗
- The authors used triangular fuzzy numbers and the Poisson distribution to calculate the fuzzy two-stage chain sampling plan. View evidence ↗
- The operating characteristics (OC) curve was used to plot the probability of acceptance against the proportion of defectives. View evidence ↗
What they found
- The fuzzy OC curve is represented as a band with upper and lower bounds, rather than a single line. View evidence ↗
- The width of the fuzzy OC band is directly proportional to the level of uncertainty in the proportion defective and sample size. View evidence ↗
- Using fuzzy parameters provides a range of possibilities (upper and lower bounds) for the sampling plan's acceptance probability. View evidence ↗
What it means
- The authors conclude that incorporating fuzzy parameters into the two-stage chain sampling plan effectively provides upper and lower bounds for the probability of acceptance. View evidence ↗
- The authors recommend using fuzzy set theory to express parameters as linguistic variables when crisp values are difficult to define in production environments. View evidence ↗
Visual summary
1 visualsIllustrations explain the paper; charts are replotted from the paper's own table values.
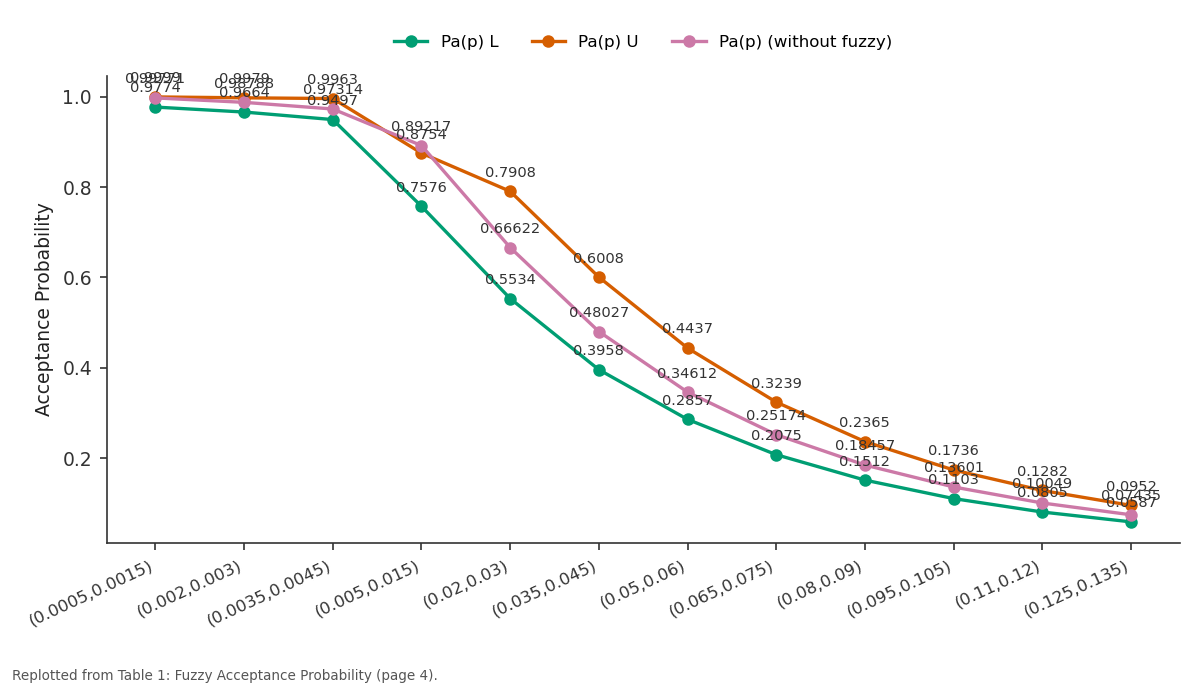
Pa(p) L and Pa(p) U and more: (0.0005,0.0015) vs (0.002,0.003) vs (0.0035,0.0045) vs (0.005,0.015) vs (0.02,0.03)
Replotted from Table 1 (page 4) of the original paper. Every bar is the paper's own table value.
View source evidence ↗Figures & tables
From the original paper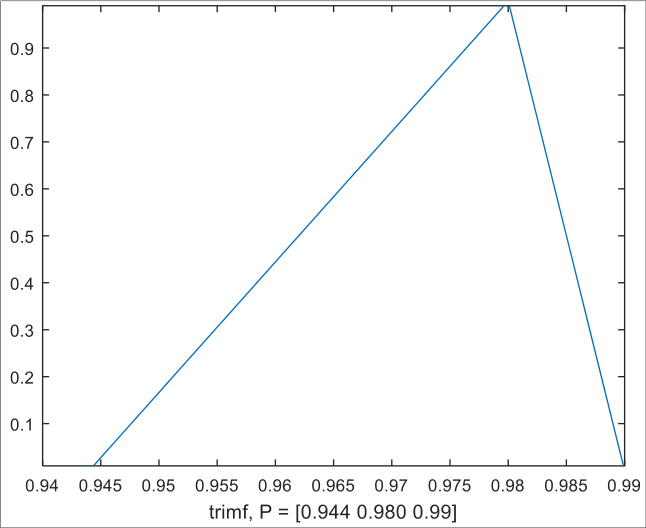 Figure 1
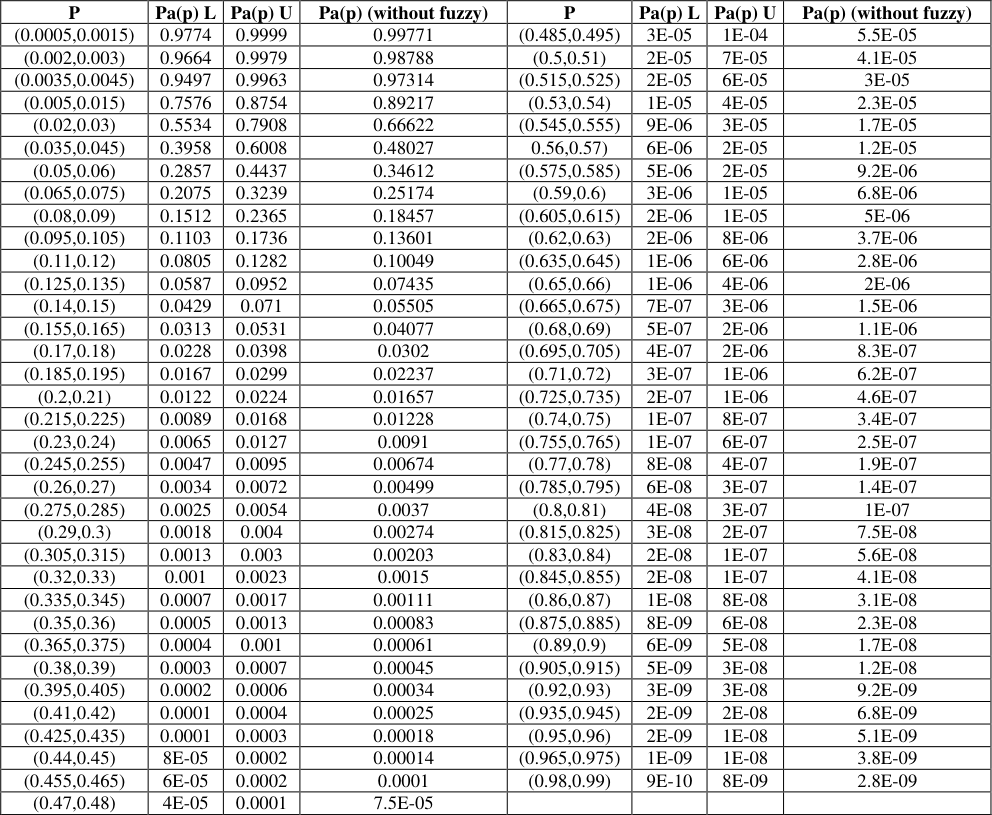 Table 1
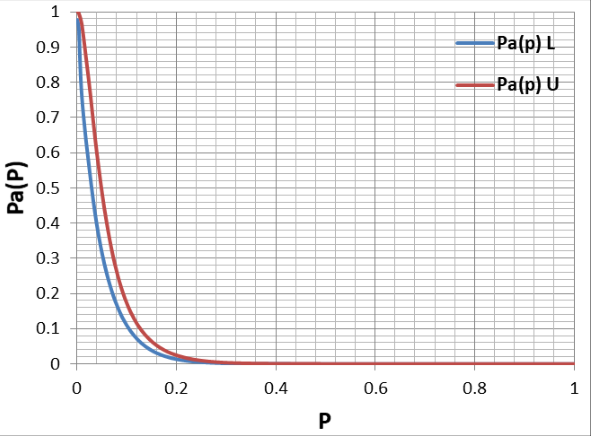 Figure 2
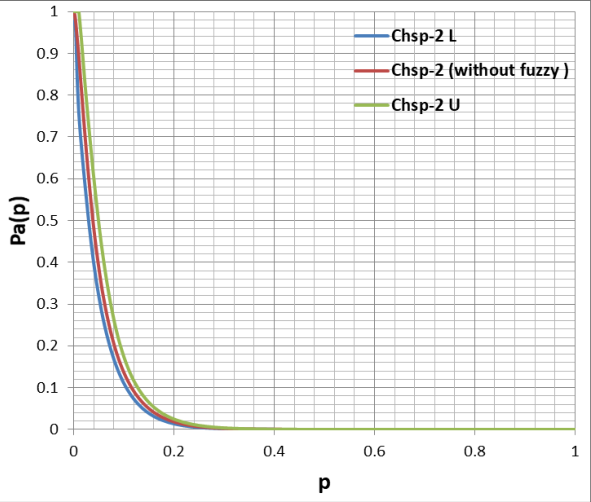 Figure 3
Introduction
A Category of Statistical Quality Control is Acceptance sampling plan which deals with the trust on product quality. Acceptance sampling plan are used widely in industries, to make a decision about acceptance or rejection of lots based on the samples. Two stage chain sampling plan is one of the acceptance sampling plan, uses cumulative results of current sample and results of one or more previous samples. Acceptance sampling plan the parameters are not always consider as crisp values in these cases the parameters are considered as linguistic variables. Application of fuzzy in acceptance sampling plan has done by, Ohta. H, H. Ichihashi (1998) [2] in acceptance SSP using fuzzy membership, Kanagawa. A, Ohta. H (1990) [3] in SSP using fuzzy set theory. Tamaki. F, Kanagawa. A, Ohta. H (1991) [4] in attribute sampling inspection plans using fuzzy. Grzegorzewski. P (2001) [5] in acceptance sampling plans with fuzzy risks and quality levels. Ezzatallah Baloui Jamkhaneh, Bahram Sadeghpour Gildeh (2011) [10] designed OC curve, ASN, ATI, AOQ curves of double sampling plan when proportion defectives are fuzzy number. In 2010 they have discussed SSP and DSP where parameters are fuzzy numbers using fuzzy binomial and fuzzy Poisson distribution, in 2012 they have designed fuzzy acceptance sampling plan in which characteristic curves of single and double sampling plans are derived. Dodge and Stephens introduces a two stage chain sampling plan as an extension of chain sampling plan later Raju. C introduces a construction and selection procedure for two stage sampling plan.
Two stage chain sampling plan
Two stage chain sampling plan are extensions of chain sampling plan proposed by dodge and Stephens in 1966. The procedure make use of the each stages which requires sample size, number of samples over which the cumulative results are taken and the allowable number of nonconforming units applicable to that stage. The operating procedure for two stage chain sampling plan is given below: Select a sample of size n randomly from a succeeding lot, and inspect for the defectives in the samples and record the number of defectives also the cumulative defectives in the sample. Accept the respective lot associated with the new samples, until nonconformities obtained. When k1 succeeding samples are resulted in acceptance, then go for cumulation of defectives in k1 samples up to and not more than k2 samples Accept the respective lot associated with the new samples, during the cumulation of defectives in samples k1<k2.
The second stage of restart period is completed when k2 samples are resulted in acceptance, then go for the cumulation of defectives in k2 samples by adding the results of current samples.
Acceptance Probability of Two stage chain sampling plan is given below:
Two stage chain sampling plan using fuzzy environment
The procedure of two stage chain sampling plan under fuzzy environment is as same as the two stage chain sampling plan. Two stage chain sampling plan are defined by the parameters n, p, k 1 , k 2 , are considered as linguistic variables with the use of fuzzy. Fuzzy Two stage chain sampling plan when the parameters are triangular fuzzy using the Poisson distribution is calculated as below:
Fuzzy fraction defective
Fraction defective p is defined as triangular fuzzy number and α-cut of fraction defective is derived as follows:
Fuzzy number of events Number of events n is defined as triangular fuzzy number and α-cut of number of events is derived as follows:
The parameters k 1 ,k 2 also be defined as triangular fuzzy number k
k2 (α)={ 𝑘 2𝑎 + (𝑘 2𝑏 -𝑘 2𝑎 )𝛼, 𝑘 2𝑐 + (𝑘 2𝑏 -𝑘 2𝑐 )𝛼}
Fuzzy probability of acceptance
Acceptance Probability of two stage chain sampling plan with fuzzy parameter is given below:
Fuzzy operating characteristics curve
Operating characteristics curve plots the values of, probability of acceptance versus proportion defectives. Fuzzy operating characteristic curve is a band with upper and lower bounds. Where these bandwidth depends on the uncertainty level on the proportion defective and the number of samples. The bandwidth and the uncertainty are directly proportional, that is the bandwidth increases when uncertainty increases and decreases when the uncertainty decreases.
Example:
In chocolate manufacturing company, some products are identified as defectives after the completion of production.
Hence the parameters are considered as linguistic variables these are expressed as fuzzy numbers as follows. Let the proportion defective, sample size, k 1 and k 2 are considered as precisely unknown. And represent these parameters as triangular fuzzy numbers as follows:
𝑝 ̃ = (𝑝 𝑎 , 𝑝 𝑏 , 𝑝 𝑐 ), 𝑛 ̃ = (𝑛 𝑎 , 𝑛 𝑏 , 𝑛 𝑐 ), k1(α) =(k1a,k1b,k1c), k2(α) =(k2a,k2b,k2c)
Let consider 𝑝 ̃ = (0.0005,0.001,0.0015), 𝑛 ̃ = (19, 20, 21), k1= (2, 3, 4), k2= (6, 7, 8).
For finding the probability of acceptance we are using the equations "2, 3, 4, 5", and α cut of the above parameters are calculated as 𝑝 ̃ = (0.0005+0.0005α, 0.0015-0.0005α), 𝑛 ̃ =(19+α,21-α), k1=(2+α,4-α), k2=(6+α,8-α) respectively.
As a result the Fuzzy probability of acceptance is calculated using Fuzzy Poisson distribution and using the equations "6" are calculated.
𝑃 ̃i(α)=[f 1 (m, y) (α), f r (m, y) (α) ] ] + 0.001 ̃2 0.005 ̃ 3 ̃[1-0.005 ̃ 7 ̃-3
𝑃 ̃𝑎(f 1(m,𝑦) (α)) = (0.944,0.980,0.99)
The membership function of P i (α) is shown in the figure1 below. The following table 2 represents the value of fuzzy acceptance probability values, based on these values the operating curve is displayed below in the figure 2.
Conclusion
Mainly in production environments, it may not be easy to define the parameters fraction of nonconforming, acceptance number, or sample size as crisp values. In these cases, these parameters can be expressed by linguistic variables, which can be done with the use of Fuzzy set theory. In this paper the two stage chain sampling plan is discussed with fuzzy parameter and without fuzzy parameter. The fuzzy parameter is considered as triangular fuzzy numbers. Then the probability of acceptance of two stage chain sampling plan in both the conditions are compared and the results shows that the use of fuzzy parameter in sampling plan gives upper and lower bounds in probability of acceptance.
Figures and tables from the paper
| P | Pa(p) L | Pa(p) U | Pa(p) (without fuzzy) | P | Pa(p) L | Pa(p) U | Pa(p) (without fuzzy) |
|---|---|---|---|---|---|---|---|
| (0.0005,0.0015) | 0.9774 | 0.9999 | 0.99771 | (0.485,0.495) | 3E-05 | 1E-04 | 5.5E-05 |
| (0.002,0.003) | 0.9664 | 0.9979 | 0.98788 | (0.5,0.51) | 2E-05 | 7E-05 | 4.1E-05 |
| (0.0035,0.0045) | 0.9497 | 0.9963 | 0.97314 | (0.515,0.525) | 2E-05 | 6E-05 | 3E-05 |
| (0.005,0.015) | 0.7576 | 0.8754 | 0.89217 | (0.53,0.54) | 1E-05 | 4E-05 | 2.3E-05 |
| (0.02,0.03) | 0.5534 | 0.7908 | 0.66622 | (0.545,0.555) | 9E-06 | 3E-05 | 1.7E-05 |
| (0.035,0.045) | 0.3958 | 0.6008 | 0.48027 | 0.56,0.57) | 6E-06 | 2E-05 | 1.2E-05 |
| (0.05,0.06) | 0.2857 | 0.4437 | 0.34612 | (0.575,0.585) | 5E-06 | 2E-05 | 9.2E-06 |
| (0.065,0.075) | 0.2075 | 0.3239 | 0.25174 | (0.59,0.6) | 3E-06 | 1E-05 | 6.8E-06 |
| (0.08,0.09) | 0.1512 | 0.2365 | 0.18457 | (0.605,0.615) | 2E-06 | 1E-05 | 5E-06 |
| (0.095,0.105) | 0.1103 | 0.1736 | 0.13601 | (0.62,0.63) | 2E-06 | 8E-06 | 3.7E-06 |
| (0.11,0.12) | 0.0805 | 0.1282 | 0.10049 | (0.635,0.645) | 1E-06 | 6E-06 | 2.8E-06 |
| (0.125,0.135) | 0.0587 | 0.0952 | 0.07435 | (0.65,0.66) | 1E-06 | 4E-06 | 2E-06 |
| (0.14,0.15) | 0.0429 | 0.071 | 0.05505 | (0.665,0.675) | 7E-07 | 3E-06 | 1.5E-06 |
| (0.155,0.165) | 0.0313 | 0.0531 | 0.04077 | (0.68,0.69) | 5E-07 | 2E-06 | 1.1E-06 |
| (0.17,0.18) | 0.0228 | 0.0398 | 0.0302 | (0.695,0.705) | 4E-07 | 2E-06 | 8.3E-07 |
| (0.185,0.195) | 0.0167 | 0.0299 | 0.02237 | (0.71,0.72) | 3E-07 | 1E-06 | 6.2E-07 |
| (0.2,0.21) | 0.0122 | 0.0224 | 0.01657 | (0.725,0.735) | 2E-07 | 1E-06 | 4.6E-07 |
| (0.215,0.225) | 0.0089 | 0.0168 | 0.01228 | (0.74,0.75) | 1E-07 | 8E-07 | 3.4E-07 |
| (0.23,0.24) | 0.0065 | 0.0127 | 0.0091 | (0.755,0.765) | 1E-07 | 6E-07 | 2.5E-07 |
| (0.245,0.255) | 0.0047 | 0.0095 | 0.00674 | (0.77,0.78) | 8E-08 | 4E-07 | 1.9E-07 |
| (0.26,0.27) | 0.0034 | 0.0072 | 0.00499 | (0.785,0.795) | 6E-08 | 3E-07 | 1.4E-07 |
| (0.275,0.285) | 0.0025 | 0.0054 | 0.0037 | (0.8,0.81) | 4E-08 | 3E-07 | 1E-07 |
| (0.29,0.3) | 0.0018 | 0.004 | 0.00274 | (0.815,0.825) | 3E-08 | 2E-07 | 7.5E-08 |
| (0.305,0.315) | 0.0013 | 0.003 | 0.00203 | (0.83,0.84) | 2E-08 | 1E-07 | 5.6E-08 |
| (0.32,0.33) | 0.001 | 0.0023 | 0.0015 | (0.845,0.855) | 2E-08 | 1E-07 | 4.1E-08 |
| (0.335,0.345) | 0.0007 | 0.0017 | 0.00111 | (0.86,0.87) | 1E-08 | 8E-08 | 3.1E-08 |
| (0.35,0.36) | 0.0005 | 0.0013 | 0.00083 | (0.875,0.885) | 8E-09 | 6E-08 | 2.3E-08 |
| (0.365,0.375) | 0.0004 | 0.001 | 0.00061 | (0.89,0.9) | 6E-09 | 5E-08 | 1.7E-08 |
| (0.38,0.39) | 0.0003 | 0.0007 | 0.00045 | (0.905,0.915) | 5E-09 | 3E-08 | 1.2E-08 |
| (0.395,0.405) | 0.0002 | 0.0006 | 0.00034 | (0.92,0.93) | 3E-09 | 3E-08 | 9.2E-09 |
| (0.41,0.42) | 0.0001 | 0.0004 | 0.00025 | (0.935,0.945) | 2E-09 | 2E-08 | 6.8E-09 |
| (0.425,0.435) | 0.0001 | 0.0003 | 0.00018 | (0.95,0.96) | 2E-09 | 1E-08 | 5.1E-09 |
| (0.44,0.45) | 8E-05 | 0.0002 | 0.00014 | (0.965,0.975) | 1E-09 | 1E-08 | 3.8E-09 |
| (0.455,0.465) | 6E-05 | 0.0002 | 0.0001 | (0.98,0.99) | 9E-10 | 8E-09 | 2.8E-09 |
| (0.47,0.48) | 4E-05 | 0.0001 | 7.5E-05 |
Table text extracted from the original PDF; superscript letters are shown inline. The original table image is below.
View original table image
References
7 in the original paper- Ohta H, Ichihashi H. Determination of single sampling attribute plans based on membership function. Int. J of Production Research. 1998;26(9):1477-1485.
- Kanagawa H Ohta. A design for single sampling attribute plan based on fuzzy sets theory, Fuzzy Sets and Systems. 1990;37(2):173-181.
- Tamaki F, Kanagawa A, Ohta H. A fuzzy design of sampling inspection plans by attributes. Japanese Journal of Fuzzy Theory and Systems. 1991;3(4):315-327.
- Jamkhaneh, Ezzatallah Baloui, Sadeghpour-Gildeh Bahram, Gholamhossein Yari. Acceptance single sampling plan with fuzzy parameter with the using of Poisson distribution. World Academy of Science, Engineering and Technology. 2009;49:1017-1021.
- Jamkhaneh Baloui E, Sadeghpour-Gildeh Bahram, Gholamhossien Yari. Important criteria of rectifying inspection for single sampling plan with fuzzy parameter. Int. J Contemp. Math. Sci. 2009;4:1791-1801.
- Raju C, Narasimha Murthy MN. Two-stage chain sampling plans chsp-(0, 2) and chsp-(l, 2)-part 1. Communications in Statistics-Simulation and Computation. 1996;25(2):557-572.
- Jamkhaneh Ezzatallah Baloui, Bahram Sadeghpour Gildeh. Chain sampling plan using fuzzy probability theory. Journal of Applied Sciences. 2011;11(24):3830-3838.
Cited by 1
From OpenAlex, OpenCitations and reference lists read by Scinovex
- Fuzzy Logic Approach in Acceptance Sampling Plans and Systems – A Review ↗
G. Uma, Ramya S.R · International Journal of Research Publication and Reviews · 2023
Acceptance sampling plan plays a crucial role in quality control as they provide a statistical framework for judging the quality of a product or process based on a sample inspection.Traditional acceptance sampling plans rely on crisp decision rules, where items/products are categorized as either "acceptable" or "nonacceptable" based on predetermined thresholds.However, these plans may not adequately capture the inherent uncertainty…
❝ 0PDF