
Research article · 2022 · Full text
International Journal of Statistics and Applied MathematicsA negative binomial regression analysis for COVID-19 death cases in Senegal
Volume 7(3) · Pages 06–12 · DOI: 10.22271/maths.2022.v7.i3a.817 ↗
Research areasCOVID-19 epidemiological studies
Abstract
Author-writtenWe consider the negative binomial regression model (NBRM) to identify explanatory factors of the number of daily COVID-19 death cases in Senegal. The data are obtained from daily cases of COVID-19 following press releases from the Ministry of Health and Social Action (MSAS) during the period from February 24, 2021 to March 3, 2022. The extracted data were analysed using descriptive statistics and NBRM. The results of analysis revealed that the number of severe cases has a significant positive impact on the number of death cases of COVID-19 in Senegal. Furthermore, the number of vaccinated persons has a small and negative effect on the number of deaths.
Summary
Source-checkedPlain-language reading of the full paper, prepared with AI and checked against the text. Each point links to the authors' own words.
Why it matters
- COVID-19 is a highly contagious and deadly disease that has caused over 6 million deaths globally according to the World Health Organization. View evidence ↗
- In Senegal, as of March 30, 2022, there were 85,880 positive cases and 1,964 deaths. View evidence ↗
- Despite government response systems and vaccination campaigns, Senegal has experienced irregular peaks in positive cases and deaths. View evidence ↗
The question
- The study aims to identify the factors that influence the number of COVID-19 death cases in Senegal. View evidence ↗
What they did
- Data were collected from daily press releases by the Senegalese Ministry of Health and Social Action between February 24, 2021, and March 3, 2022. View evidence ↗
- The dataset consists of 337 observations across seven variables, including deaths, tested cases, positive cases, community cases, vaccinated persons, severe cases, and cured cases. View evidence ↗
- The researchers used a Negative Binomial Regression Model (NBRM) because standard Poisson models often fail to handle overdispersion in biomedical count data. View evidence ↗
What they found
- A Cameron-Trivedi dispersion test confirmed the presence of overdispersion in the data (p = 0.00000173), justifying the use of the negative binomial model over the Poisson model. View evidence ↗
- The model estimated that a one-unit increase in severe cases increases deaths by 0.9983 units, while a one-unit increase in vaccinated persons decreases deaths by 0.0668 units. View evidence ↗
- The final model demonstrated good predictive capacity, with a Pseudo R2 of 0.67 and a mean absolute percentage error of 1.08%. View evidence ↗
What it means
- The authors recommend that public health policies focus on early management of positive cases to prevent them from becoming severe and encouraging vaccination to limit viral spread. View evidence ↗
- The study did not account for socio-demographic or environmental variables, such as patient age, co-morbidities, temperature, or healthcare capacity. View evidence ↗
Visual summary
1 visualsIllustrations explain the paper; charts are replotted from the paper's own table values.
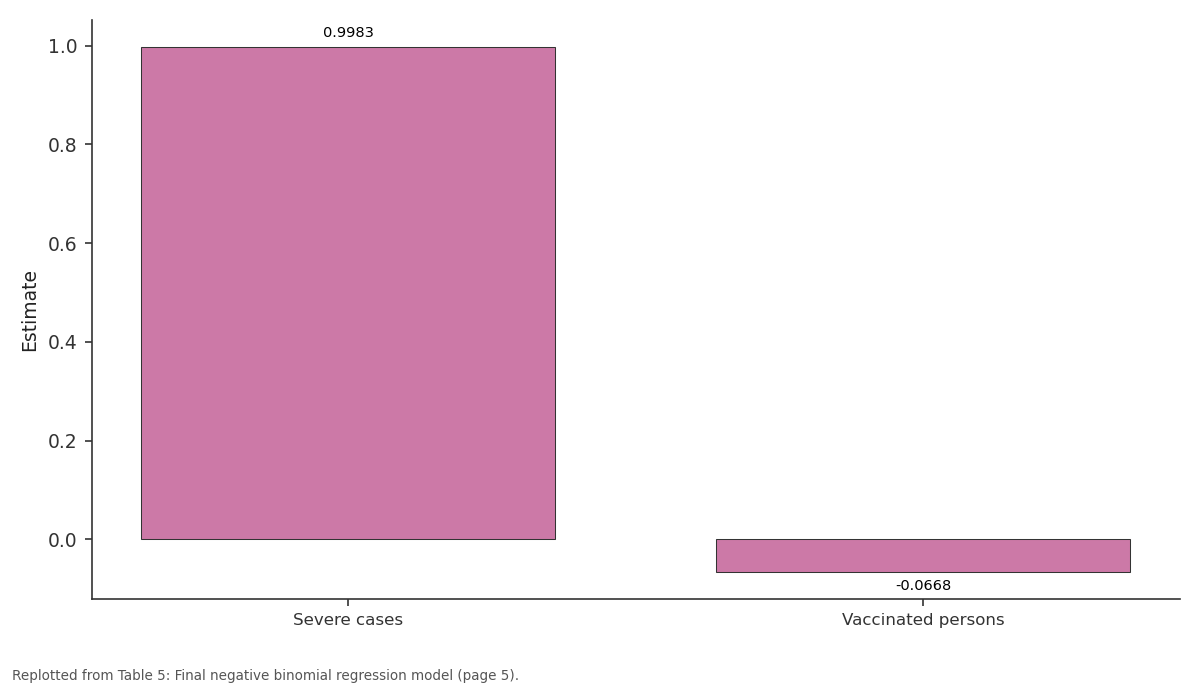
Estimate: Severe cases vs Vaccinated persons
Replotted from Table 5 (page 5) of the original paper. Every bar is the paper's own table value.
View source evidence ↗Figures & tables
From the original paper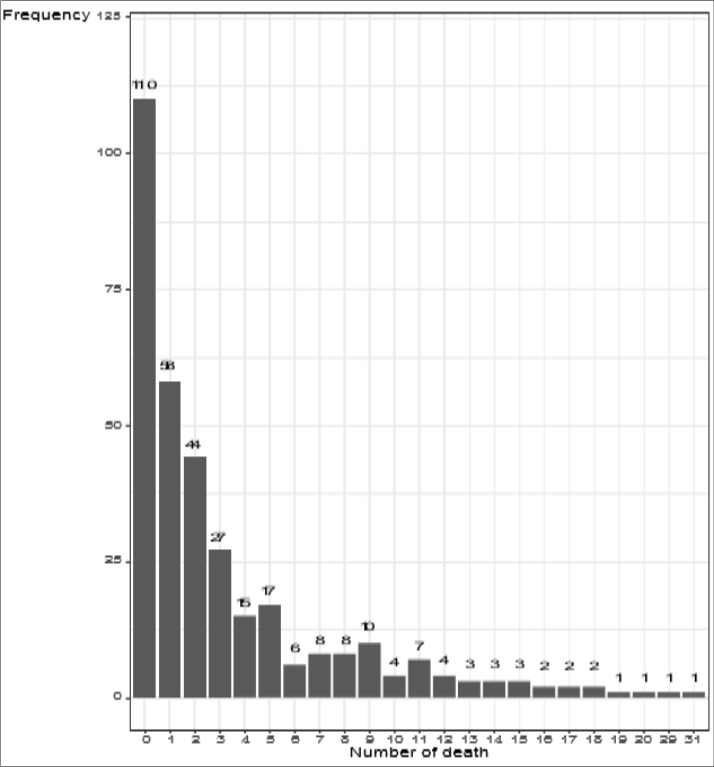 Figure 1
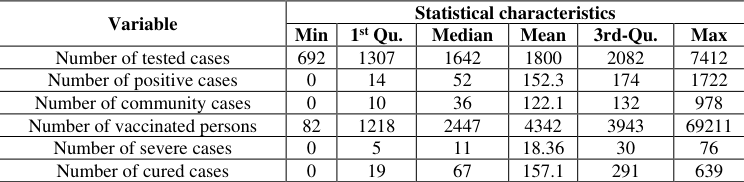 Table 1
 Table 2
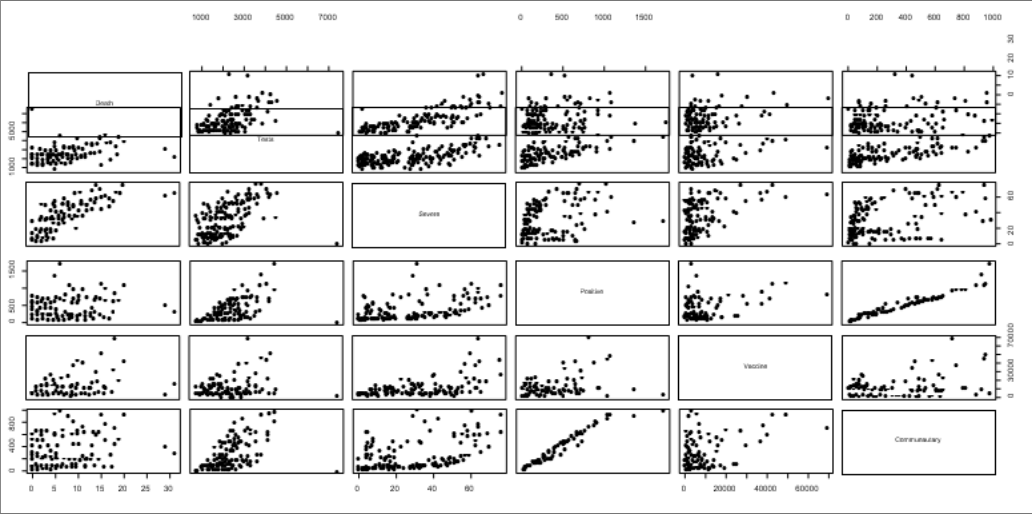 Figure 2
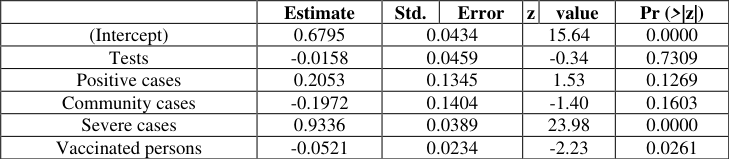 Table 3
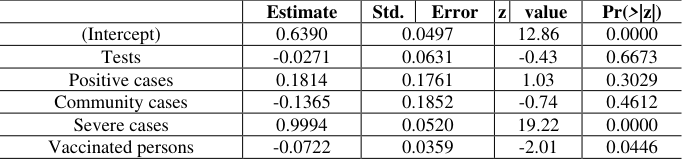 Table 4
 Table 5
 Table 6
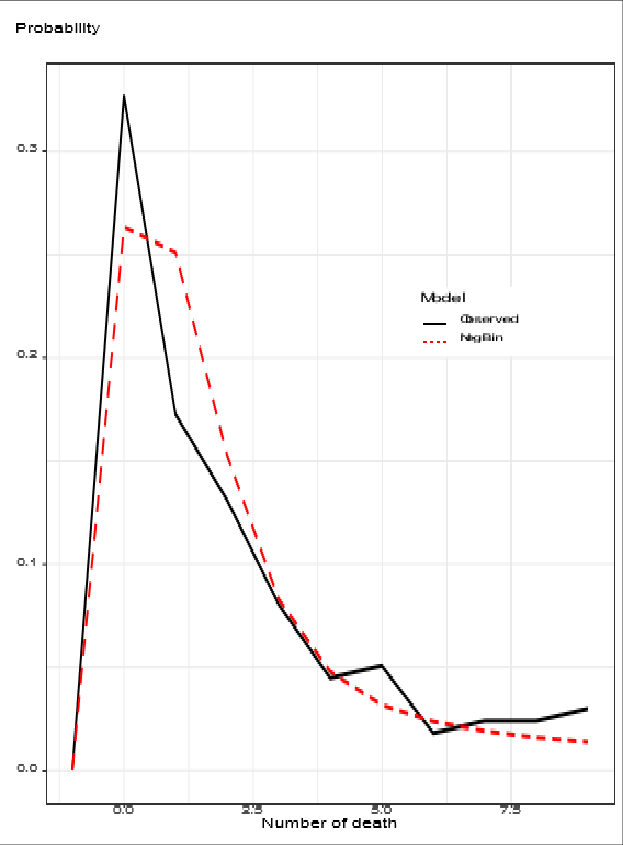 Figure 3
Introduction
The novel corona virus disease (COVID-19) is certainly the biggest health challenge that mankind has ever faced since the Spanish flu outbreak in 1918. It starts in December 2019 in Wuhan in the Hubei province of China (Wu et al. (2020)) [14] . COVID-19 is very contagious and has rapidly spread all around the world. Its transmission from person to person is very quick, because it is very difficult to avoid the contaminations sources such as: droplets, infected surfaces, interaction with people, and so on. COVID-19 is also a deadly disease; a considerable number of deaths (more than 6 millions) has been recorded by World Health Organization's statistics. In Senegal, the number of COVID-19 deaths reached 1964 and the total number of positive cases was 85,880 as of March 30, 2022. The first COVID-19 case in Senegal was reported on March 2, 2020 and the Senegalese government has built a response system following whose recommendations, with the aim of combating the disease. Also a vaccination campaign was launched on February 24, 2021, and is still taking place throughout the whole country. Despite all these government efforts, COVID-19 appears to be progressing with irregular peaks in the number of positives and death cases. In this paper we are interested in the factors influencing the number COVID-19 death cases in Senegal. There is a quick and abundant literature about modeling the evolution of COVID-19 positive cases and deaths. Daniyal et al. (2020) [4] proposed three regression models (linear, logarithmic and quadratic) to predict the trend of COVID-19 deaths cases in Pakistan. They found that the quadratic model was more suitable than the two others for the studied data. Barcellos et al. (2021) [1] utilized a data mining approach to predict the evolution of COVID-19 positive cases in three metropolises in Brazilia. They also identified the environmental variables that are likely to be correlated with the COVID-19 confirmed cases and deaths. Khan et al. (2021) [11] developped a forecasting model in six countries: Pakistan, India, Afghanistan, Iran, Italy and China with data observed at the earlier of the pandemic; and predicted the number of COVID-19 related cases and deaths by using polynomial regression. Diop et al. (2021) [7] used an ARIMA model to study the evolution of COVID-19 positive cases in Senegal, and make shortterm predictions for the number of positive cases, from daily data provided by the Senegalese Ministry of Health (MSAS). Motallebi et al. (2022) [13] examined the association between face-covering mandates and the COVID-19 mortality decline accross 44 countries in 2 continents, and found that the COVID-19 death rate is lower in countries with face-mask mandates than in countries without mandates. Lounis et al. (2021) [12] made a comparison of four models: Gompertz, Logistic, Bertalanffy and inverse artificial neural network (ANNi), with the aim of predicting the number of COVID-19 cases, deaths and recoveries in Algeria. For predicting death cases, they showed that the Gompertz model obtained the best precision with a minimum error of 1.14%. Diagne et al. (2021) [6] studied the impact of vaccination and treatment on the COVID-19 evolution and concluded that, despite the negative impact of both vaccination and treatment on the disease, other non-therapeutic measures should continue to be observed. Dengle and Nathan (2020) [5] studied the impact of the increase in COVID-19 confirmed cases on the number of deaths and its implications on food security in North Eastern of Nigeria. In this paper we use the Negative binomial regression model to analyse factors influencing the COVID-19 related deaths in Senegal in the context of vaccination. The data are extracted from the daily COVID-19 statistics released by the Senegalese Ministry of health and social Action (MSAS), during the period from February 24, 2021 to March 3, 2022. The paper is organized as follows. The proposed methodology is described in Section 2. More precisely, after describing the data set, we present the negative binomial regression model and the estimation procedure along with some key statistics for the model's goodness-of-fit. Section 3 presents and discusses the results. Finally, Section 4 concludes the paper.
Materials and Methods
Modeling count data is a common task in biomedical studies. The classical Poisson regression model is often of limited use in these disciplines because empirical count data sets typically exhibit overdispersion and/or an excess of number of zeros (see Cameron and Trivedi (1998) [1] for more details). The former issue can be addressed by extending the Poisson regression model in various directions. A more formal way is to use a Binomial negative regression model.
Data description
The database contains 337 observations and 7 variables defined as: Number of death cases (Y), Number of tested cases (X 1 ), Number of positive cases (X 2 ), Number of community cases (X 3 ), Number of vaccinated persons (X 4 ), Number of severe cases (X 5 ) and Number of cured cases (𝑋 6 ). Figure 1 shows the histogram of the dependent variable Y Number of daily COVID-19 death case. Clearly, the data are not in the form of a bell curve like a normal distribution. Figure 2 shows the linearity between the variables. We see a positive correlation between the number of deaths and the number of severe cases and a weak negative correlation between the number of vaccinated people and the number of deaths. Tables 1 and2 show respectively the descriptive statistics of the variables and the proportions in relation to the total number of performed tests. We note that the number of death cases is very low compared to the other variables. Thus we use the centered and reduced variables in the model to eliminate the problems of margin and variability.
The Negative binomial regression model
Negative binomial regression is a generalization of Poisson regression which loosens the restrictive assumption that the variance is equal to the mean made by the Poisson model. Let (𝑌 1 , 𝑋 1𝑗 ), … , (𝑌 𝑛 , 𝑋 𝑛𝑗 ) for 𝑗 = 1, … , 𝑝, be independent and identically distributed copies of the random vector (𝑌, 𝑋) defined on the probability space (Ω, Α, Ρ). In negative binomial regression, the mean 𝜇 = Ε(𝑌|𝑋) of the response variable 𝑌 is generally determined by the exposure time t and a set of p repressor variables.
Using the following equation
Remark: Note that the conditional mean µ i in the case of the negative binomial distribution can be written asμ i = υt i , where the parameter υ is the mean incidence rate of Y per unit of exposure and t i represent the exposure for a particular observationi. Exposure may be time, space, distance, area, volume, or population size. When no exposure given, it is assumed to be one. The parameter υ may be interpreted as the risk of a new occurrence of the event during a specified exposure periodt.
The regression coefficients 𝛽 0 , 𝛽 1 , … , 𝛽 𝑝 are unknown parameters that have to be estimated from a dataset. Using this notation, the negative binomial regression model for an observation 𝑖 is written as
Where 𝛼 represents the number of failures before the (1 𝛼 ⁄ ) 𝑡ℎ success (Hilbe (2011) [10] . The regression coefficients 𝛽 = (𝛽 0 , 𝛽 1 , … , 𝛽 𝑝 ) and 𝛼 are estimated using the method of maximum likelihood. Cameron and Trivedi (1998) [1] gives the logarithm of the likelihood function for the unknown (𝑝 + 1)-dimensional parameter 𝜃 = (𝛽, 𝛼) from the independent sample (𝑦 1 , 𝑥 1 ), … , (𝑦 𝑛 , 𝑥 𝑛 ) is as follows:
We define the maximum likelihood estimator 𝜃 ̂𝑛 of 𝜃 as the solution of the (𝑝 + 1)-dimensional score equation
In general, however, we will use the iteratively-reweighted least squares (IRLS) algorithm (see (Hilbe (2011) [10] ) to solve equation ( 4). Cameron and Trivedi (1998) [1] gives the asymptotic distribution of the maximum likelihood estimates as follows: (𝜃 ̂𝑛 -𝜃) ↝ 𝑁(0, Σ), 𝑎𝑠 𝑛 → +∞, where the elements of the estimated variance-covariance matrix Σ ̂ of Σ given as follows:
Goodness-of-fit criteria Deviance: we have
For large samples the distribution of the deviance is approximately a chi-squared with np degrees of freedom, where n is the number of observations and p the number of parameters. Thus, the deviance can be used directly to test the goodness of fit of the model. The model fits well the data if the ratio between the deviance and its number of degrees of freedom is close to 1. In this case, we also say that the model handles well the over dispersion problem.
Pearson Residuals:
The Pearson residual corrects for the unequal variance in the residuals by dividing by the standard deviation of y. The formula for the Pearson residual is
In large samples the distribution of Pearson's statistic is also approximately chi-squared with 𝑛 -𝑝 degrees of freedom. The model fits well the data (Hypothesis 𝐻 0 ) at the risk threshold 𝛼 ∈]0;
Results and Discussion
In this section, we deal with the data set of daily reported COVID-19 cases in Senegal during the period from February 24, 2021 to February 3, 2022 (data from the Ministry of Health and Social Action of Senegal). In this study, we aim to establish a relationship between the number of daily COVID-19 death cases and the vector of explanatory variables (𝑋 1 , … , 𝑋 6 ). We first run the Poisson regression model:
Note that in model ( 6), the exposure time 𝑡 𝑖 is the same for all patients and is assumed to be 1(log (𝑡 𝑖 )=0, for i=1,…,n). The results of model ( 8) are presented in the Table 3. We perform the Cameron-Trivedi dispersion test (Cameron and Trivedi (1998)) [5,1] for the model (8) to study the overdispersion property. The null hypothesis of this test is the absence of overdispersion. The computed p-value of this test is equal to 0.00000173, which leads to the presence of overdispersion at 5% significance level. We thus propose to use the negative binomial regression model to overcome this problem of overdispersion. Now, we run the following negative binomial regression model:
| — | Estimate | Std. | Error | z | value | Pr (>|z|) |
|---|---|---|---|---|---|---|
| (Intercept) | 0.6795 | 0.0434 | 15.64 | 0.0000 | ||
| Tests | -0.0158 | 0.0459 | -0.34 | 0.7309 | ||
| Positive cases | 0.2053 | 0.1345 | 1.53 | 0.1269 | ||
| Community cases | -0.1972 | 0.1404 | -1.40 | 0.1603 | ||
| Severe cases | 0.9336 | 0.0389 | 23.98 | 0.0000 | ||
| Vaccinated persons | -0.0521 | 0.0234 | -2.23 | 0.0261 |
Table text extracted from the original PDF; superscript letters are shown inline. The original table image is below.
View original table image
Table 4 shows the first results obtained from the negative binomial model (7). Then, we use the backward regression to select the best model. Finally we obtain the following model presented in Table 5. The adjusted equation of the model is given as follows log(𝜇) = 0.6431 + 0.9983 × 𝑆𝑒𝑣𝑒𝑟𝑒. 𝐶𝑎𝑠𝑒𝑠 -0.0668 × 𝑉𝑎𝑐𝑐𝑖𝑛𝑎𝑡𝑒𝑑. 𝑃𝑒𝑟𝑠𝑜𝑛𝑠
| — | Estimate | Std. | Error | z | value | Pr(>|z|) |
|---|---|---|---|---|---|---|
| (Intercept) | 0.6431 | 0.0493 | 13.05 | 0.0000 | ||
| Severe cases | 0.9983 | 0.0410 | 24.34 | 0.0000 | ||
| Vaccinated persons | -0.0668 | 0.0326 | -2.05 | 0.0402 |
Table text extracted from the original PDF; superscript letters are shown inline. The original table image is below.
View original table image
| — | Estimate | Std. | Error | z | value | Pr(>|z|) |
|---|---|---|---|---|---|---|
| (Intercept) | 0.6390 | 0.0497 | 12.86 | 0.0000 | ||
| Tests | -0.0271 | 0.0631 | -0.43 | 0.6673 | ||
| Positive cases | 0.1814 | 0.1761 | 1.03 | 0.3029 | ||
| Community cases | -0.1365 | 0.1852 | -0.74 | 0.4612 | ||
| Severe cases | 0.9994 | 0.0520 | 19.22 | 0.0000 | ||
| Vaccinated persons | -0.0722 | 0.0359 | -2.01 | 0.0446 |
Table text extracted from the original PDF; superscript letters are shown inline. The original table image is below.
View original table image
We can see from the results that the ratio of the residual deviance (377.02) to its degree of freedom (334) is almost 1.128, which suggests that the negative binomial model has taken account of the overdispersion problem. The p-value of the Pearson goodnessof-fit test on the residuals is equal to 0.6620. This means that the final model is well adapted to the data. The Pseudo R 2 of Cragg and Uhler (see Cragg and Uhler (1970)) [3] is equal to 0.67 and the mean absolute percentage error is equal to 1.08%. These values indicate a good predictive capacity of the model in Table 5.
Figure 3 shows that the final negative binomial regression model almost overlap with the observed data, which is a good performance. Table 6 shows the odd-ratios of the variables "Number of severe cases" and "Number of vaccinated persons" that have a significant impact on the number of deaths due to COVID-19. We see that the number of severe cases is a risk factor because it has a positive impact (OR = 2.71 with a confidence interval of [2.50-2.94]) on the number of death cases. Then a one unit change in the number of severe cases increases the number of death cases by 0.9983 units. In contrast, the number of vaccinated persons has a negative impact on the number of death cases, and is therefore a protective factor (OR = 0.94 with a confidence interval of [0.88 -1.0]). Then a one unit change in the number of vaccinated persons decreases the number of death cases by 0.0668 units.
| Variable | OR | [2.5% − 97.5%] | — | Pr (>|z|) |
|---|---|---|---|---|
| (Intercept) | 1.90 | [1.73 - | 2.10] | 0.0000 |
| Severe cases | 2.71 | [2.50 - | 2.94] | 0.0000 |
| Vaccinated persons | 0.94 | [0.88 | - 1.0] | 0.0402 |
Table text extracted from the original PDF; superscript letters are shown inline. The original table image is below.
View original table image
Conclusion
In this work, we used a negative binomial regression model to study the impact of certain factors on the number of daily deaths from COVID-19 in Senegal. The statistical analysis revealed that the number of severe cases of COVID-19 and the number of vaccinated people have a significant impact on the number of deaths. Increasing the number of severe cases increases the number of death cases and increasing the number of vaccinated persons decreases the number of deaths. However, the number of severe cases is more significant than the number of vaccinated people. Therefore, public health policy makers need to support health workers to manage positive cases earlier so that their illnesses do not progress to severe cases, and to encourage people to go for vaccination to limit the spread of the virus. However, this study do not take into account the environmental and socio-demographic variables such as temperature, age and co-morbidity of patients, health care capacity.
Based on the goodness of fit of the model, we may envisage in the future to study the predictive quality of the model. Decision-makers could thus use this model to better understand the number of deaths from COVID-19 in Senegal.
Figures and tables from the paper
| Variable | Statistical characteristics | — | — | — | — | — |
|---|---|---|---|---|---|---|
| Min | 1st Qu. | Median | Mean | 3rd-Qu. | Max | |
| Number of tested cases | 692 | 1307 | 1642 | 1800 | 2082 | 7412 |
| Number of positive cases | 0 | 14 | 52 | 152.3 | 174 | 1722 |
| Number of community cases | 0 | 10 | 36 | 122.1 | 132 | 978 |
| Number of vaccinated persons | 82 | 1218 | 2447 | 4342 | 3943 | 69211 |
| Number of severe cases | 0 | 5 | 11 | 18.36 | 30 | 76 |
| Number of cured cases | 0 | 19 | 67 | 157.1 | 291 | 639 |
Table text extracted from the original PDF; superscript letters are shown inline. The original table image is below.
View original table image
| Variable | Total Proportion | (%) |
|---|---|---|
| Number of positive cases | 51312 | 84.57 |
| Number of community cases | 41149 | 67.82 |
| Number of severe cases | 6189 | 10.20 |
| Number of cured cases | 52929 | 87.23 |
| Number of death cases | 1110 | 1.82 |
Table text extracted from the original PDF; superscript letters are shown inline. The original table image is below.
View original table image
References
10 in the original paper- Barcellos DD, Fernandes GMK, de Souza FT. Data based model for predicting COVID-19 morbidity and mortality in metropolis. Sci Rep. 2021,29;11(1):24491. DOI: 10.1038/s41598-021-04029-6.
- Cragg SG, Uhler R. The demand for automobiles. Canadian Journal of Economics. 1970 Aug 1;3(3):386406.
- Daniyal M, Ogundokun RO, Abid K, Khan MD, Ogundokun OE. Predictive modeling of COVID-19 death cases in Pakistan. Infect Dis Model. 2020;5:897-904. DOI: 10.1016/j.idm.2020.10.011
- Diagne ML, Rwezaura H, Tchoumi SY, Tchuenche JM. A Mathematical Model of COVID-19 with Vaccination and Treatment. Computational and Mathematical Methods in Medicine. 2021;2021:16p. Article ID 1250129. https://doi.org/10.1155/2021/1250129
- Diop A, Ndao A, Seck CT, Faye I, Niang MA. Shortterm prediction model for daily COVID-19 reported positive cases in Senegal. Afr. J Appl. Stat. 2021;8(1):111-1126. DOI: 10.16929/ajas/2021.1111.260.
- Giroh YD, Nachandiya N. A Poisson Regression Analysis of COVID-19 Pandemic: Implication on Food Security in North Eastern Nigeria; p 2020. http://dx.doi.org/10.2139/ssrn.3690886.
- Khan N, Arshad A, Azam M, Al-marshadi AA, Aslam M. Modeling and forecasting the total number of cases and deaths due to pandemic. Journal of Med. 2022 Apr;94(4):1592-605. Vir. https://doi.org/10.1002/jmv.27506.
- Lounis M, Torrealba-Rodriguez O, Conde-Gutierrez RA. Predictive models for COVID-19 cases, deaths and recoveries in Algeria. Results in Physics. 2021;30:104845. https://doi.org/10.1016/j.rinp.2021.104845.
- Motallebi S, Cheung RCY, Mohit B, Shahabi S, Tabriz AA, Moattari S. Modeling COVID-19 Mortality Across 44 Countries: Face Covering May Reduce Deaths. Am J Prev Med. 2022;62(4):483-491. doi:10.1016/j.amepre.2021.09.019.
- Wu YC, Chen CS, Chan YJ. The outbreak of COVID-19: An overview. Journal of the Chinese Medical Association. 2020;83(3):217-220.
Cited by 1
From OpenAlex, OpenCitations and reference lists read by Scinovex
- New robust estimators for the fixed effects negative binomial model: a simulation and real-world applications to European panel data ↗
Mohamed R. Abonazel, Ehab Ebrahim Mohamed Ebrahim, Elsayed G. Ahmed, Amera M. El-Masry · Frontiers in Applied Mathematics and Statistics · 2025
This study introduces a more flexible approach by employing the fixed effects negative binomial model to address challenges associated with outliers and dispersion. Unlike previous studies that focused on the robust estimation of the Poisson model with fixed effects, which assumes equidispersion and cannot handle dispersion in count panel data, we develop novel estimators specifically designed for the fixed effects…
❝ 2PDF