
Research article · 2022 · Full text
International Journal of Statistics and Applied MathematicsPredictive accuracy of time series model using COVID-19 cases in Eastern Visayas
Volume 7(3) · Pages 13–16 · DOI: 10.22271/maths.2022.v7.i3a.818 ↗
Research areasData Mining and Machine Learning ApplicationsCOVID-19 epidemiological studiesArtificial Intelligence in Healthcare
Abstract
Author-writtenSARS-Cov-2 is a novel coronavirus strain that has not previously been associated with human infection. COVID-19 is the name given to the disease caused by SARS-Cov-2. The World Health Organization declared it a Public Health Emergency of International Concern on January 30, 2020, and was later declared a pandemic on March 11, 2020. In this paper, we used MAD, MAPE, and RMSE to measure the predictive accuracy of the forecasting models for the COVID-19 cases of the provinces/cities in the region, namely, Biliran, Eastern Samar, Northern Samar, Samar, Leyte, Southern Leyte, Tacloban City, and Ormoc City. The data for this study comes from an official COVID-19 cases dataset provided by the Regional Epidemiology & Surveillance Unit of Department of Health (DOH) – Eastern Visayas Center for Health and Development from March 1, 2020 to October 30, 2021. The dataset contains confirmed cases on a weekly basis for 87 weeks (79 weeks were used for forecasting and 8 weeks were used to determine the predictive accuracy). From the results, it has been found out that ARIMA models can be highly reliable in forecasting the cases in Eastern Visayas.
Summary
Source-checkedPlain-language reading of the full paper, prepared with AI and checked against the text. Each point links to the authors' own words.
Why it matters
- COVID-19 is a disease caused by the novel coronavirus strain SARS-CoV-2. View evidence ↗
- The Eastern Visayas region of the Philippines was significantly impacted by the virus, recording 42,287 cumulative cases by September 4, 2021. View evidence ↗
The question
- The study aimed to measure the predictive accuracy of forecasting models for COVID-19 cases across various provinces and cities in Eastern Visayas using MAD, MAPE, and RMSE. View evidence ↗
What they did
- The researchers used official weekly case data from the DOH-Eastern Visayas Center for Health and Development spanning March 1, 2020, to October 30, 2021. View evidence ↗
- Out of 87 weeks of data, 79 weeks were used to build the forecasting models and 8 weeks were used to evaluate their predictive accuracy. View evidence ↗
- ARIMA models were employed to forecast COVID-19 cases for the eight weeks following Morbidity Week 35 of 2021. View evidence ↗
- Stationarity tests showed that Southern Leyte was the only area not requiring differencing, while the other seven provinces/cities required first-order differencing. View evidence ↗
What they found
- Based on Mean Absolute Error (MAE), Eastern Samar had the best performing model with an average distance of 15.38 between actual and forecasted values. View evidence ↗
- Leyte's model showed the lowest predictive accuracy for both MAE and RMSE, with an RMSE of 416.66. View evidence ↗
- All models were considered highly accurate according to the Mean Absolute Percentage Error (MAPE) because all values were below 10%. View evidence ↗
- Southern Leyte achieved the best performance in terms of MAPE, with a value of 0.33%. View evidence ↗
- Ormoc City had the lowest predictive accuracy for MAPE, with a value of 4.9%. View evidence ↗
What it means
- The authors conclude that ARIMA models are highly reliable for forecasting COVID-19 cases in the Eastern Visayas region. View evidence ↗
- The authors recommend that government officials and healthcare experts use ARIMA forecasting to gain insights and take necessary actions to contain the spread of the virus. View evidence ↗
Visual summary
1 visualsIllustrations explain the paper; they do not show study data.

ARIMA Forecasting Workflow
AI-generated conceptual illustration (COVID-19 virus particles and a digital timeline). It explains the idea and does not show study data.
View source evidence ↗Figures & tables
From the original paper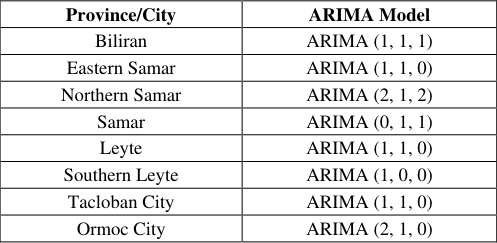 Table 1
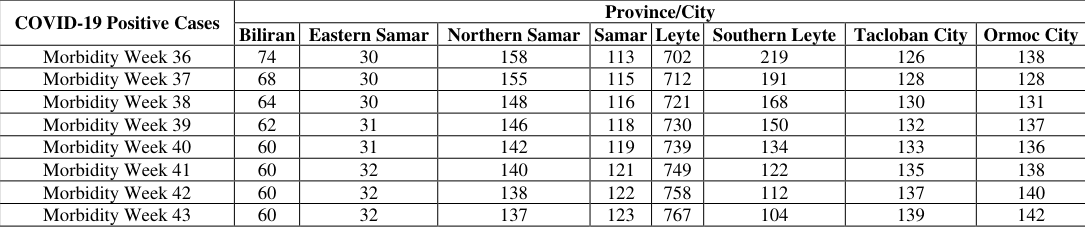 Table 2
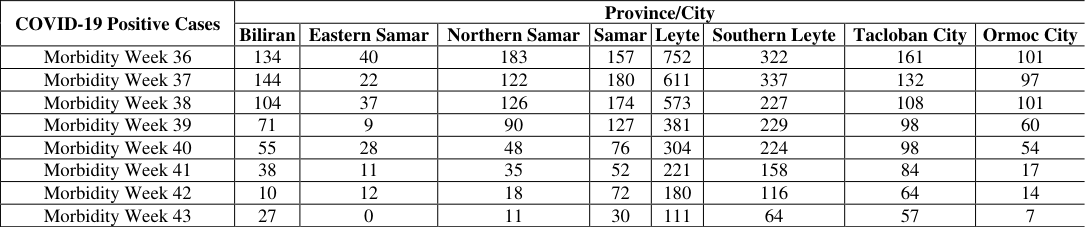 Table 3
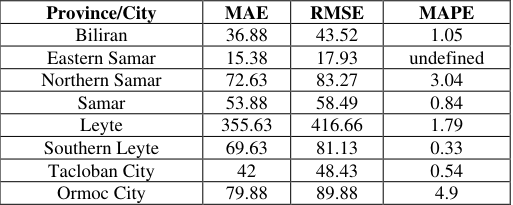 Table 4
Introduction
COVID-19 is a coronavirus infection caused by SARS-CoV-2, a novel (or newly discovered) coronavirus. Following a report of a cluster of 'viral pneumonia' cases in Wuhan, People's Republic of China, the World Health Organization first became aware of this new virus on December 31, 2019. The first case of SARS-CoV-2 infection outside of China was reported by The Ministry of Public Health in Thailand on January 13, 2020 -an imported case of lab-confirmed novel coronavirus from Wuhan. Then, on February 2, 2020, the Philippines recorded the first fatality outside of China. The patient was a close relative of the Philippines' first confirmed case 1. World Health Organization 2020a [1] . As of September 4, 2021, DOH Philippines recorded 20,741 new cases bringing the cumulative confirmed cases to 2,061,084 with 1,869,376 recoveries, and 34,062 deaths, Lewis 1982 [2] . The Eastern Visayas region of the Philippines also feel the impact of the virus. As of September 4, 2021, DOH Eastern Visayas recorded a cumulative total of 42,287 COVID-19 cases in the region. The data for this study comes from an official COVID-19 cases dataset provided by the Regional Epidemiology & Surveillance Unit of DOH-Eastern Visayas Center for Health and Development between March 1, 2020 and October 30, 2021. The cases were grouped by province/city, namely, Biliran, Eastern Samar, Northern Samar, Samar, Leyte, Southern Leyte, Tacloban City, and Ormoc City. The dataset contains confirmed cases on a weekly basis for 87 weeks (79 weeks were used for forecasting and 8 weeks were used to determine the predictive accuracy). The performance of the ARIMA models was measured according to the MAD, MAPE, and RMSE metrics Box GEP 1976 [3] .
Methodology 2.1 Study Design and Data
This study utilizes the quantitative design. The analysis is based on the official COVID-19 cases dataset provided by the Regional Epidemiology & Surveillance Unit of Department of Health (DOH) -Eastern Visayas Center for Health and Development. The data includes the weekly case count from March 1, 2020 to October 30, 2021 for the different provinces/cities in Eastern Visayas.
Study Locale
The locale of this study is the Eastern Visayas, or Region 8, administrative region of the Philippines. The region has six provinces, one highly urbanized city, and one independent city. This study was conducted using the secondary data on the COVID-19 cases of these provinces and cities, namely, Biliran, Eastern Samar, Northern Samar, Samar, Leyte, Southern Leyte, Tacloban City, and Ormoc City.
Data Gathering Procedure
The weekly COVID-19 positive cases by province/city in Eastern Visayas from March 1, 2020 to October 30, 2021 was collected from the Regional Epidemiology & Surveillance Unit of DOH -Eastern Visayas Center for Health and Development. The researchers sent two letters of request the agency. First was to collect data used in forecasting, the other was for the computation of the predictive accuracy.
Statistical Treatment
The Autoregressive Integrated Moving Average (ARIMA) Models were used to forecast the cases for the eight weeks after the Morbidity Week 35 of 2021. Mean Absolute Error (MAE), Root Mean Square Error (RMSE) and Mean Absolute Percentage Error (MAPE) was used to test the predictive accuracy of the models.
ARIMA Model
ARIMA is an abbreviation for auto-regressive, integrated, moving average. The auto-regressive element, p, represents the lingering impacts of the scores that came before it. The integrated element, d, represents patterns in the data, and the moving average element, q, represents the residual effects of preceding random shocks. This statistical model uses time series data to better understand the dataset, predict future trends, and predict future values based on past values. The researchers used ARIMA modeling since it is one of the simpler and more flexible, yet powerful method for making time series forecasts.
Mean Absolute Error (MAE)
The average distance between each data value and the mean is the mean absolute error of a set of data. MAE was employed by the researchers because it provides a general sense of the average distance between forecasts and actual values for a given dataset. MAE is useful in measuring prediction errors because it uses the same unit as the original series and does not take direction into account (i.e. positive or negative). When the model has a lower value in MAE, it has a more accurate forecasted value. The formula used is shown below:
where A tactual value F tforecasted value Tnumber of forecasts
Root Mean Square Error (RMSE)
The Root Mean Square Error (RMSE) measures the overall fit of the model. It is a metric for determining the spread of residuals' standard deviation. The RMSE gives a relatively high weight to large errors. This means that the RMSE is more useful when large errors are particularly undesirable. The RMSE values are always greater than or equal to MAE. The lesser the values for the RMSE, the better the predictive accuracy of the model. The formula is shown below:
where A tactual value F tforecasted value Tnumber of forecasts
Mean Absolute Percentage Error (MAPE)
The mean absolute percentage error (MAPE) is a measure of a forecast model's accuracy. It measures this accuracy as a percentage, and is determined as the average absolute percent error for each time period minus actual values divided by real values. This method was used to determine the accuracy of the prediction relative to the size of the actual values. It is advisable to set arbitrary forecasting performance targets of MAPE < 10% as Highly Accurate, and MAPE < 20% as Good [2] . The formula used is shown below:
where A tactual value F tforecasted value Tnumber of forecasts
Results and Discussions
To use ARIMA models in forecasting cases, the stationarity of the time series is needed. The Augmented Dickey-Fuller (ADF) Test was applied to test for stationarity. Southern Leyte was the only province that exhibited stationarity (at 5%) out of the eight provinces/cities without the need for differencing to be conducted. The other provinces/cities, namely, Biliran, Eastern Samar, Northern Samar, Samar, Leyte, Tacloban City, and Ormoc City needed a first-order differencing to obtain stationarity. After the differencing was done, these provinces/cities were observed to have stationarity at 1% significance level. Consequently, Southern Leyte will have an integrated element d equal to 0 while the rest of the provinces/cities have 1.
The corrected Akaike Information Criterion (AICc) and Bayesian Information Criterion (BIC) was used to identify the p and q terms. Several candidate models was tested. In selecting the models, the lower the value of the AICc and BIC, the better the model. In this sense, the lowest value is the best model possible based on that criterion.
ARIMA Models
Table 1 shows the time series models for the COVID-19 cases by province/city in Eastern Visayas. The table shows the summary of the ARIMA (p, d, q) models wherein p is the autoregressive (AR) element, d is the integrated (I) element, and q is the moving average (MA) element.
| Province/City | ARIMA Model |
|---|---|
| Biliran | ARIMA (1, 1, 1) |
| Eastern Samar | ARIMA (1, 1, 0) |
| Northern Samar | ARIMA (2, 1, 2) |
| Samar | ARIMA (0, 1, 1) |
| Leyte | ARIMA (1, 1, 0) |
| Southern Leyte | ARIMA (1, 0, 0) |
| Tacloban City | ARIMA (1, 1, 0) |
| Ormoc City | ARIMA (2, 1, 0) |
Table text extracted from the original PDF; superscript letters are shown inline. The original table image is below.
View original table image
Forecasted and Actual Values of the COVID-19 Cases in Eastern Visayas for Morbidity Week 36 -43 of 2021
The ARIMA models were used to forecast the weekly COVID-19 cases for their respective province/city. The forecasted values are shown in Table 2. The actual values for the COVID-19 cases of the different provinces/cities in Eastern Visayas was gathered from the Regional Epidemiology & Surveillance Unit of DOH -Eastern Visayas Center for Health and Development and is shown in Table 3. The COVID-19 cases for Biliran was forecasted to slightly decrease for the eight-week period, Eastern Samar's cases was forecasted to slightly increase, Northern Samar's cases was expected to have a gradual decrease, and the province of Samar's cases was forecasted to increase.
| COVID-19 Positive Cases | Province/City | — | — | — | — | — | — | — |
|---|---|---|---|---|---|---|---|---|
| Biliran | Eastern Samar | Northern Samar | Samar | Leyte | Southern Leyte | Tacloban City | Ormoc City | |
| Morbidity Week 36 | 134 | 40 | 183 | 157 | 752 | 322 | 161 | 101 |
| Morbidity Week 37 | 144 | 22 | 122 | 180 | 611 | 337 | 132 | 97 |
| Morbidity Week 38 | 104 | 37 | 126 | 174 | 573 | 227 | 108 | 101 |
| Morbidity Week 39 | 71 | 9 | 90 | 127 | 381 | 229 | 98 | 60 |
| Morbidity Week 40 | 55 | 28 | 48 | 76 | 304 | 224 | 98 | 54 |
| Morbidity Week 41 | 38 | 11 | 35 | 52 | 221 | 158 | 84 | 17 |
| Morbidity Week 42 | 10 | 12 | 18 | 72 | 180 | 116 | 64 | 14 |
| Morbidity Week 43 | 27 | 0 | 11 | 30 | 111 | 64 | 57 | 7 |
Table text extracted from the original PDF; superscript letters are shown inline. The original table image is below.
View original table image
| COVID-19 Positive Cases | Province/City | — | — | — | — | — | — | — |
|---|---|---|---|---|---|---|---|---|
| Biliran | Eastern Samar | Northern Samar | Samar | Leyte | Southern Leyte | Tacloban City | Ormoc City | |
| Morbidity Week 36 | 74 | 30 | 158 | 113 | 702 | 219 | 126 | 138 |
| Morbidity Week 37 | 68 | 30 | 155 | 115 | 712 | 191 | 128 | 128 |
| Morbidity Week 38 | 64 | 30 | 148 | 116 | 721 | 168 | 130 | 131 |
| Morbidity Week 39 | 62 | 31 | 146 | 118 | 730 | 150 | 132 | 137 |
| Morbidity Week 40 | 60 | 31 | 142 | 119 | 739 | 134 | 133 | 136 |
| Morbidity Week 41 | 60 | 32 | 140 | 121 | 749 | 122 | 135 | 138 |
| Morbidity Week 42 | 60 | 32 | 138 | 122 | 758 | 112 | 137 | 140 |
| Morbidity Week 43 | 60 | 32 | 137 | 123 | 767 | 104 | 139 | 142 |
Table text extracted from the original PDF; superscript letters are shown inline. The original table image is below.
View original table image
In addition, the COVID-19 cases of Leyte were expected to increase, which can be a problem to the community since cases are relatively high and an increase is expected like this, leaders in the local governments should consider tightening the restrictions. Meanwhile, Southern Leyte's cases was forecasted to exponentially decrease. Tacloban City and Ormoc City COVID-19 cases was forecasted to increase, although Ormoc City has alternating increase and decrease of the forecasted COVID-19 cases an obvious increase can still be observed.
It can be inferred that Leyte has the highest total of forecasted cases, followed by Southern Leyte, while Eastern Samar have the lowest total forecasted infections over the eight-week period.
Predictive Accuracy
To determine the predictive accuracy of the ARIMA models, the researchers used Mean Absolute Error (MAE), Root Mean Square Error (RMSE) and Mean Absolute Percentage Error (MAPE). Table 4 shows the result for the tests mentioned. Based on the results, healthcare experts and government officials may be convinced that using ARIMA models to forecast cases is a reliable method, and they can use this forecasting method to do so. It can provide them with insights and projections of how the cases will develop in the next weeks, allowing them to take the necessary action to contain the spread of COVID-19. This can also help people in the community understand that forecasts for COVID-19 cases can be reliable, and that they should take precautions when the forecasted cases are high or likely to grow. Their cooperation might have a significant impact on reducing the spread of the virus and potentially stopping its transmission in the region.
| Province/City | MAE | RMSE | MAPE |
|---|---|---|---|
| Biliran | 36.88 | 43.52 | 1.05 |
| Eastern Samar | 15.38 | 17.93 | undefined |
| Northern Samar | 72.63 | 83.27 | 3.04 |
| Samar | 53.88 | 58.49 | 0.84 |
| Leyte | 355.63 | 416.66 | 1.79 |
| Southern Leyte | 69.63 | 81.13 | 0.33 |
| Tacloban City | 42 | 48.43 | 0.54 |
| Ormoc City | 79.88 | 89.88 | 4.9 |
Table text extracted from the original PDF; superscript letters are shown inline. The original table image is below.
View original table image
Conclusion
In this study, the dataset used for forecasting was from the week the province/city first reported a positive case to morbidity week 35 of 2021. ARIMA models were used to model the reported cases in the different provinces/cities of Eastern Visayas and forecast the positive cases for morbidity weeks 36 to 43 of 2021. The dataset used to measure the predictive accuracy was also from morbidity weeks 36 to 43 of 2021. The predicted weekly cases for the different provinces/cities from morbidity week 36 to 43 of 2021 obtained using the ARIMA models exhibited various behaviors throughout the eight-week period. Leyte has the highest forecasted cases in Eastern Visayas, while the lowest forecasted cases were observed in Eastern Samar. The corresponding models for the provinces and cities did excellent in predicting the COVID-19 cases. The best performing respective model for MAE and RMSE was the model for Eastern Samar, while the respective model with the least predictive accuracy for these measurements was for Leyte. In addition, the best performing respective model for MAPE was the model for Southern Leyte, while the model for Ormoc City had the least predictive accuracy based on this measurement.
Acknowledgements
The researchers greatly appreciate the Department of Health (DOH) for providing the researchers a reliable COVID-19 dataset that was used in this study, which made the all the analysis possible.
References
1 in the original paper- World Health Organization (WHO). Novel Coronavirus (2019-nCoV) Situation Report-1, 10, 13; c2020a. Available from: https://www.who.int/docs/defaultsource/coronaviruse/situation-reports/
Cited by 1
From OpenAlex, OpenCitations and reference lists read by Scinovex
- Arima Modeling of International Visitor Arrivals in the Philippines: 2008 – 2023 ↗
Jhaina B. Agosto, Thea C. Galos, Lyka T. Obejas · Research Square · 2024
Abstract This descriptive, quantitative, correlational, and predictive research aimed to analyze the monthly international visitor arrivals in the Philippines from January 2008 to December 2023 and forecast future values utilizing secondary data from the Department of Tourism, encompassing 192 months, with 24 months used for forecasting. The analysis employed various statistical methods such as Time Series Analysis, Exploratory Data Analysis…
❝ 2PDF