
Research article · 2022 · Full text
International Journal of Statistics and Applied MathematicsAvailability analysis considering two subsystem failures simultaneously via markov modeling
Volume 7(1) · Pages 46–50 · DOI: 10.22271/maths.2022.v7.i1a.774 ↗
Research areasReliability and Maintenance OptimizationSoftware Reliability and Analysis ResearchManufacturing Process and Optimization
Abstract
Author-writtenThis paper discusses the performance analysis of the alloy wheel plant (AWP). Till now researchers (1, 5, 9, 14, and 25) took assumption that only one failure at one time but this paper considered two failures at one time. The AWP mainly consists of four subsystems in series (Gdc Machine, Cutting Machine, Heat Treatment Machine and Shot Blasting Machine). The failure and repair rates are implicit to be constant and statistically independent. A transition diagram developed form the interrelationship among the working and failed state. Mathematical modeling of this system is done by applying markov- birth – death processes. These equations are solved by recursive method and optimized reliability is calculated for failure and repair rates. The obtaining result is helpful to improve the overall performance of alloy wheel plant.
Summary
Source-checkedPlain-language reading of the full paper, prepared with AI and checked against the text. Each point links to the authors' own words.
Why it matters
- Rapid technological changes drive industries to seek more reliable products with improved performance and lifespan. View evidence ↗
- The alloy wheel plant (AWP) is composed of four subsystems arranged in series: the GDC Machine, Cutting Machine, Heat Treatment Machine, and Shot Blasting Machine. View evidence ↗
- Previous research typically assumed only one failure could occur at a time, whereas this study considers the possibility of two simultaneous failures. View evidence ↗
The question
- The study aims to improve and optimize the reliability of the alloy wheel plant by analyzing failure and repair rates. View evidence ↗
What they did
- The model assumes that failure and repair rates are constant and statistically independent. View evidence ↗
- The system is mathematically modeled using Markov birth-death processes. View evidence ↗
- The resulting equations are solved using a recursive method to calculate optimized reliability based on failure and repair rates. View evidence ↗
What they found
- For the GDC Machine, availability varies based on repair rates; for example, at a repair rate of 0.10, availability ranges from 0.220 to 0.349 depending on the failure rate. View evidence ↗
- For the Cutting Machine, at a repair rate of 0.05, the system availability ranges between 0.268 and 0.289 across different failure rates. View evidence ↗
- For the Heat Treatment Machine, at a repair rate of 0.11, availability ranges from 0.275 to 0.284. View evidence ↗
- For the Shotblasting Machine, at a repair rate of 0.13, availability ranges from 0.280 to 0.290. View evidence ↗
- The repair rate of the GDC machine has a more significant effect on overall system availability compared to the other subsystems. View evidence ↗
What it means
- The authors state that future work will involve extending the model to include random failures at random times without assuming a specific number of failures. View evidence ↗
Visual summary
1 visualsIllustrations explain the paper; they do not show study data.
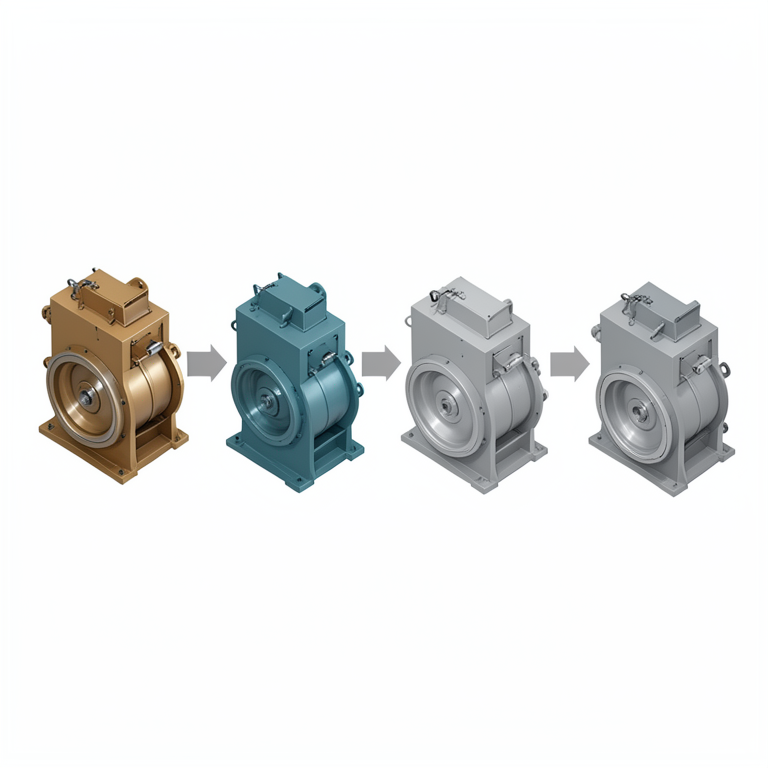
AWP System Architecture
AI-generated conceptual illustration (four industrial alloy wheel manufacturing machines (GDC machine, cutting machine, heat treatment machine, and shot blast). It explains the idea and does not show study data.
View source evidence ↗Figures & tables
From the original paper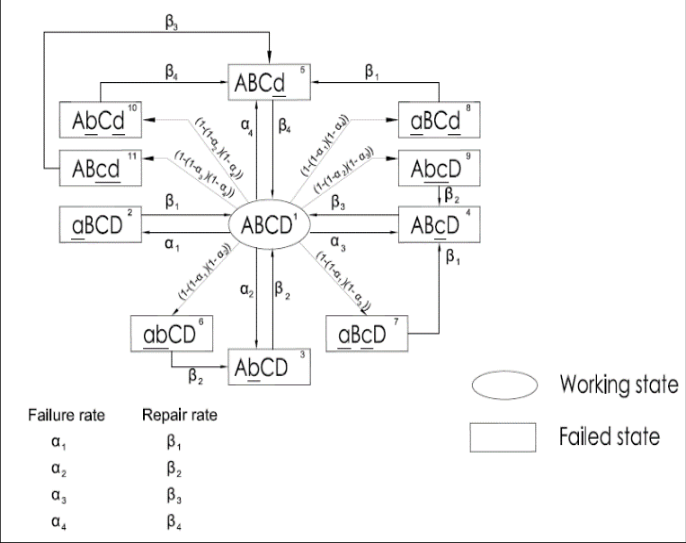 Figure 1
 Table 1
 Table 2
 Table 3
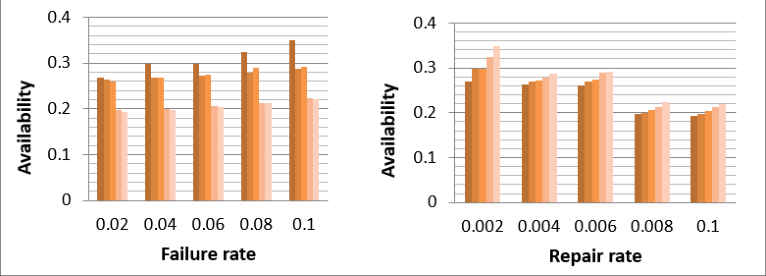 Figure 2
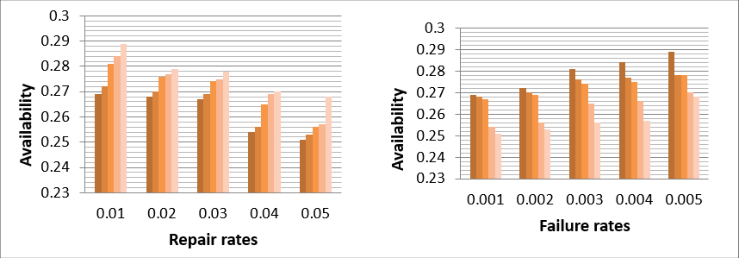 Figure 2
 Table 4
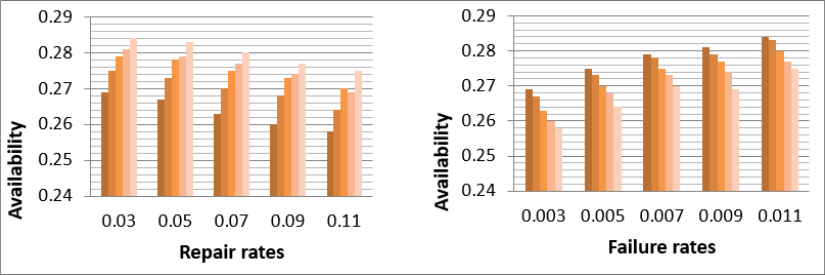 Figure 3
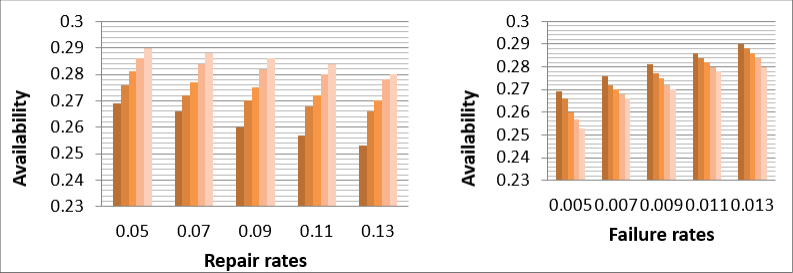 Figure 4
Introduction
In today's scenario changes in technology are very rapid, every industry trying to make a more reliable product, which is having better life, better performance. In this paper authors try to improve reliability of AWP and for optimizing reliability failure and repair rates are given. Singh and Goyal (2013) [2] discussed the Behavior analysis of a biscuit making plant using Markov Regenerative modeling. The methodology of the system based on Markov model which is used to find the availability of the system and transient behavior of repairable mechanical biscuit shaping system pertaining to a biscuit manufacturing plant. Garg, Kumar and Singh (2009) [2] discussed about the Availability analysis of a cattle feed plant using matrix method. This plant contains seven subsystems arrange in series. The mathematical model has been developed by using Markov birth-death process and makes a transition diagram. Tewari and Kumar (2016) [3] the paper describes the availability analysis of milling system in a rice milling plant. The failure and repairs rates are assumed to be exponential distribution and problem is formulated using Markov birth-death process. Kumar (2014) [4] discussed the availability analysis of a thermal power plant boiler air circulation system using Markov approach. In this plant the system contains four subsystems with full working state, reduced capacity state and failed state. Rajbala & Garg (2019) [6] discussed about the steady state and time dependent availability analysis of a manufacturing plant. Rajbala & Garg (2019) [6] discussed about the Behaviour analysis of alloy wheel plant. Rajbala & Kumar (2021) [7] discussed about an article on the system reliability and availability analysis using RPGT-A general approach. Kumar and Garg (2019) [19] have discussed the reliability technology theory and its applications. Kumar et al. (2018) [10] have studied behaviour analysis of a bread making system. Kumar et al. (2019) [19] analyzed sensitivity analysis of a cold standby framework with priority for preventive maintenance consist two identical units with server failure utilizing RPGT. Present paper consists two units one of which is online while other is kept is cold standby mode. Online & cold standby unit are indistinguishable in nature & have just two modes one is good and other is totally failed. Rajbala, et al. (2019) [6] have studied the system modeling and analysis: a case study EAEP manufacturing plant. Kumar et al. (2017) [14] have studied behavior analysis in the urea fertilizer industry.
Kumar et al. (2017) [14] have examined the mathematical modeling & profit analysis of an edible oil refinery plant. Kumar et al. (2019) [13] studied mathematical modeling & behavioral analysis of a washing unit in paper mill. Kumar et al. (2018) [10] paper analyzed sensitivity analysis of 3:4: good system plant. Priya et al. (2021) [15] Vedic mathematics in derivatives and integration, differential equations and partial differential equations. Kumari et al. (2021) [19] studied the constrained problems using PSO. Kumari et al. (2021) [17] discussed the profit analysis of an agriculture thresher plant in steady state using RPGT. Anchal et al. (2021) [18] discussed the SRGM model using differential equation has been proposed, in which two categories of faults: simple and hard with respect to time in which these occur for isolation and removal after their detection has been presented.
System Description
The description of the following subsystems are described as below:
Gdc Machine: In the Gravity die casting machine, casting is produced with the help of gravity pressure. Cutting Machine: Cutting machine is used to cut the riser. Heat Treatment Machine: In heat treatment machine hardness of casting is improved. In heat treatment machine there are two types of hot chamber in which wheel is hold for 10 hours. i. Solutionizing Chamber-In this chamber wheel is hold for 6 hours and then wheel is cooled quickely with the help of water. ii. Azing Chamber-After solutiuonizing wheel is forward to azing chamebr for 4 hours. Shotblasting Machine: In this machine small steel shots are bumbared on casting to make it rough. Steel balls are bumbarded with the help of high air pressure.
Transition Diagram
The transition diagram is used to express the behaviour of the all the subsystems. p I (t), probability of the system is in i th state at time
Differential equation of transition diagram P₁'(t)+ (α₁+α₂+α₃+α₄ + (1-(1-α₁) (1-α₂)) + (1-(1-α₁) (1-α₃)) + (1-(1-α₁) (1-α₄)) + (1-(1-α₂) (1-α₃)) + (1-(1-α₂) (1-α₄)) + (1-(1-α₃) (1-α₄)) P₁(t) = β₁ P₂(t) + β₂ P₃(t) + β₃ P₄(t) + β₄ P₅(t).
After simplification this equation can be written as: p₁' (t) + (4(α₁+α₂+α₃+α₄) -(α₁ α₂+α₁ α₃+α₁ α₄+α₂ α₃+α₂ α₄+α₃ α₄)) p₁ (t) = β₁ p₂ (t) + β₂ p₃ (t) + β₃ p₄ (t) + β₄ p₅ (t) p₂' (t) + β₁ p₂ (t) =α₁ p₁ (t) p₃' (t) + β₂ p₃ (t) = α₂ p₁ (t) + β₂ p₆ (t)
p₄' (t) + β₃ p₄ (t) = α₃ p₁ (t) + β₁ p₇ (t) + β₂ p₉ (t) p₅' (t) + β₄ p₅ (t) = α₄ p₁ (t) + β₁ p₈ (t) + β₄ p₁₀ (t) + β₃ p₁ ₁ (t) p₆' (t) + β₂ p₆ (t) = (1-(1-α₁) (1-α₂)) p₁ (t) p₇' (t) + β₁ p₇ (t) = (1-(1-α₁) (1-α₃)) p₁ (t) p₈' (t) + β₁ p₈ (t) = (1-(1-α₁) (1-α₄)) p₁ (t) p₉' (t) + β₂ p₉ (t) = (1-(1-α₂) (1-α₃)) p₁ (t) p₁₀' (t) + β₄ p₁₀ (t) = (1-(1-α₂) (1-α₄)) p₁ (t) p₁₁' (t) + β₃ p₁₁ (t) = (1-(1-α₃) (1-α₄)) p₁ (t)
After solving these equations, we get the following equations p₂ (t) = z₀ p₁ (t); Where z₀ = α₁/β₁ p₃ (t) = z₁ p₁ (t); Where z₁ = (2α₂+α₁-α₂α₁ /β₂) p₄ (t) = z₂ p₁ (t); Where z₂ = (3α₃+α₁+α₂-α₃α₁-α₃α₂ / β₃) p₅ (t) =z₃ p₁ (t); Where z₃= (4α₄+α₁+α₂+α₃-α₄α₁-α₄α₂-α₄α₃/β₄) p₆ (t) = z₄ p₁ (t); Where z₄ = (α₂+α₁-α₁α₂/β₂) p₇ (t) = z₅ p₁ (t); Where z₅ = (α₃+α₁-α₃α₁/β₁) p₈ (t) = z₆ p₁ (t); Where z₆ = (α₄+α₁-α₄α₁/β₁) p₉ (t) = z₇ p₁ (t); Where z₇ = (α₃+α₂-α₃α₂/β₂) p₁₀ (t) = z₈ p₁ (t); Where z₈ = (α₄+α₂-α₄α₂/β₄) p₁₁ (t) = z₉ p₁ (t); Where z₉= (α₄+α3-α₄α₃/β₃) The Probability pᵢ (t) is determined by using normalizing condition ∑ 𝑝ᵢ 11 𝑖=0 = 1 p₁ + p ₂+ p₃ + p₄ + p ₅+ p₆ + p₇ + p₈ + p₉ + p₁₀ + p₁₁ = 1 p₁+z₀ p₁ (t) +z₁ p₁ (t) + z₂ p₁ (t) + z₃ p₁ (t) + z₄ p₁ (t) + z₅ p₁ (t) + z₆ p₁ (t) + z₇ p₁ (t) + z₈ p₁ (t) + z₉ p₁ (t) =1 (1 + z₀ + z₁ + z₂ + z₃ + z₄ + z₅ + z₆ + z₇ + z₈ + z₉) p₁ (t) = 1 p₁ (t) * V = 1 p₁ (t) = 1/V Where, V = (1 + z₀ + z₁ + z₂ + z₃ + z₄ + z₅ + z₆ + z₇ + z₈ + z₉) Aᵥ = P₁
Performance Analysis
The performances of AWP mostly affected by failure and repair rates of each subsystem. The transition diagram includes all possible state (Working state and failed state) that is, failure rate is αᵢ and repair rate is βᵢ. The table 1 to 4 represents the availability decision for AWP.
| α₁→ β₁↓ | 0.002 | 0.004 | 0.006 | 0.008 | 0.010 | Constant value |
|---|---|---|---|---|---|---|
| 0.02 | 0.269 | 0.264 | 0.260 | 0.198 | 0.194 | α₂=0.001 β₂=0.01 α₃=0.003 β₃=0.03 α₄=0.005 β₄=0.05 |
| 0.04 | 0.298 | 0.269 | 0.269 | 0.199 | 0.198 | |
| 0.06 | 0.299 | 0.272 | 0.274 | 0.205 | 0.203 | |
| 0.08 | 0.324 | 0.279 | 0.289 | .212 | 0.213 | |
| 0.10 | 0.349 | 0.288 | 0.291 | 0.224 | 0.220 |
Table text extracted from the original PDF; superscript letters are shown inline. The original table image is below.
View original table image
Conclusion
The repair rate of GDC machine affect availability of system more effectively as comparison to another system. This modal is more realistic as compared to those models in which one failure is considered at one time. As in practical situations any number of failures can happen at one time. Further, we will extend our work to any random failures in random time without putting any assumption on number of failures. Subsystem name and their rank based on their "repair rates effect availability".
Figures and tables from the paper
| α₂→ β₂↓ | 0.001 | 0.002 | 0.003 | 0.004 | 0.005 | Constant value |
|---|---|---|---|---|---|---|
| 0.01 | 0.269 | 0.268 | 0.267 | 0.254 | 0.251 | α₁=0.002 β₁=0.02 α₃=0.003 β₃=0.03 α₄=0.005 β₄=0.05 |
| 0.02 | 0.272 | 0.270 | 0.269 | 0.256 | 0.253 | |
| 0.03 | 0.281 | 0.276 | 0.274 | 0.265 | 0.256 | |
| 0.04 | 0.284 | 0.277 | 0.275 | 0.269 | 0.257 | |
| 0.05 | 0.289 | 0.278 | 0.278 | 0.270 | 0.268 |
Table text extracted from the original PDF; superscript letters are shown inline. The original table image is below.
View original table image
| α₃→ β₃↓ | 0.003 | 0.005 | 0.007 | 0.009 | 0.011 | Constant value |
|---|---|---|---|---|---|---|
| 0.03 | 0.269 | 0.267 | 0.263 | 0.260 | 0.258 | α₁=0.002 β₁=0.02 α₂=0.001 β₂=0.01 α₄=0.005 β₄=0.05 |
| 0.05 | 0.275 | 0.273 | 0.270 | 0.268 | 0.264 | |
| 0.07 | 0.279 | 0.278 | 0.275 | 0.273 | 0.270 | |
| 0.09 | 0.281 | 0.279 | 0.277 | 0.274 | 0.269 | |
| 0.11 | 0.284 | 0.283 | 0.280 | 0.277 | 0.275 |
Table text extracted from the original PDF; superscript letters are shown inline. The original table image is below.
View original table image
| α₄→ β₄↓ | 0.005 | 0.007 | 0.009 | 0.011 | 0.013 | Constant value |
|---|---|---|---|---|---|---|
| 0.05 | 0.269 | 0.266 | 0.260 | 0.257 | 0.253 | α₁=0.002 β₁=0.02 α₂=0.001 β₂=0.01 α₃=0.003 β₃=0.03 |
| 0.07 | 0.276 | 0.272 | 0.270 | 0.268 | 0.266 | |
| 0.09 | 0.281 | 0.277 | 0.275 | 0.272 | 0.270 | |
| 0.11 | 0.286 | 0.284 | 0.282 | 0.280 | 0.278 | |
| 0.13 | 0.290 | 0.288 | 0.286 | 0.284 | 0.280 |
Table text extracted from the original PDF; superscript letters are shown inline. The original table image is below.
View original table image
References
18 in the original paper- Singh P, Goyal A. Behavior analysis of a biscuit making plant using Markov Regenerative modeling, International Journal on theoretical and applied research in mechanical engineering. 2013;2(3):2103.
- Garg D, Kumar K, Singh J. Availability analysis of a cattle feed plant using matrix method. International Journals of Engineering. 2010;3(2):201-19.
- Tewari PC, Kumar P. Availability analysis of milling system in a rice milling plant, World Academic of science, Engineering and technology. 2016 Sep 4;10(8):1600-9.
- Kumar. Availability analysis of thermal power plant boiler air circulation system using Markov approach, Decision Science letters, 2014;3(1):65-72.
- Rajbala, Arun Kumar, Deepika Garg. Systems Modeling and Analysis: A Case Study of EAEP Manufacturing Plant. International Journal of Advanced Science and Technology. 2019;28(14):08-18.
- Rajbala, Deepika Garg. Behaviour analysis of alloy wheel plant. International Journal of Engineering and Advanced Technology (IJEAT). 2019;9(2):319-327. ISSN 2249-8958.
- Rajbala, Kumar A. Article on the system reliability and availability analysis using RPGT-A general approach, Galaxy International Interdisciplinary Research Journal. 2021;9(5):371-375.
- Kumar A, Garg D, Goel P. Mathematical modeling and behavioral analysis of a washing unit in paper mill, International Journal of System Assurance Engineering and Management. 2019;1(6):1639-1645.
- Kumar A, Garg D, Goel P. Sensitivity analysis of a cold standby system with priority for preventive maintenance. Journal of Advance and Scholarly Researches in Allied Education. 2019;16(4):253-258.
- Kumar A, Goel P, Garg D. Behaviour analysis of a bread making system. International Journal of Statistics and Applied Mathematics. 2018;3(6):56-61.
- Kumar A, Garg D, Goel P, Ozer O. Sensitivity analysis of 3:4: good system. International Journal of Advance Research in Science and Engineering. 2018;7(2):851-862.
- Kumar A, Garg D, Goel P. Mathematical modeling and profit analysis of an edible oil refinery industry, Airo International Research Journal. 2017;XIII:1-14.
- Kumar A, Garg D. Reliability technology theory and application, Lap Lambert Academic Publishing in Germany, ISBN 978-613-9-47665-7; 2019.
- Kumar A, Goel P, Garg D, Sahu A. System behavior analysis in the urea fertilizer industry, Book: Data and Analysis (978-981-10-8526-0), Communications in computer and information Science (CCIS), Springer, 2017, 3-12.
- Priya Goel P, Kumar A. Vedic mathematics in derivatives and integration, differential equations and partial differential equations. Journal of Mathematics Problems, Equations and Statistics. 2021;2(2):7-32.
- Priya Goel P, Kumar A. A brief into Vedic mathematicsits origin, features and sutras, Journal of Mathematics Problems, Equations and Statistics. 2021;2(1):36-39.
- Anchal Majumder A, Goel P. Irregular Fluctuation of Successive SW Release Models. Design Engineering. 2021;7:8954-8962.
- Kumari S, Khurana P, Singla S. Behavior and profit analysis of a thresher plant under steady state. International Journal of System Assurance Engineering and Man. 2022 Feb;13(1):166-71.
Cited by 2
From OpenAlex, OpenCitations and reference lists read by Scinovex
- Stochastics analysis of a polytube plant ↗
Arun Kumar, Rajbala, Pooja Khurana · Journal of Mathematical Problems Equations and Statistics · 2022
The Purpose of this paper is to compute reliability parameters of polytube plant having four units using Regenerative point Graphical Technique (RPGT). A Polytube plant consists of four sub systems such as Mixture (A), Extruder (B), Die (C), and Cutter (D). These subsystems are configured in series for successful working of plant. Units A & B have subunits in series…
❝ 6PDF - Behaviour and Profit Analysis of Nidec Manufacturing Plant Using RPGT ↗
Deepika Garg Rajbala · Journal of Propulsion Technology · 2023
In this paper behaviour and profit analysis of Nidec manufacturing plant are evaluated. The Nidec manufacturing plant contains six subsystems. All the subsystems are connected in series. Unit ‘K’ is more sensitive than that of different subunits thus ‘M’ is the standby subunit. A solitary server is available for 24 x 7 hours to repair all type of failures of…
❝ 0PDF