
Research article · 2022 · Full text
International Journal of Statistics and Applied MathematicsFuzzy inventory model with multilevel permissible delay in payments
Volume 7(1) · Pages 146–153 · DOI: 10.22271/maths.2022.v7.i1b.785 ↗
Research areasSupply Chain and Inventory ManagementSustainable Supply Chain Management
Abstract
Author-writtenIn the last few decades the study of deteriorating items has gained enormous importance. Most of the companies are facing cut throat competition due to the wastage of resources that drastically reduce their profit margins. So decision makers adopt various techniques for disposal of decaying items with minimum inventory cost. In the present paper a fuzzy inventory model for deteriorating items is considered with four levels of permissible delay in payments. Time and selling price induced quadratic demand is considered and fuzzy approach is introduced in certain parameters to count the uncertainty in the environment. The objective of the study is to optimize the total cost function to reduce economic losses. Empirical Investigation is demonstrated and sensitivity analysis is carried out to gain managerial insights.
Summary
Source-checkedPlain-language reading of the full paper, prepared with AI and checked against the text. Each point links to the authors' own words.
Why it matters
- Deterioration is a continuous process that reduces the effectiveness of goods during long-term storage. View evidence ↗
- Resource wastage from deteriorating items can drastically reduce profit margins for companies facing intense competition. View evidence ↗
- Fuzzy approaches are used in inventory modeling to account for uncertainties in environmental parameters. View evidence ↗
The question
- The study aims to develop a fuzzy inventory model for deteriorating items that incorporates four levels of permissible delay in payments. View evidence ↗
- The primary objective is to optimize the total cost function to minimize economic losses. View evidence ↗
What they did
- The model assumes a quadratic demand rate that is induced by both time and selling price. View evidence ↗
- The researchers used triangular fuzzification and three defuzzification methods: Graded Mean Representation, Signed Distance, and Centroid methods. View evidence ↗
- The model was tested using Mathematical 5.1 software through empirical investigations of four cases, comparing crisp and fuzzy models. View evidence ↗
What they found
- The Graded Mean Integration method of defuzzification resulted in the minimum cost compared to the Signed Distance and Centroid methods. View evidence ↗
- Increasing the rate of deterioration leads to an increase in both the total cost and the order quantity. View evidence ↗
- A higher rate of cash discount decreases the total cost but increases the order quantity. View evidence ↗
- Offering a longer permissible delay period initially reduces total cost and order quantity, but total cost eventually increases after a certain point. View evidence ↗
What it means
- The authors conclude that increasing the cash discount rate minimizes total cost by promoting earlier sales of inventory. View evidence ↗
- Sellers are advised to use multilevel permissible delay in payments to encourage early sales and avoid deterioration costs. View evidence ↗
- Future research could generalize the model by allowing for shortages and including factors such as entropy and advertisement frequency. View evidence ↗
Visual summary
1 visualsIllustrations explain the paper; they do not show study data.
Cost and Quantity Drivers
AI-generated conceptual illustration (Industrial warehouse inventory of perishable goods). It explains the idea and does not show study data.
View source evidence ↗Figures & tables
From the original paper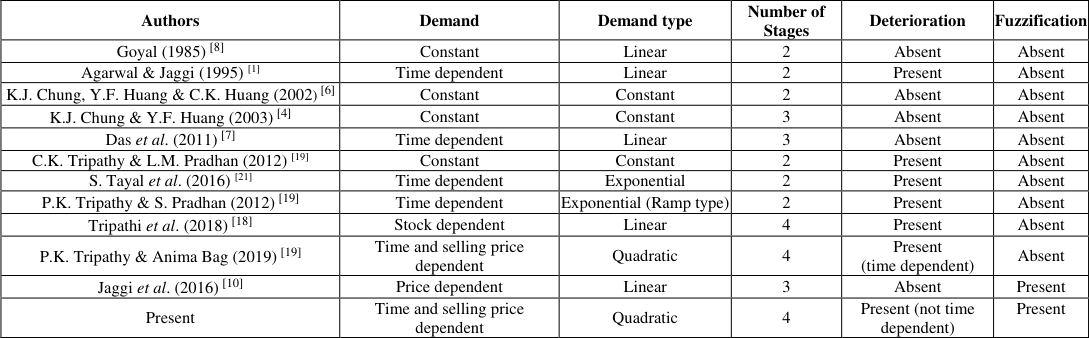 Table 1
Introduction
Deterioration is a continuous process that decreases the effectiveness of goods when stored for a long time. So decision makers adopt various techniques for disposal of decaying items with minimum inventory cost. Managing the inventory of perishable items helps in smooth functioning of an enterprise or business organization. Goyal (1985) [8] was the pioneer who developed an inventory model considering delay in payment. Aggarwal and Jaggi (1995) [1] generalized Goyal's model by allowing credit period in the inventory model for deteriorating items. Chung and Huang (2005) [5] presented an EOQ model for inventory control in the presence of trade credit. Chung, Huang, and Huang (2002) [6] and Chung and Huang (2003) [4] considered permissible delay in payments to develop an optimal replenishment policy for EOQ models. Das et al. (2011) [7] allowed credit period to the buyer for time varying demand in developing the inventory model. Tripathy and Pradhan (2012) [19] depicted an interactive inventory model between producer and buyer for extraordinary purchase and credit period with two parameter weibull demand rate. An economic production quantity model under permissible delay was introduced with time proportional deterioration. Teng et al. (2014) [16] considered two level trade credits in developing the inventory model. Sarkar et al. (2015) [12] considered fixed lifetime products with trade credit policy in their inventory model. Tripathy and Pandey (2015) [17] introduced backlogging in permissible delay period with time dependent demand. Tayal et al. (2016) [21] applied preservation technology in the integrated production inventory model for perishable products. Tripathi et al. (2018) [18] adorned their research work by using stock dependent demand under various trade credits. Bag and Tripathy (2018) [2] developed the inventory model by considering four levels of permissible delay periods. To get a legalistic approach to the inventory parameters fuzziness is applied. It is used in situations when uncertainties prevail in the formulation of the model. Park (1987) [12] fuzzified the inventory carrying cost and developed the inventory model. Mishra and Singh (2011) [11] , Yao and Chiang (2003) [4] , Jaggi et al. (2012) [9] , Jaggi et al. (2016) [10] , Jing et al. (2003) [3] , Tripathy and Bag (2019) [19] are some other researchers who developed the inventory models by introducing the fuzzy approach. In this chapter a fuzzy inventory model is framed for deteriorating items with time and selling price induced quadratic demand.
Four levels of conditional deliveries are considered and individual cases are developed accordingly. The objective of the study is the optimization of the cost function to reduce economic losses. The rest of the chapter is developed as follows. Notations and assumptions are placed in section 2. The mathematical model of the inventory problem is derived in section 3. Empirical investigation for the proposed model is placed in section 4. Further sensitivity analysis is carried out in section 5 to study the changes in the decision variables with a change in system parameters. Finally the concluding remarks with scope of future research are emphasized in section 6. : The total cost of the inventory system per year for cases I, II, III, IV respectively.
The following assumptions are considered in this chapter. 1. The demand rate is both selling price and time induced.
2. The lead time is zero or negligible. 3. Shortage is not allowed. 4. The permissible delay period is more than the cash discount period.
Mathematical Formulation and Optimal Solution
The inventory level for the depleting items at any instance of time t with selling price dependent demand is represented by the differential equation as below.
With the initial condition ( ) 0 IT , the solution of the above differential equation is
At the beginning, the supplier has 'Q' units in the inventory system.
Total cost/year consists of the following elements.
Four possible cases are considered. In case-I
some interest is paid and also some interest is earned. In case-II
The cash discount gained by the customer per unit time =
The interest paid per year is
During
) , 0 ( d M the customer sells products and deposits the revenue into an account that earns e I per dollar per year. Thus interest earned per unit time is
Using Graded Mean Representation Method of defuzzification, the total cost will be Using Centroid Method of defuzzification, the total cost will be
Case-II (M1>T)
In this case no interest is payable. Cash discount is same as that of case -I. The interest earned per unit time is In the similar manner using graded mean integration method, signed distance method and centroid method of defuzzification, the total costs will be
The interest earned per unit time is
In the similar manner using graded mean integration method, signed distance method and centroid method of defuzzifications, the total costs will be In the similar manner using graded mean integration method, signed distance method and centroid method of defuzzification, the total costs will be
Empirical Investigation
To illustrate the effect of the proposed model, the following empirical investigation is performed with four possible cases. Both crisp and fuzzy models are considered for the purpose to obtain more realistic result. Mathematical 5.1 software is used to obtain the relevant results and convexity test is also performed.
Numerical illustration-1
Let the parameters be set as follows The increase in rate of cash discount 'r' results a decrease in the total cost but results more Order Quantity. The more the period of cash discount d M offered the less is the Total Cost and Order Quantity. But after certain period the Total Cost increases. Similarly the more the permissible delay period is offered, the less is the Total Cost and Order Quantity. But after certain period the total cost increases.
Case
Case
Conclusion
This paper develops a fuzzy inventory model with multilevel permissible delay in payments. Cash discount period is less than the permissible delay period. The total cost is minimized by applying optimization technique. Through empirical investigation and sensitivity analysis it is concluded that the rate of cash discount should be more so as to minimize the total cost as it promotes the early sale of the inventory. The increased rate of deterioration results a rise in total cost. So it is advised to the seller to sell the inventory as early as possible to avoid deterioration by providing multilevel permissible delay in payments so as to minimize the total cost. The results in this paper provide a valuable reference to the decision makers in planning procurement and controlling inventories. The model can be applied in the inventory system that deals with perishable items like packaged foods, Grocery items, confectionery etc. This paper can be generalized by allowing shortage in the model. Advertisement frequency and entropy can also be included in the model for future study.
Figures and tables from the paper
| Authors | Demand | Demand type | Number of Stages | Deterioration | Fuzzification |
|---|---|---|---|---|---|
| Goyal (1985) [8] | Constant | Linear | 2 | Absent | Absent |
| Agarwal & Jaggi (1995) [1] | Time dependent | Linear | 2 | Present | Absent |
| K.J. Chung, Y.F. Huang & C.K. Huang (2002) [6] | Constant | Constant | 2 | Absent | Absent |
| K.J. Chung & Y.F. Huang (2003) [4] | Constant | Constant | 3 | Absent | Absent |
| Das et al. (2011) [7] | Time dependent | Linear | 3 | Absent | Absent |
| C.K. Tripathy & L.M. Pradhan (2012) [19] | Constant | Constant | 2 | Present | Absent |
| S. Tayal et al. (2016) [21] | Time dependent | Exponential | 2 | Present | Absent |
| P.K. Tripathy & S. Pradhan (2012) [19] | Time dependent | Exponential (Ramp type) | 2 | Present | Absent |
| Tripathi et al. (2018) [18] | Stock dependent | Linear | 4 | Present | Absent |
| P.K. Tripathy & Anima Bag (2019) [19] | Time and selling price dependent | Quadratic | 4 | Present (time dependent) | Absent |
| Jaggi et al. (2016) [10] | Price dependent | Linear | 3 | Absent | Present |
| Present | Time and selling price dependent | Quadratic | 4 | Present (not time dependent) | Present |
Table text extracted from the original PDF; superscript letters are shown inline. The original table image is below.
View original table image
References
21 in the original paper- Aggarwal SP, Jaggi CK. Ordering policies of deteriorating items under permissible delay in payment. Journal of Operational Research Society. 1995 May 1;46(5):658-62.
- Bag A. Tripathy PK. Decision support model with price and time induced demand under multilevel conditional deliveries, Revista Investigacion Operacional. 2019 Sep 5;40(4):441-451.
- Jing Yao S, Jershan Chiang. Inventory without backorder with fuzzy total cost and fuzzy storing cost defuzzified by centroid and signed distance. European Journal of Operational Research. 2003 Jul 16;148(2):401-409.
- Chung KJ, Huang YF. The optimal cycle time for EPQ inventory model under permissible delay in payments. International Journal of Production Economics. 2003 Jun 11;84(3):307-318.
- Chung KJ, Huang TS. The algorithm to the EOQ model for Inventory control and trade credit. Journal of the Operational Research Society. 2005 Mar;42(1):16-27.
- Chung KJ, Huang YF, Huang CK. The replenishment decision for EOQ inventory model under permissible delay in payments. OPSEARCH. 2002 Dec;39(5):327-340.
- Das D, Ray A, Kar S. Optimal payment time for retailer under permitted delay in payments by the wholesaler with dynamic demand and hybrid number cost parameters, Opsearch. 2011 Sep;48(3):171-196.
- Goyal SK. Economic order quantity under conditions of permissible delay in payments. Journal of Operational Research Society. 1985; Apr 1:36(4):335-338.
- Jaggi CK, Pareek S. Fuzzy inventory model for deteriorating items with time varying demand and shortages, American Journal of Operations Research. 2012;2(6):81-92.
- Jaggi CK, Yadavalli VSS, Sharma A, Tiwari S. A fuzzy EOQ Model with allowable shortage under different trade credit terms. Applied Mathematics and Information Science. 2016;10(2):785-805.
- Mishra VK, Singh LS. Deteriorating inventory model for time dependent demand and holding cost with partial backlogging. International Journal of Management Science and Engineering Management. 2011;6(4):267-271.
- Park K. Fuzzy-set theoretic interpretation of economic order quantity. IEEE Transactions on Systems, Man, and Cybernetics SMC. 1987 Nov;17(6):1082-1084.
- Sarkar B, Saren S. An inventory model with trade credit policy and variable deterioration for fixed lifetime products, Annals of Operation Research. 2015 Jun;229(1):677-702.
- Shah NH, Shah D, Patel DG. An EOQ Model for perishable inventory under credit period dependent quadratic demand, Mexican Journal of Operations Research. 2014;3:2-12.
- Shah NH, Jani MY, Shah DB. Economic Order Quantity Model under trade credit and customer returns for price sensitive quadratic demand, Revista Investigacion Operacional. 2015;36(3):240-248.
- Teng JT, Yang HL, Chern MS. An inventory model for increasing demand under two levels of trade credit linked to order quantity, Applied Mathematical Modeling. 2013 Aug 1;37(14-15):7624-7632.
- Tripathi RP, Pandey HS. Inventory model with Weibull time-dependent demand rate and completely backlogged permissible delay in payment. International Journal of Industrial Engineering Computations, Uncertain Supply chain Management. 2015;3(4):321-332.
- Tripathi RP, Singh D, Aneja S. Inventory models for stock dependent demand and time varying holding cost under different trade credits. Yugoslav Journal of Operations Research. 2018;28(1):139-151.
- Tripathy CK, Pradhan LM. An EOQ model for three parameter Weibull deterioration with permissible delay in payments and associated salvage value. International Journal of Industrial Engineering Computations. 2012;3(2):115-122.
- Tripathy PK, Bag A. Optimal disposal strategy with controllable deterioration and shortage. International Journal of Agricultural and Statistical Sciences. 2019;15(1):271-279.
- Sharma BM, Bharat GK, Tayal S, Larssen T, Bečanová J, Karásková P, et al. Perfluoroalkyl substances (PFAS) in river and ground/drinking water of the Ganges River basin: emissions and implications for human exposure. Environmental pollution. 2016 Jan 1;208:704-13.