
Research article · 2022 · Full text
International Journal of Advanced Biochemistry ResearchCorrelation between body surface area of newborns of different gestational ages with urine total proteins and urine microalbumin
Volume 6(1) · Pages 05–09 · DOI: 10.33545/26174693.2022.v6.i1a.77 ↗
Research areasPediatric Urology and Nephrology StudiesBirth, Development, and HealthGestational Diabetes Research and Management
Abstract
Author-writtenObjective: To establish a correlation between body surface area of newborns at different gestational ages and urine total proteins and urine microalbumin. Methods: Cross sectional study was conducted at a tertiary hospital in India. We randomly selected 175 normal newborns of different gestational ages. Systemic random spot second urine samples of normal newborns were selected (urine which baby had passed for the first time after birth was not used for sampling. Samples were used to estimate urinary proteins (total) (mg/dl), and urine albumin (mg/dl). Results: Proteinuria is common in newborns at all gestational ages. Tubular proteins are major constituents of urine proteins in neonatal urine, but a small amount of albumin is also lost in urine and their amounts increase linearly and proportionately as body surface area of newborn increases. This is a clear reflection of renal immaturity in newborns. Conclusion: All newborns have abnormally high proteinuria at all gestational ages, which increase with increase in gestational age. Urine microalbumin also showed a very mild increase with age, but it was very insignificant in comparison to UTP.
Summary
Source-checkedPlain-language reading of the full paper, prepared with AI and checked against the text. Each point links to the authors' own words.
Why it matters
- Normal human urine contains water and waste, but protein excretion is clinically relevant, with small tubular proteins typically being smaller than albumin molecules. View evidence ↗
- While abnormal proteinuria is defined in other populations (e.g., >100 mg/m2 of body surface area/24 hrs), no such reference values have been established for newborns. View evidence ↗
- Standard urine protein and albumin values for adults and children cannot be used for neonates because of the physiological immaturity of neonatal renal tubules. View evidence ↗
The question
- The study aimed to assess urinary protein and albumin excretion in normal neonates relative to their body surface area (BSA) across different gestational ages. View evidence ↗
What they did
- This was a cross-sectional study conducted at a tertiary hospital in India involving 175 randomly selected normal newborns of various gestational ages. View evidence ↗
- Urine samples were collected using pediatric bags at 24 hours of life, excluding the first urine passed after birth. View evidence ↗
- Urine total proteins (UTP) were measured via the Pyrocatechol Violet method and urine albumin (UM) via the Immunoturbidometric method, both using a Vitreous 4600 analyser. View evidence ↗
What they found
- The highest average urine total protein (UTP) was found in newborns with a gestational age >280 days, averaging 26.7 mg/dl (range: 19–50 mg/dl). View evidence ↗
- Urine microalbumin (UM) also showed a positive correlation with gestational age, though the Pearson coefficient was much lower at 0.040. View evidence ↗
- Urine total protein showed a positive correlation with body surface area (BSA), with a Pearson coefficient of 0.171. View evidence ↗
- Urine microalbumin also positively correlated with body surface area, with a Pearson coefficient of 0.069. View evidence ↗
- Across all gestational ages and BSA bands, urine microalbumin values averaged approximately 25% of the total urine protein content. View evidence ↗
What it means
- The authors conclude that all newborns exhibit abnormally high proteinuria that increases with gestational age, suggesting that renal tubular immaturity is more significant than glomerular immaturity. View evidence ↗
- The authors state that larger studies are required to establish normal reference ranges for neonatal proteinuria and albuminuria to help identify early kidney injury. View evidence ↗
Visual summary
3 visualsIllustrations explain the paper; charts are replotted from the paper's own table values.
Correlation Matrix Concept
AI-generated conceptual illustration (newborn infants of varying gestational ages). It explains the idea and does not show study data.
View source evidence ↗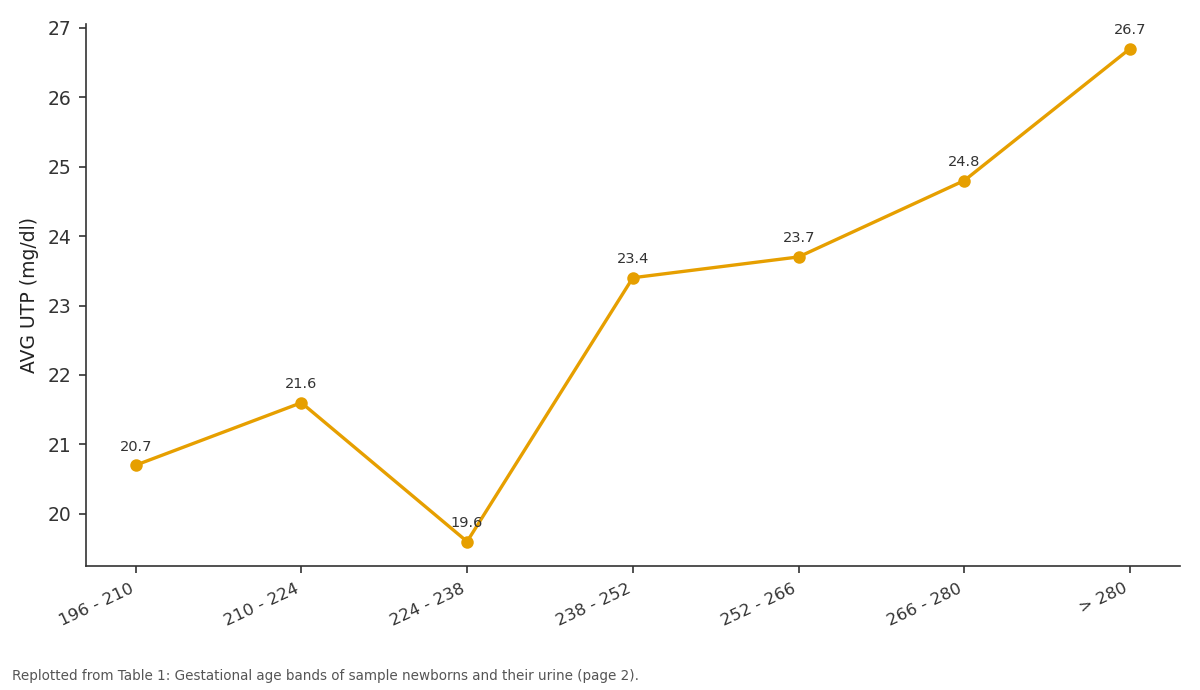
AVG UTP: 196 - 210 vs 210 - 224 vs 224 - 238 vs 238 - 252 vs 252 - 266
Replotted from Table 1 (page 2) of the original paper. Every bar is the paper's own table value.
View source evidence ↗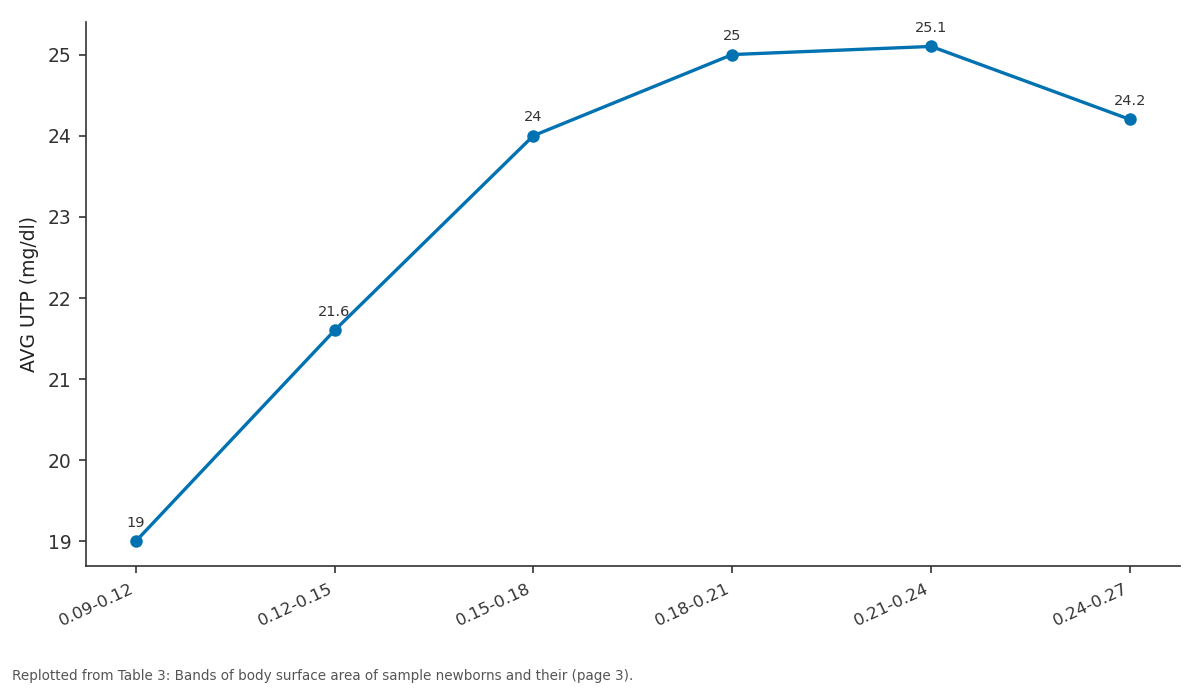
AVG UTP: 0.09-0.12 vs 0.12-0.15 vs 0.15-0.18 vs 0.18-0.21 vs 0.21-0.24
Replotted from Table 3 (page 3) of the original paper. Every bar is the paper's own table value.
View source evidence ↗Figures & tables
From the original paper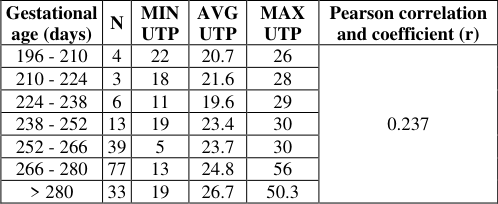 Table 1
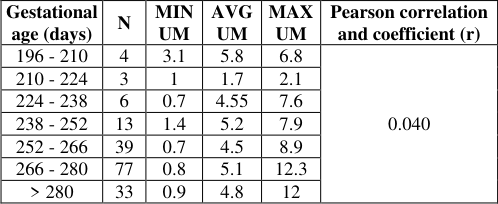 Table 2
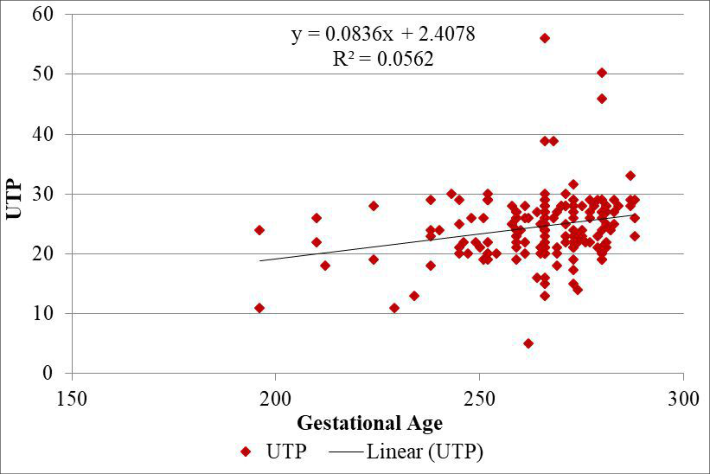 Figure 1
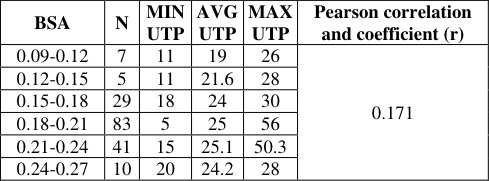 Table 3
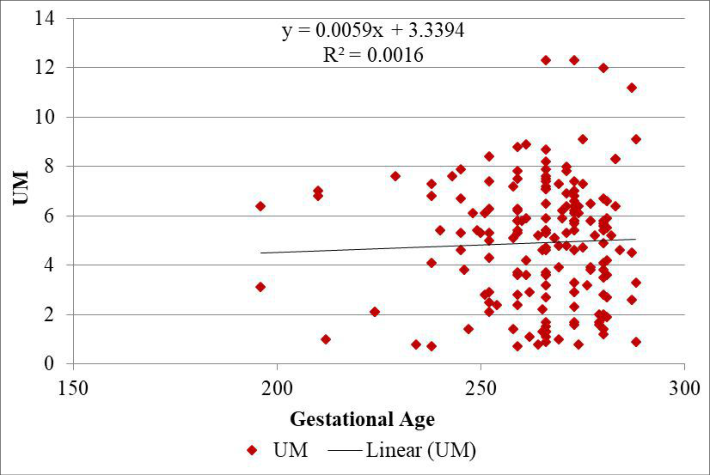 Figure 2
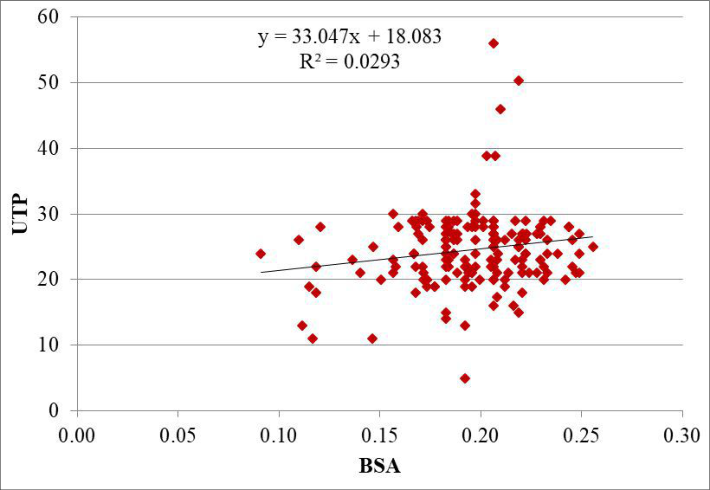 Figure 3
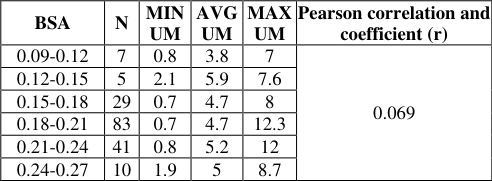 Table 4
 Table 6
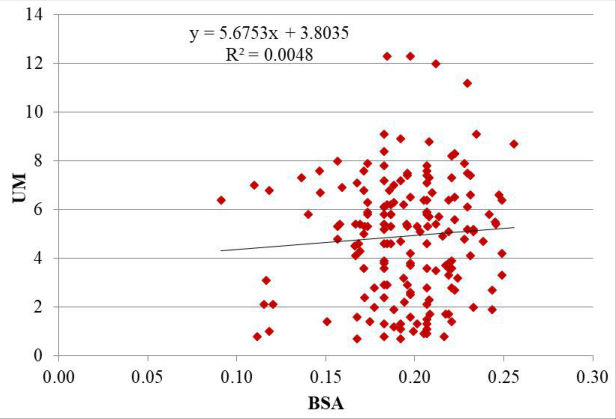 Figure 4
Introduction
Water and waste byproducts which are formed as a result of human body metabolism are the major components of normal human urine. But various other substances can also be excreted through the urine of which protein is the most relevant clinically [1] . Though some small molecular weight tubular proteins are excreted through the glomerular filtrate, but their size is normally less than that of albumin molecule. Minimal amounts of albumin can be excreted normally in urine. There is no absolute value of urine albumin levels defined in human urine at any age, but normal urine microalbumin creatinine ratio has been defined for adults as <30 gm/mg [2] . Similarly, Abnormal Total Proteinuria is defined in a number of ways through dipstick test, from spot urine sample and timed urine sample. For example, urine protein excretion, greater than 100 mg/m 2 of body surface area/24 hrs. Is considered abnormal. But no such value has been defined in newborns. The purpose of the present study is to assess the urinary protein and urinary albumin excretion in normal neonates as per their body surface area (BSA) at different gestational ages.
Materials and Methods
The present study was conducted as cross-sectional study at a tertiary hospital in Jaipur, India. 175 normal newborns of different gestational ages, delivered at the department of Obstetrics and Gynecology at a tertiary hospital in India were randomly selected. Urine sample of selected newborns was collected (urine which baby had passed for the first time after birth was not used for sampling) using the Pediatric urine collecting bag. The sample was taken at 24 hours of life by. Samples were used to estimate urinary proteins (total) (mg/dl) and urine albumin (mg/dl). Body surface area of all newborns was calculated using the following Haycocks et al. formula.
Body Surface Area (BSA) = weight 0.5378 (grams) 'length 0.3964 (cm)' 0.024265 It can be seen that the urine total protein was higher in >280 days of life with the average urine total protein value of 26. The figure 1 shows the relationship between urine total protein value of newborns with their gestational age at 24 hours of life. It was found that there is a positive correlation between the urine total proteins of newborns and their gestational age as the Pearson coefficient was 0.237. Therefore, with an increase in the gestational age the urine total protein will increase by 0.237. Figure 2 shows the relationship between the urine microalbumin value of newborns with their gestational age at 24 hours of life.
There is a positive correlation between urine microalbumin of newborns and the gestational age of newborns as the Pearson coefficient was 0.040. It shows that to increase in the gestational age, there will be an increase in the urine microalbumin by 0.040. 3 shows the bands of body surface area of sample newborns and their urine total protein values distributed according to the body surface area bands. It can be seen that the urine total protein was highest in the band group 0.21-0.24 with an average value of 25.1 mg/dl with the minimum and the maximum values in this band group being 15 mg/dl and 50.3 mg/dl and the number of samples taken in this group were 41. The minimum value of urine total protein was seen in the other band group 0.09-0.12 with urine total protein value 19 mg/dl. The average value of urine total proteins at band groups 0.12-0.15, 0.15 -0.18, 0.18-0.21. 0.24-0.27 were 21.6 mg/dl, 24 mg/dl, 25 mg/dl, 24.2 mg/dl respectively. Figure 3 shows the relationship between urine total protein value of newborns with their body surface area at 24 hours of life.
It was found that urine total protein has a positive correlation with the body surface area of the newborns as the Pearson coefficient for the same is 0.171. Hence, with an increase in the body surface area, there will be an increase in the urine total proteins by 0.171. Table 4 shows the bands of body surface area of sample newborns and their urine microalbumin values distributed according to the body surface area bands.
| BSA | N | MIN UM | AVG UM | MAX UM | Pearson correlation and coefficient (r) |
|---|---|---|---|---|---|
| 0.09-0.12 | 7 | 0.8 | 3.8 | 7 | 0.069 |
| 0.12-0.15 | 5 | 2.1 | 5.9 | 7.6 | |
| 0.15-0.18 | 29 | 0.7 | 4.7 | 8 | |
| 0.18-0.21 | 83 | 0.7 | 4.7 | 12.3 | |
| 0.21-0.24 | 41 | 0.8 | 5.2 | 12 | |
| 0.24-0.27 | 10 | 1.9 | 5 | 8.7 |
Table text extracted from the original PDF; superscript letters are shown inline. The original table image is below.
View original table image
It can be seen that the urine microalbumin was highest in the band group 0.12-0.15 with the average value of 5.9 mg/dl and the minimum and the maximum values in this group being 2.1 mg/dl and 7.6 mg/dl respectively, the number of samples taken in this group was 5.
The minimum value of urine microalbumin was seen in the other band group 0.09-0.12 with urine total protein value 3.8 mg/dl. The average values of urine microalbumin at band groups 0.15 -0.18, 0.18-0.21, 0.21-0.24, 0.24-0.27 were 4.7 mg/dl, 4.7 mg/dl, 5.2 mg/dl, 5 mg/dl respectively. Figure 4 shows the relationship between the urine microalbumin value of newborns with their body surface area at 24 hours of life. It was found that urine microalbumin has a positive correlation with the body surface area of the newborns as the Pearson coefficient for the same is 0.069. Therefore, with the increase in the body surface area, there will be an increase in the urine microalbumin by 0.069.
Discussion
The presence of pathological proteinuria and albuminuria raises high suspicion of renal parenchyma involvement like glomerulopathy and/or renal failure [2] . Renal pathologies leading to proteinuria and albuminuria are quite rare in neonates which gives a false impression that neonatal urine did not contain any protein or albumin. On the contrary, there are various studies such as in 2015 Chahrazed E.H, Theirry. C, Severine. T et al [3] . conducted a study in France to update the normal upper values of the urinary total protein-to-creatinine and albumin-to-creatinine ratios in term newborns. They concluded that the upper-limit values for the total protein-to-creatinine ratio were 1431 on day 0-1 and 1205 mg/g (162 and 136 g/mol) on days 3-4 and those for the albumin-to-creatinine ratio were 746 and 301 mg/g (84 and 34 g/mol), respectively, which indicate that neonatal urine contains higher amounts of protein than expected due to immaturity of nephrons in neonatal kidneys. Classically, values of urine protein are determined in a timed urine sample, but more recently, urine total protein or albumin to creatinine ratios have been developed for this purpose. In adults and children, normal values of urine protein, urine albumin and their ratios to creatinine are very well established [4,5] , but these values cannot be applied to the neonatal population due to various differentiating features of this group like physiological immaturity of renal tubules [6,7] . In the present study, we observed that there was a linear and directly proportional relationship gestational age and urine total protein in spot sample as can be seen from Fig 1.
Similarly, the rise in absolute value of urine microalbumin in spot urine sample was also linear and directly proportional to the gestational age, but the proportional rise in urine microalbumin was less as compared to urine total proteins which can be seen through their correlation coefficient (r) values which were 0.237 and 0.040 for urine total proteins and urine microalbumin respectively. This means that rise in spot sample of urine total protein will be 0.237 times in comparison to 0.040 times in urine microalbumin along with the increase in the gestational age. Similarly, urine total protein and urine microalbumin also had a linear relationship with the body surface area of newborns as seen in the above results. When we consider absolute values of urine total protein or urine microalbumin, the urine microalbumin values are on an average 25% of the urine total protein content of urine at all gestational ages and body surface are bands of newborns. Thus, the majority of proteins in neonatal urine is tubular protein.
Conclusion
We conclude that all newborns have abnormally high proteinuria at all gestational ages, which increases with an increase in gestational age. Urine microalbumin also showed a very mild increase with age, but it was very insignificant in comparison to UTP. This indicates, renal tubular immaturity is much more significant than glomerular immaturity and is predominantly at all gestational ages. We further tried to find the relationship between BSA and UTP, UM and evaluated their correlations. We found that all forms of proteinuria (UTP, UM) had a linear relationship with BSA and there was a positive correlation with all of them with a Pearson correlation coefficient (r) being between 0.171 and 0.069 respectively. This finding is in line with that of our correlation analysis of these variables with gestational age. Thus, though tubular proteins are major constituents of urine proteins in neonatal urine, but a small amount of albumin is also lost in the urine and their amounts increase linearly and proportionately as gestational age and body surface area of newborn increases. Further large studies are needed to establish the normal range of acceptable proteinuria and albuminuria in neonates so that these reference values can be used for assessing the onset of kidney injury in the neonatal period.
Figures and tables from the paper
| Gestational age (days) | N | MIN UTP | AVG UTP | MAX UTP | Pearson correlation and coefficient (r) |
|---|---|---|---|---|---|
| 196 - 210 | 4 | 22 | 20.7 | 26 | 0.237 |
| 210 - 224 | 3 | 18 | 21.6 | 28 | |
| 224 - 238 | 6 | 11 | 19.6 | 29 | |
| 238 - 252 | 13 | 19 | 23.4 | 30 | |
| 252 - 266 | 39 | 5 | 23.7 | 30 | |
| 266 - 280 | 77 | 13 | 24.8 | 56 | |
| > 280 | 33 | 19 | 26.7 | 50.3 |
Table text extracted from the original PDF; superscript letters are shown inline. The original table image is below.
View original table image
| Gestational age (days) | N | MIN UM | AVG UM | MAX UM | Pearson correlation and coefficient (r) |
|---|---|---|---|---|---|
| 196 - 210 | 4 | 3.1 | 5.8 | 6.8 | 0.040 |
| 210 - 224 | 3 | 1 | 1.7 | 2.1 | |
| 224 - 238 | 6 | 0.7 | 4.55 | 7.6 | |
| 238 - 252 | 13 | 1.4 | 5.2 | 7.9 | |
| 252 - 266 | 39 | 0.7 | 4.5 | 8.9 | |
| 266 - 280 | 77 | 0.8 | 5.1 | 12.3 | |
| > 280 | 33 | 0.9 | 4.8 | 12 |
Table text extracted from the original PDF; superscript letters are shown inline. The original table image is below.
View original table image
| BSA | N | MIN UTP | AVG UTP | MAX UTP | Pearson correlation and coefficient (r) |
|---|---|---|---|---|---|
| 0.09-0.12 | 7 | 11 | 19 | 26 | 0.171 |
| 0.12-0.15 | 5 | 11 | 21.6 | 28 | |
| 0.15-0.18 | 29 | 18 | 24 | 30 | |
| 0.18-0.21 | 83 | 5 | 25 | 56 | |
| 0.21-0.24 | 41 | 15 | 25.1 | 50.3 | |
| 0.24-0.27 | 10 | 20 | 24.2 | 28 |
Table text extracted from the original PDF; superscript letters are shown inline. The original table image is below.
View original table image
| — | — | UTP | UM |
|---|---|---|---|
| Gestation | Pearson Correlation | .237** | .040 |
| BSA | Pearson Correlation | .171* | .069 |
Table text extracted from the original PDF; superscript letters are shown inline. The original table image is below.
View original table image
References
7 in the original paper- Mahmoud LA. Evaluating proteinuria in children. American Family Physician. 1998;58(5):1145-52.
- Borsook H, Dubnoff JW. The hydrolysis of phosphocreatine and the origin of urinary creatinine. Journal of Biological Chemistry. 1947;168(2):493-510.
- Chahrazed EH, Séverine TC. Normal values of urine total proteins-and-albumin to creatinine ratio in term newborns. Pediatric Nephrology. 2017;32(1):113-118.
- Hogg RJ, Furth S, Lemley KV, Portman R, Schwartz GJ, Coresh J, et al. National kidney foundations kidney disease outcomes quality initiative clinical practical guidelines for chronic kidney disease in children and adolescents: Evaluation, classification and stratification. Pediatrics. 2003;111(1):1416-21.
- Levey AS, Coresh J, Balk E, Kausz AT, Levin A, Steffes MW, et al. National kidney foundation practice guidelines for chronic kidney disease: Evaluation, classification, and stratification. Annals of Internal Medicine. 2003;139(2):137-47.
- Galaske RG. Renal function maturation: Renal handling of proteins by mature and immature newborns. European Journal of Pediatrics. 1986;145(5):368-71.
- Hua MJ, Kun HY, Jie CS, Yun NZ, De WQ, Yang Z. Urinary microalbumin and retinol-binding protein assay for verifying children's nephron development and maturation. Clinica Chimica Acta. 1997;264(1):127132.