
Research article · 2021 · Full text
International Journal of Veterinary Sciences and Animal HusbandryPerformance of broiler chicken fed different commercial feeds, in Mubi, Adamawa state Nigeria
Volume 6(6) · Pages 01–04 · DOI: 10.22271/veterinary.2021.v6.i6a.385 ↗
Research areasLivestock and Poultry ManagementRabbits: Nutrition, Reproduction, HealthAnimal Nutrition and Physiology
Abstract
Author-writtenThe study was conducted to investigate the performance of broiler chicken fed different commercial feeds at livestock farm Federal Polytechnic Mubi. Three different commercial poultry feeds (T1, T2 and T3) and 51 broiler chicks were used in a complete randomized design with three treatments replicated three times. Daily feed intake (DFI) was significantly different between the treatments (P
Summary
Source-checkedPlain-language reading of the full paper, prepared with AI and checked against the text. Each point links to the authors' own words.
Why it matters
- Standard nutrition in poultry feeds is essential for successful farming, as well-fed birds are more resistant to disease and more productive. View evidence ↗
- Feeding costs can account for at least 70% of livestock production costs, making the choice of feed critical for maximizing profit. View evidence ↗
- Commercial feeds often vary in their ingredient mixtures, which leads to differences in quality among the products sold in the market. View evidence ↗
The question
- The study aimed to investigate how different commercial feeds affect the performance of broiler chickens at the Federal Polytechnic Mubi livestock farm. View evidence ↗
What they did
- The researchers used 51 broiler chicks and three different commercial feeds (T1, T2, and T3) in a completely randomized design with three replicates per treatment. View evidence ↗
- Data were analyzed using analysis of variance (ANOVA) with a significance level of P<0.05 via the Statistical Package for Scientist and Engineers (SPSE). View evidence ↗
What they found
- During the starter phase, daily feed intake differed significantly (P<0.05), with T1 (59.92g), T2 (59.89g), and T3 (59.04g). View evidence ↗
- Final live weight at the end of the starter phase was significantly higher for T2 (979.56g) and T1 (966.86g) compared to T3 (839.50g). View evidence ↗
- In the finisher phase, there were no significant differences in feed intake between the three treatment groups. View evidence ↗
- Breast meat weight was significantly highest in T1 (794.71g), followed by T2 (695.72g) and T3 (463.14g). View evidence ↗
- Thigh weight showed significant differences, with T1 (366.0g) and T2 (342.08kg) being higher than T3 (206.42g). View evidence ↗
What it means
- The authors concluded that commercial feeds T1 and T2 significantly improved the growth performance of broiler chickens compared to T3. View evidence ↗
- The authors recommend that farmers use T2 feed during the starter phase and T1 feed during the finisher phase to achieve optimal synergistic growth. View evidence ↗
Visual summary
2 visualsIllustrations explain the paper; charts are replotted from the paper's own table values.
Recommended Feeding Strategy
AI-generated conceptual illustration (broiler chickens). It explains the idea and does not show study data.
View source evidence ↗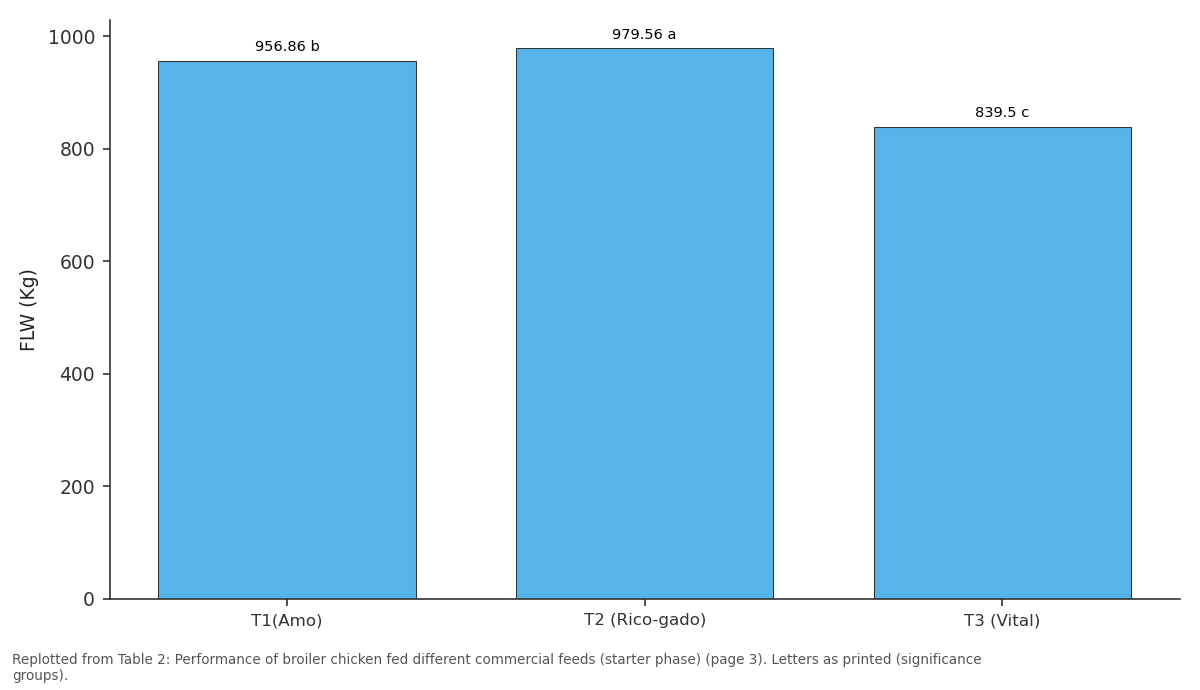
FLW (Kg): T1(Amo) vs T2 (Rico-gado) vs T3 (Vital)
Replotted from Table 2 (page 3) of the original paper. Every bar is the paper's own table value.
View source evidence ↗Figures & tables
From the original paper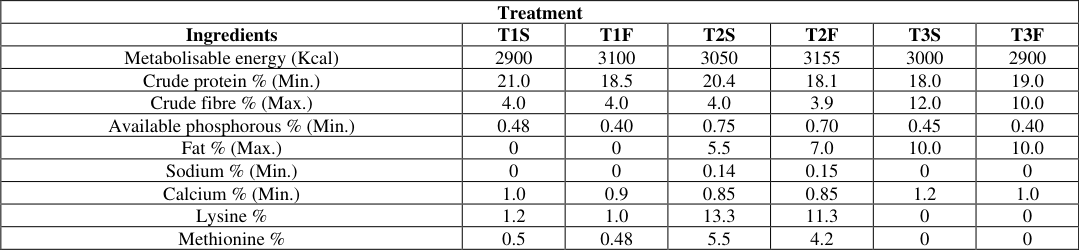 Table 1
 Table 2
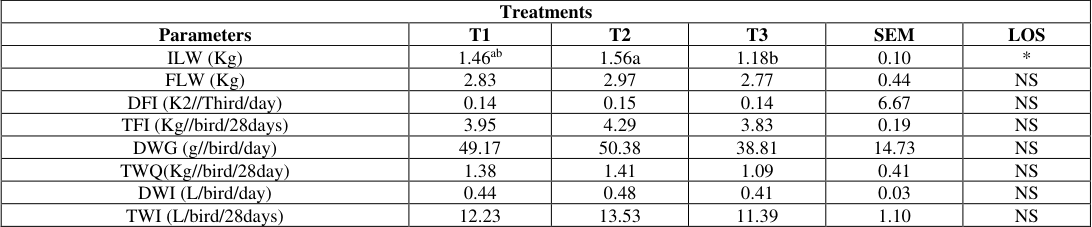 Table 3
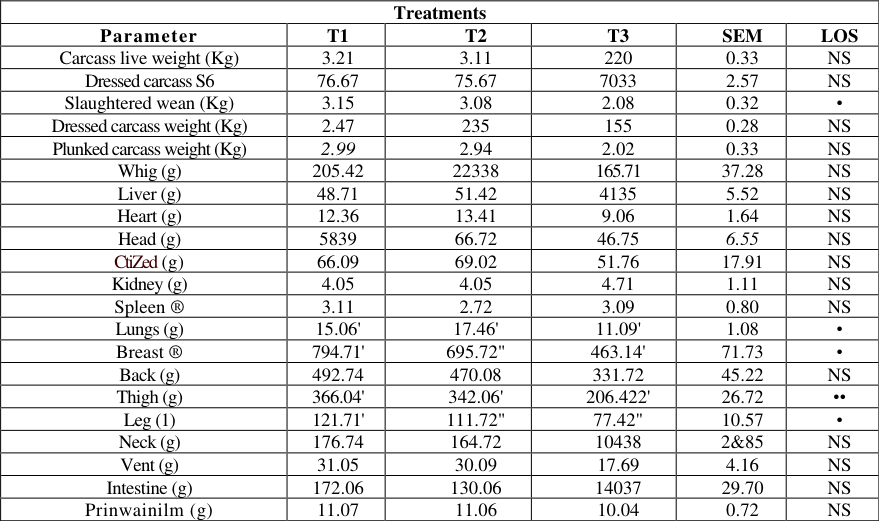 Table 4
Introduction
The objective of the poultry nutrition is to minimize or maximize the cost of production if diets are formulated to provide specific level of nutrition that are needed for optimum performance. The proper standard nutrition for poultry feeds is a very important basic pre requisite for successful poultry farming. Well-fed birds are not only more resistant to disease but also produce better. Therefore for maximum efficiency in growth and production, it is necessary to provide a ration properly balanced for poultry (Oyewole 2014) [12] . The main production criteria looked into is feed intake, feed conversion ratio, growth rate in form of daily weight gain and the total weight gain, health of the birds and their body confirmation. Jain (1996) [5] reported that the major determinants of these criteria are the energy protein and amino acids content of the diets for broilers in addition to high metabolizable energy generally not be less than 2.2mg/k. Kekeocha, (1984) reported that feeds and feeding accounts for not less than 70% of the cost of production in livestock enterprises, therefore there is the need to focus on different feed utilization, in other to maximize profits and avoids losses. Giving the increasing number of people venturing into poultry business, there is no doubt that there is a high demand commercial feeds. Ordinarily, it appears that the poultry feeds are similar in composition and as such will meet the nutrient requirement of all birds, however the feed offered to birds contains varied mixture ingredients causing differences in the quality of the manufactured feeds sold. In the market it is important therefore, to ensure that quality commercial feed with appropriate nutritional value capable of achieving efficient production performance are patronized by the farmers. This research is to investigate the performance of broiler feed in different commercial feeds compared with other research findings of Leeson and Caston, (2003) [8] , and also proffer solutions to some problems affecting performance of broiler as reported by Obioha, (1992) [9] . Therefore, the result of this research would enable poultry farmers to understand the need to feed broilers with different commercial feeds, so as to obtain desired performance and maximise profit.
Materials and Method Materials
The materials used during the research include: Feeders, drinkers, lanterns, charcoal and charcoal stove, disinfectants (izal and chlorhexidine), broom, packer, slippers, detergents, wood shavings and buckets. Other materials include weighing scale, brooding paper, eucalyptus wood, nails, wire mesh, thermometer, measuring cylinder, 3 different feeds and 51 day old chicks.
Experimental Design
The study was conducted at the teaching and research farm Federal Polytechnic Mubi, located within Mubi town, Mubi North Local Government of Adamawa State, North Eastern region of Nigeria. Fifty one (51) day old broiler chicks obtained from Zartech farm Jos Plateau State were used. The birds were weighed at the beginning of the experiment and randomly assigned to three dietary treatments with each treatment having 17 birds at the starter phase. The chicks were brooded conventionally in a deep litter concrete floor pen locally partitioned into 3 pens using eucalyptus wood. The birds were vaccinated with Newcatle disease vaccine (Lasota) and Infectious bursal disease vaccine (Gumboro) 1st and 2nd doses respectively. The sanitary and hygienic measures were strictly adhered to and the room temperature was monitored using thermometer. The birds were kept for 28 days in the brooding pen (starter phase) after which they were transferred to a concrete pen where each treatment was replicated three times and were kept for another 28 days (finisher phase) thereafter the research was terminated. Three different commercial feeds (T1, T2 and T3) were purchased from the market; they were made up of starter (37.5kg each) and finisher (62.5kg each) which were given to the birds. The feeds were weighed using weighing scale before given to the birds and the left-over was collected and also weighed the next day to determine the daily feed intake. Water was also measured in a measuring cylinder before administering it in a drinker and the left-over was measured to determine the daily water intake. The daily weight gain was determined by weighing the birds on weekly basis using the weighing scale.
Data Collection and Statistical Analysis
The data were collected on different parameters at the starter and finisher phases and at the carcass evaluation, which include: initial weight, final live weight, daily feed intake, total feed intake, daily water intake, total water intake, daily weight gain, total weight gain, mortality rate, dressing carcass percentage, plunked carcass weight, dressed carcass weight, slaughtered weight, and organs' weight. The data generated from the research was subjected to statistical analysis using analysis of variance (ANOVA) to determine the level of significance at P<0.05 level, according to Statistical Package for Scientist and Engineers (SPSE).
Results and Discussion
Performance of broiler chicken fed different commercial feeds (starter phase): Table 2 shows the performance of broiler chicken fed three different commercial feeds, T1, T2 and T3 feed at the starter phase. The daily feed intake (DFI) was significant (P<0.05) between the treatment with T1 having 59.92g, T2 59.89g and T3 having 59.04g but the total feed intake (TFI) was not significant between the treatments. The result partially agreed with the findings of Addass, et al., (2010) [1] research, who assessed some common commercial poultry feeds in broiler performance in Mubi, Adamawa State, his result shows significant difference in feed intake on four different commercial feeds on broilers performance. The significant daily feed intake recorded in treatment T 2 might be an indication of daily growth palatability, acceptability of the feed and the low crude fibre level inclusion in the feed. The development of the birds appears to be synonymous to palatability and acceptability of the feed which agrees with the findings of Sizemore and Sieze, (1993) [13] , and Whitehead, (2002) [15] , who reported that well fed broiler with various feeds, tend to grow on the daily basis except when there is sign of ill-health. The daily weight gain (DWG) was highly significant (P<0.05) with T1 and T2 been similar (32.43g and 32.92g/bird/day respectively) while T3 was slightly lower with 28.24/bird/day. The total weight gain (TWG) was also highly significant between the three treatment with T2 having the highest total weight gain of 93.100g/bird/28 days and T1 was second with 902.15g/bird/28 days while T3 was less with 790.77g/bird/28 days. The significant daily weight gain (DWG) and the total weight gain (TWG) was evident on treatment T2 and T1 but less evident on treatment T3 which might be the respond to high crude protein level inclusion at the starter level in the three feeds as shown in 1. There is a possibility that the final live weight (FLW) observed is as a result of the feed intake which influences the trend in weight gain as reported by Oyewole et al., (2014) [12] , and Edd (2015) [3] , in their research on performance of broiler fed compounded feeds. The result also agreed with Kaur et al., (2013) [6] , who reported that palatable feed and its consumption will produce significantly higher body weight. The initial live weight (ILW) was not significance among the treatment but the final live weight (FLW) was highly significance with T2 having 979.56g, followed by T1 with 966.86g while T3 recorded 839.50g. The mortality recorded in this study was not significant.
| Treatments | — | — | — | — | — |
|---|---|---|---|---|---|
| Parameters | T1(Amo) | T2 (Rico-gado) | T3 (Vital) | SEM | LOS |
| ILW (Kg) | 48.71 | 48.55 | 48.73 | 0.91 | NS |
| FLW (Kg) | 956.86b | 979.56a | 839.50c | 2.58 | *** |
| DFI (g//bird/day) | 59.92a | 59.89ab | 59.04b | 0.24 | |
| TFI (Kg//bird(28day) | 1.68 | 1.68 | 1.65 | 7.2 | NS |
| DWG (g//bird/day) | 32.43a | 32.92a | 7824b | 0.22 | *** |
| TWG (g//bird/28day) | 902.15b | 931.00a | 790.77c | 3.43 | *** |
| MTR | 0.00 | 0.33 | 0.00 | 0.27 | NS |
Table text extracted from the original PDF; superscript letters are shown inline. The original table image is below.
View original table image
Performance of broiler chicken fed different commercial feeds (finisher phase):
Table 3 shows the result of the performance of broiler at the finisher phase. The feed intake recorded at the finisher phase was not significantly different between the treatments, this tend to agree with the findings of Okoli et al., (2007), who reported general improvement in the growth rate of the birds place on commercial feeds which indicate that all the feeds meets the nutrients requirement of the broiler. The ILW was significant; T2 was 1.56 kg, while the FLW was not significant among the treatments. The in-significant mortality rate recorded in this research did not agree with the research findings of Bot et al., (2013), who reported significant mortality across the dietary treatments on the effects of replacing maize with Parkia pulps on growth performance of broilers finisher The DFI as well as TFI where not significantly different between the three treatments, which disagreed with the result of Bot et al., (2013), who reported significant difference in feed intake which resulted to poor feed intake and poor weight gain in broilers at finisher phase fed maize with Parkia pulp. The DWG and TWG where equally not significant among the treatments. The daily water intake (DWI) observed was not significant so also the total water intake (TWI). The slightly low TWI recorded in T3, agrees with the findings of Hocking (2006) who reported that high fibre ration decreases water intake in broilers. 4 shows the carcass evaluation of broiler chicken fed three commercial feeds.
| Treatments | — | — | — | — | — |
|---|---|---|---|---|---|
| Parameters | T1 | T2 | T3 | SEM | LOS |
| ILW (Kg) | 1.46ab | 1.56a | 1.18b | 0.10 | * |
| FLW (Kg) | 2.83 | 2.97 | 2.77 | 0.44 | NS |
| DFI (K2//Third/day) | 0.14 | 0.15 | 0.14 | 6.67 | NS |
| TFI (Kg//bird/28days) | 3.95 | 4.29 | 3.83 | 0.19 | NS |
| DWG (g//bird/day) | 49.17 | 50.38 | 38.81 | 14.73 | NS |
| TWQ(Kg//bird/28day) | 1.38 | 1.41 | 1.09 | 0.41 | NS |
| DWI (L/bird/day) | 0.44 | 0.48 | 0.41 | 0.03 | NS |
| TWI (L/bird/28days) | 12.23 | 13.53 | 11.39 | 1.10 | NS |
Table text extracted from the original PDF; superscript letters are shown inline. The original table image is below.
View original table image
Carcass evaluation of broiler chicken fed different commercial feeds: Table
The carcass analysis of the broilers at 56 day, indicates that the slaughtered weight was significant (P<0.05) with T1 having 3.15kg, T2 had 3.08kg while T3 recorded less with 2.098kg. The carcass live weight, dressing carcass percentage, dressed carcass weight and plunked carcass weight were not significant between all treatments. The evaluation of the organ shows that thigh was highly significant between the treatment with T1 366.0g, T2 342.08kg while T3 206.42g. The lungs were also significant with 11.0g. The breast meat was recorded highest in T 1 with 794.71g followed by T 2 695.72g while T 3 recorded 463.14g. Leg was also significant between the treatments with 111.72g while T 3 recorded lowest with 77.42g. The organ such as liver, heart, head, back, neck, gizzard, kidney, spleen, vent and intestines were not all significant between the treatments. The findings of this study on carcass evaluation as shown on table 4 indicate that the slaughtering weight observed, shows significant difference between the treatments which shows that there might be improved weight gain with T 1 followed by T 2 due to high metabolisable energy included in the feed compared to the non-significant difference recorded in carcass live weight, dressing percentage, dressing carcass percentage, and plunked carcass weight between the treatments which is not in agreement with the findings of Oyewole et al., (2013) [13] , who reported significant difference in live weight, carcass weight and dressing percentage in broilers experimental diets at finisher phase. The finding of this study which shows nonsignificant difference in lungs, liver, heart, head, back and neck between the treatments appear to be similar to a report of Oyewole et al., (2014) [14] , who reported differences in liver and heart in his research on response of finishing broilers fed on-farm feed to dietary enzyme and vitamin B supplement. Generally from the carcass evaluation, T1 appears to have higher weight of breast, thigh neck, back and leg, followed by T2 which recorded high weight of lungs, head, heart and liver while T3 recorded least weight on all the carcass parameters.
| Treatments | — | — | — | — | — |
|---|---|---|---|---|---|
| Parameter | T1 | T2 | T3 | SEM | LOS |
| Carcass live weight (Kg) | 3.21 | 3.11 | 220 | 0.33 | NS |
| Dressed carcass S6 | 76.67 | 75.67 | 7033 | 2.57 | NS |
| Slaughtered wean (Kg) | 3.15 | 3.08 | 2.08 | 0.32 | • |
| Dressed carcass weight (Kg) | 2.47 | 235 | 155 | 0.28 | NS |
| Plunked carcass weight (Kg) | 2.99 | 2.94 | 2.02 | 0.33 | NS |
| Whig (g) | 205.42 | 22338 | 165.71 | 37.28 | NS |
| Liver (g) | 48.71 | 51.42 | 4135 | 5.52 | NS |
| Heart (g) | 12.36 | 13.41 | 9.06 | 1.64 | NS |
| Head (g) | 5839 | 66.72 | 46.75 | 6.55 | NS |
| CtiZed (g) | 66.09 | 69.02 | 51.76 | 17.91 | NS |
| Kidney (g) | 4.05 | 4.05 | 4.71 | 1.11 | NS |
| Spleen ® | 3.11 | 2.72 | 3.09 | 0.80 | NS |
| Lungs (g) | 15.06' | 17.46' | 11.09' | 1.08 | • |
| Breast ® | 794.71' | 695.72" | 463.14' | 71.73 | • |
| Back (g) | 492.74 | 470.08 | 331.72 | 45.22 | NS |
| Thigh (g) | 366.04' | 342.06' | 206.422' | 26.72 | •• |
| Leg (1) | 121.71' | 111.72" | 77.42" | 10.57 | • |
| Neck (g) | 176.74 | 164.72 | 10438 | 2&85 | NS |
| Vent (g) | 31.05 | 30.09 | 17.69 | 4.16 | NS |
| Intestine (g) | 172.06 | 130.06 | 14037 | 29.70 | NS |
| Prinwainilm (g) | 11.07 | 11.06 | 10.04 | 0.72 | NS |
Table text extracted from the original PDF; superscript letters are shown inline. The original table image is below.
View original table image
Conclusion
The results obtained from the study revealed that the performance of broiler chicken fed different commercial feeds T1 and T2 significantly improved the growth performance of broilers chickens than T3. Broiler chicken fed T1 feeds showed less fat at slaughter and higher final live weight, which could be due to non-fat inclusion in the dietary ingredients in the feed as compared to T2 and T3 feeds. At the starter phase, T2 recorded better performance than T1 and T3 while at the finisher phase, T1 showed excellent performance than T2 and T3, so if possible farmers should use T2 feed at starter phase and then use T1 feed at finisher phase; this will give a synergistic growth performance which will be the best in broiler production.
Figures and tables from the paper
| Treatment | — | — | — | — | — | — |
|---|---|---|---|---|---|---|
| Ingredients | T1S | T1F | T2S | T2F | T3S | T3F |
| Metabolisable energy (Kcal) | 2900 | 3100 | 3050 | 3155 | 3000 | 2900 |
| Crude protein % (Min.) | 21.0 | 18.5 | 20.4 | 18.1 | 18.0 | 19.0 |
| Crude fibre % (Max.) | 4.0 | 4.0 | 4.0 | 3.9 | 12.0 | 10.0 |
| Available phosphorous % (Min.) | 0.48 | 0.40 | 0.75 | 0.70 | 0.45 | 0.40 |
| Fat % (Max.) | 0 | 0 | 5.5 | 7.0 | 10.0 | 10.0 |
| Sodium % (Min.) | 0 | 0 | 0.14 | 0.15 | 0 | 0 |
| Calcium % (Min.) | 1.0 | 0.9 | 0.85 | 0.85 | 1.2 | 1.0 |
| Lysine % | 1.2 | 1.0 | 13.3 | 11.3 | 0 | 0 |
| Methionine % | 0.5 | 0.48 | 5.5 | 4.2 | 0 | 0 |
Table text extracted from the original PDF; superscript letters are shown inline. The original table image is below.
View original table image
References
14 in the original paper- Addass PA, Elijah A, Midau A, Lawan AU. Assessment of some common commercial poultry feed on broilers performance in Mubi, Adamawa State Nigeria, Global Veterinaria 2010;4(2);160-163.
- Bot MH, Bawa GS, Abeke FO. Replacement of value of maize with African Locus Beans (Parkia bioglobosa) Pulp Meal on performance, Haematological and carcass characteristics of broiler. Nigeria. Anim. Sci 2013;15:5970.
- Edd B. Growth performance of broiler chicken (Gallus demosticus) fed commercial ration supplemented with varying levels of Azolla (Azolla pinnata) meal, Publish Online, 2015.
- Hocking, PM. High-fibre pelleted rations decreases water intake but do not improve the physiological indices of welfare in food restricted female broiler breeders. Bristish poultry Science 2006;47(1):19-23
- Jain NC. Schalm's Veterinary Haematology 4 th Edition, Philadephia. Hea and Tebiger Publisher, 1996, 210-222.
- Kaur D, Sarabiit SN, Sandeep S, Padam ND. Comparative performance of commercial broilers fed herbromethione (R) as a replacement to DL-Methionine in diet: Published Online 16 July 2013.
- Kekeocha AC. Pfizer Poultry Production Handbook, Macmilian Publisher London, 1984.
- Leeson S, Caston LJ. Production and carcass yield of broilers using free-choice cereal feeding. Journal of Applied Poultry Research.2003;2:253-258
- Obioha FC. A Guide to Poultry Production in the Tropics. A One Publishers. Enugu, 1996-92, 67-80.
- Okoli IC, Omede AA, Opara MC, Uchegbu MC, Enemuo V. Biological, physical and performance evaluation of some commercial broiler ration produced in Nigeria; Journal of Agriculture and Social Research (JASR), 2007 7(1).
- Oyewole BO, Oluremi OIA, Aribido SO, Ayoade JA. Productive and haematological performance of growing pullets fed the growth performance fermented sweet orange (Citrus sinensis) fruit peel meal based diet. Inter J Agri Biosci 2013;2(2):68-71, www.ijubio.com
- Oyewole BO, Aribido SO, Amana CO. Comparative performance Feed and haematology of broilers fed commercial feed and on-farm diets supplemented with enzyme or vitamin B. Asian Academic Research Journal of Multidisciplinary 2014;1(18):664-675.
- Sizemore FG, Siege AS. Poultry Science 1993;72:12162228
- Whitehead CC. Nutrition and poultry welfare. World Poultry Journal 2002;58(4):349-355.