
Research article · 2020 · Full text
International Journal of Biology SciencesPhysico-chemical parameter for testing of Hatni river water at Jobat fata dam district–Alirajpur Madhya Pradesh, India
Volume 2(1) · Pages 16–17 · DOI: 10.33545/26649926.2020.v2.i1a.17 ↗
Research areasWater Quality and Pollution Assessment
Abstract
Author-writtenThe jobat Fata dam is situated near Nanpur District Alirajpur. This medium sized dam is mainly constructed for irrigation purpose. It is about 25km away from Dhar District kukshi village and is surrounded by hills, agricultural fields and village Jobat dam. The sample collection, preservation and treatment according to standard method of collecting samples at international level i.e. APHA and BIS procedure. After collecting sample sites water analysis pH, TDS, Turbidity, DO, BOD, COD, Calcium, Chloride, Fluoride and Magnesium parameter were determined for the testing of water quality.
Summary
Source-checkedPlain-language reading of the full paper, prepared with AI and checked against the text. Each point links to the authors' own words.
Why it matters
- Water is a critical natural resource essential for the survival of humans, animals, and plants. View evidence ↗
- Rapid population growth and industrialization are leading to water pollution, which can cause human diseases. View evidence ↗
- Human activities are altering river morphology and contributing to water pollution problems. View evidence ↗
The question
- The study aimed to evaluate how human-induced environmental changes affect water quality by analyzing chemical and microbiological variations at different sites near Waskala village. View evidence ↗
What they did
- Water samples were collected from four distinct locations around the reservoir: the western side (Station I), eastern shore (Station II), northern inlet (Station III), and southern shore (Station IV). View evidence ↗
- The researchers measured several water quality parameters, including pH, Total Dissolved Solids (TDS), Turbidity, Dissolved Oxygen (DO), Biological Oxygen Demand (BOD), Chemical Oxygen Demand (COD), Calcium, Chloride, Fluoride, and Magnesium. View evidence ↗
- Physico-chemical and biological parameters were analyzed following the standard methods suggested by APHA (1976). View evidence ↗
- Temperature, pH, and DO were measured on-site immediately, while all other parameters were analyzed in a lab within 24 hours. View evidence ↗
What they found
- The pH of the water varied by location, reaching a maximum of 8.10 at site I and a minimum of 7.12 at site IV. View evidence ↗
- Dissolved oxygen (DO) levels were highest at site IV (8.2 mg/l) and lowest at site I (6.2 mg/l). View evidence ↗
- Total Dissolved Solids (TDS) ranged from a maximum of 229 mg/l at site I to a minimum of 216 mg/l at site IV. View evidence ↗
- The highest Chemical Oxygen Demand (COD) value of 10.0 mg/lit was observed at the northern side of the reservoir (site III). View evidence ↗
- The lowest Biological Oxygen Demand (BOD) value of 4.2 ppm was recorded at site III. View evidence ↗
- Fluoride levels remained constant at 0.3 mg/l across all four sampling sites. View evidence ↗
What it means
- The authors conclude that the water contains high values of chloride, total hardness, alkalinity, COD, DO, and calcium. View evidence ↗
Visual summary
3 visualsIllustrations explain the paper; charts are replotted from the paper's own table values.

Sampling Site Map
AI-generated conceptual illustration (Hatni river reservoir and irrigation canal). It explains the idea and does not show study data.
View source evidence ↗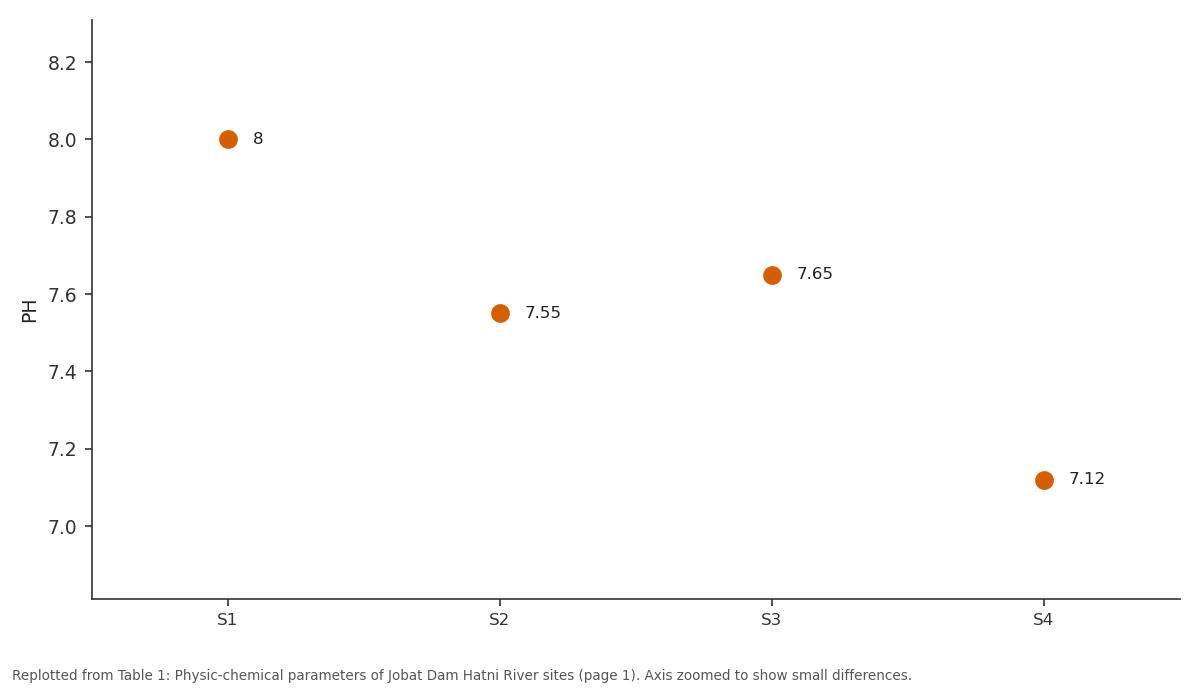
PH: S1 vs S2 vs S3 vs S4
Replotted from Table 1 (page 1) of the original paper. Every bar is the paper's own table value.
View source evidence ↗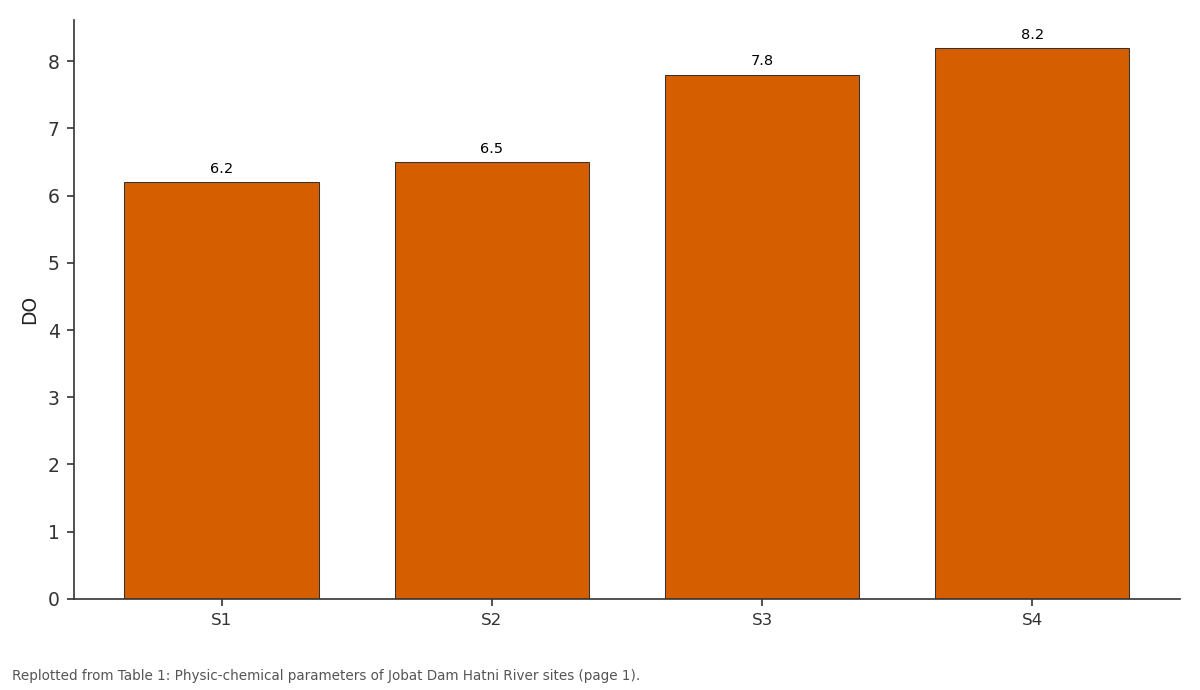
DO: S1 vs S2 vs S3 vs S4
Replotted from Table 1 (page 1) of the original paper. Every bar is the paper's own table value.
View source evidence ↗Figures & tables
From the original paper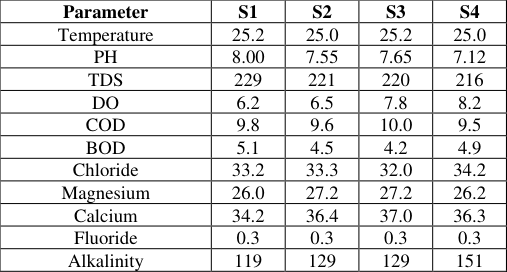 Table 1
Result
The result of various physic-chemical parameters for the calculation of water quality index is presented in table 1. Table 1: Physic-chemical parameters of Jobat Dam Hatni River sites water sample Parameter S1 S2 S3 S4 Temperature 25.2 25.0 25.2 25.0 PH 8.00 7.55 7.65 7.12 TDS 229 221 220 216 DO 6.2 6.5 7.8 8.2 COD 9.8 9.6 10.0 9.5 BOD 5.1 4.5 4.2 4.9 Chloride 33.2 33.3 32.0 34.2 Magnesium 26.0 27.2 27.2 26.2 Calcium 34.2 36.4 37.0 36.3 Fluoride 0.3 0.3 0.3 0.3 Alkalinity 119 129 129 151
| Parameter | S1 | S2 | S3 | S4 |
|---|---|---|---|---|
| Temperature | 25.2 | 25.0 | 25.2 | 25.0 |
| PH | 8.00 | 7.55 | 7.65 | 7.12 |
| TDS | 229 | 221 | 220 | 216 |
| DO | 6.2 | 6.5 | 7.8 | 8.2 |
| COD | 9.8 | 9.6 | 10.0 | 9.5 |
| BOD | 5.1 | 4.5 | 4.2 | 4.9 |
| Chloride | 33.2 | 33.3 | 32.0 | 34.2 |
| Magnesium | 26.0 | 27.2 | 27.2 | 26.2 |
| Calcium | 34.2 | 36.4 | 37.0 | 36.3 |
| Fluoride | 0.3 | 0.3 | 0.3 | 0.3 |
| Alkalinity | 119 | 129 | 129 | 151 |
Table text extracted from the original PDF; superscript letters are shown inline. The original table image is below.
View original table image
Introduction
Water is life. No life can exist without water. Water is absolutely essential not only for survival of human beings, but also for animals, plant and all other living beings. It has many beneficial uses such as drinking, irrigation, navigation, propagation of wild life, fisheries; aesthetic etc. water is the most valuable nature resources.
It is the essential for health society and sustainable development. Water, the matrix of life is exposing to pollution, unhealthy environment, resulting in human affliction and diseases transmission due to rapid industrialization and population. The Shahid Chandar Shekhar Azad sagar (Jobat) project in Madhya Pradesh is irrigation project investing construction of a 38.60 m high and 462.50 m long composite gravity dam across the river hatni, a tributary of river Narmada, which is near village waskala,24 km form kukshi town. Water is scarce and valuable resource and it is highly essential for the survival of mankind. man mad activities are changing the morphology of the area of the river regimes and causing problem of pollution of water.
The present study has been carried out evolution the impact of man induced environmental changes on the water quality through variation in the chemical and microbiological properties at different location of sites of waskala village.
Material And Methods
The River Dam has been surveyed through in out the year. Four sampling sites were selected dame, one sampling site Station I: Western side of the reservoir village umdha. Station II Eastern shore of the reservoir and canal constriction in use for irrigation. Station III: Northern side of the reservoir.
It is a inlet of water collected the rainwater from a big area. Station IV: Southern shore of the reservoir. This area is wall and deep area. The various physic-chemical and biological parameters were determined as per methods suggested APHA (1976).
High values of COD 10.0 mg/lit have been observed at the site of Northern side of the reservoir. Low BOD value 4.2ppm is recorded at iii rd site of Dam. The pH was maximum (8.10) in at site I. Higher concentration of calcium in water may also increase pH.
The pH was recorded to be minimum (7.12) in at site IV. The dissolved oxygen found maximum was (8.2 mg/l) at site Iv which gradually reduced from middle of summer season and was recorded to be minimum (6.2 mg/l) at site I. TDS In the present study the maximum value of TDS was found (229 mg/l) at site I and minimum value of TDS was (216 mg/l) at site IV. Fluoride in water was remain constant (0.3 mg/l) at all the four sampling sites.
Chloride present study was recorded to minimum 32.0Mg/l at iii site and maximum 16 34.3 at site IV. Transparency is low during the monsoon season due to heavy load of suspended particle and maximum in winter due to less activity.
Discussion
Several physic-chemical and biological parameters and their variability have been studied in relation to the site of dam river water. The chemical analysis showed that site contained high values of chloride, total hardness, Alkalinity, COD, DO, chloride, calcium etc. which indicates of water.
Acknowledgement
I am also thankful to Dr. Shail Joshi, Prof. & Head of Zoology for her generous help during the research work.
References
12 in the original paper- Anita G, Chandrsekhsr SVA, Kodarkarm MS. Limnology studies on Mir Alam Lake. Hyderabad. poll. Res. 2005; (3):681-687.
- Rao AV, Jain BL, Gupta IC, Indian Jour. Environ. Hlth, 1993, 35-132.
- APHA. Stander Method for Examination of water and wastewater, 20th edition American Public Helth Association Washington D.C, 1985.
- Dixit1 AK, Pandey S K, Mehta R, Niyaz Ahmad, Gunjan, Jyoti Pandey, et al. Study of physico-chemical parameters of different pond water of Bilaspur District, Chhattisgarh, India. Environmental Skeptics and Critics. 2015; 4(3):89- 95.
- Gohram. the Chemical composition of Some Waters from Dune slacks at Sadscale, North Lancashire, J. Ecol, 1961; 49(1):79-82.
- Jawale AK, Patil SA. Physic-chemical characteristic and phytoplanktons abundance of Mangrul Dam dist-Jalgon, Maharasthra. J Aqua Biol. 2009; 24(1):7-12.
- Kataria HC, Gupta MK, Kushwaha S, Kashyap S, Trivedi S, Bhadoriya R et al. Study of physico-chemical parameters of drinking water of Bhopal city with Reference to Health Impacts. Current World Environment. 2011; 6(1):95-99
- Mahajan A, Tank SK. studies on the physic-chemical parameters of water body Dara, Maharastra, India. International of Innovation Research and development. 2013; 2(3):751-759
- Narayan, Puttaiah JET, Basavaraja D. Water quality characteristic of anjanapura Reservoir near shikarpur dist. shimog, Karnataka J Aqua, Biol. 2008; 23(1):59-63.
- Raut KS, Shinde SE, Pathan TS, Sonawane DL. Seasonal variations in physico-chemical characteristics of Peth Lake at Ambajogai district, Beed Marathwada Region, India. Journal of Research in Biology. 2011; 1(4):258- 262.
- Sing RP, Mathur P. Investingation of Variation in physic- chemical characteristics of a fresh water reservoir of Ajmer city Rajasthan Ind. J Env Sci. 2005; 9:57:61.
- Virendra Kumar, Verma SR. Survey of Yamuna River and a few related drains with reference to Physico- chemical and biological characteristics. Ph.D. Thesis. Meerut Uni. Muzaffarpur, 1980. 13. 17 Mehkri S, Perez D, Najarro P, Tsapekos M, Bopanna KN. Effect of Lutein (Lute-gen®) on proliferation rate and telomere length in vitro and possible mechanism of action. Int J Biol Res. 2019;4(4):84-91.
Cited by 3
From OpenAlex, OpenCitations and reference lists read by Scinovex
- Physicochemical characteristics of soils used as temporary waste dumpsites in Rukpokwu, Obio/Akpor, Port Harcourt, rivers state, Nigeria
Enize Simeon Edori, E Okporo, Chidiebere Ucheaga · International Journal of Advanced Chemistry Research · 2022
The level of physicochemical properties in temporary dumpsites in Rukpokwu, Obio/Akpor, Port Harcourt, Rivers State, Nigeria was assessed. The physicochemical parameters were analyzed using standard conventional procedures. The average range of values recorded for the physicochemical parameters within the stations for the period of investigation were pH; 5.49±0.11-5.66±0.25, electrical conductivity; 88.67±11.44-90.33±12.23 µs/cm, particle size analysis were silt, 8±1.60-12.001.40%, sand; 80.00±0.82-82.67±0.47%, and clay, 6±0.81-8.33±0.47%, with a textural class ranging from loamy soil to loamy
- Effect of growth promoter on morpho-physiological, biochemical parameters and essential oil yield of mentha (Mentha arvensis L.)
Arun Gangey, Dharmendra Khokhar · International Journal of Agriculture and Nutrition · 2023
A field experiment entitled “Effect of growth promoter on morpho-physiological, biochemical parameters and essential oil yield of mentha (Mentha arvensis L.)” The field experiment was carried out at Department of Plant Physiology, Agriculture Biochemistry and Medicinal and Aromatic Plants and Instructional Herbal Garden, IGKV, Raipur (C.G.) in Mentha arvensis L. during the Rabi season of 2020-21. Randomized block design (RBD) was used to conduct the experiment with three replications. There were 10 treatments T1 (Control, Water Spray), T2 (IAA @ 50 ppm), T3 (IAA @ 70 ppm), T4 (IAA @ 90 ppm), T
- Physicochemical and sensory quality evaluation of dried noodles from Chinese market based on principal component analysis and cluster analysis
Siran Zhang · International Journal of Agriculture and Food Science · 2023
In order to explore the quality diversity of different dried noodle products in Chinese market and construct an evaluation model, this study investigated physicochemical and sensory properties of nine commercially dried noodles, after which principal component analysis (PCA) and cluster analysis were applied to investigate interrelations and differences of various noodle samples, and sensory parameters of noodles were evaluated in addition. Results of physicochemical parameters of each sample, including moisture content (64.08~70.20%), protein content (0.139~0.607 g/100 g), elongation (13.78~3