
Research article · 2020 · Full text
International Journal of Advanced Chemistry ResearchEffects of urea, potassium sulphate and super phosphate on the growth performance of wheat (Triticum Aestivum) at Shahdol district (MP)
Volume 2(1) · Pages 23–27 · DOI: 10.33545/26646781.2020.v2.i1a.20 ↗
Research areasAgricultural Science and FertilizationCrop Yield and Soil FertilityRice Cultivation and Yield Improvement
Abstract
Author-writtenThe study was carried out in Shahdol (M.P.). Soil samples were collected from six locations within Shahdol (M.P.) namely Burhar, Jaitpur, Shahdol, Gohparu, Jaisinghnagar and Beohari. The experiment it is clear that in experimental sets with 0.2% of urea, potassium sulphate and super phosphate the average height of plant species Triticum aestivum increased as compared to their control sets but in another sets with 0.4% to 0.6% urea the average height of the plants was found to have decreased. The potassium sulphate was not effective but super phosphate shows earlier good results.
Summary
Source-checkedPlain-language reading of the full paper, prepared with AI and checked against the text. Each point links to the authors' own words.
Why it matters
- Wheat is a critical global food grain and a primary source of nutrition for millions of people. View evidence ↗
- Low wheat yields are a significant concern due to the rapidly increasing global population. View evidence ↗
- While fertilizers can increase productivity, they may cause environmental issues like eutrophication, increased soil acidity, and negative impacts on soil biology. View evidence ↗
The question
- The study aimed to determine how NPK fertilizers affect the germination and early seedling growth of wheat. View evidence ↗
What they did
- The research was conducted in the Shahdol district of Madhya Pradesh, using soil samples from six specific locations: Burhar, Jaitpur, Shahdol, Gohparu, Jaisinghnagar, and Beohari. View evidence ↗
- The study measured growth performance and biochemical components, including sugar, non-sugar, protein, fats, and chlorophyll (Chl a and Chl b). View evidence ↗
What they found
- A 0.2% concentration of urea, potassium sulphate, and super phosphate increased average plant height compared to controls, but urea concentrations of 0.4% to 0.6% led to a decrease in height. View evidence ↗
- In 10-day-old plants, 0.2% urea increased sugar (3.32 mg vs 2.83 mg), non-sugar (5.64 mg vs 4.5 mg), and protein (4.50 mg vs 4.40 mg) compared to the control. View evidence ↗
- Super phosphate (0.2% to 0.6%) generally increased sugar, non-sugar, and protein levels compared to the control (3.00 mg, 7.80 mg, and 4.44 mg respectively). View evidence ↗
- For potassium sulphate, increasing the concentration from 0.2% to 0.6% resulted in a decrease across all measured biochemical values, including sugar (3.00 to 2.87 mg) and chlorophyll a (360 to 352 mg). View evidence ↗
- In 30-day-old plants, 0.2% and 0.4% urea increased sugar (3.65 mg vs 3.00 mg) and protein (4.56 mg vs 4.48 mg) relative to the control. View evidence ↗
- When urea concentration reached 0.6%, there was a decrease in sugar, non-sugar, protein, fat, and both types of chlorophyll. View evidence ↗
What it means
- The authors conclude that reductions in plant growth may be caused by high salt concentrations around the roots, which hinder the plant's ability to absorb water. View evidence ↗
- High salt concentrations are believed to lower the osmotic potential of the cell sap, maintaining a low cell water potential. View evidence ↗
Visual summary
3 visualsIllustrations explain the paper; charts are replotted from the paper's own table values.
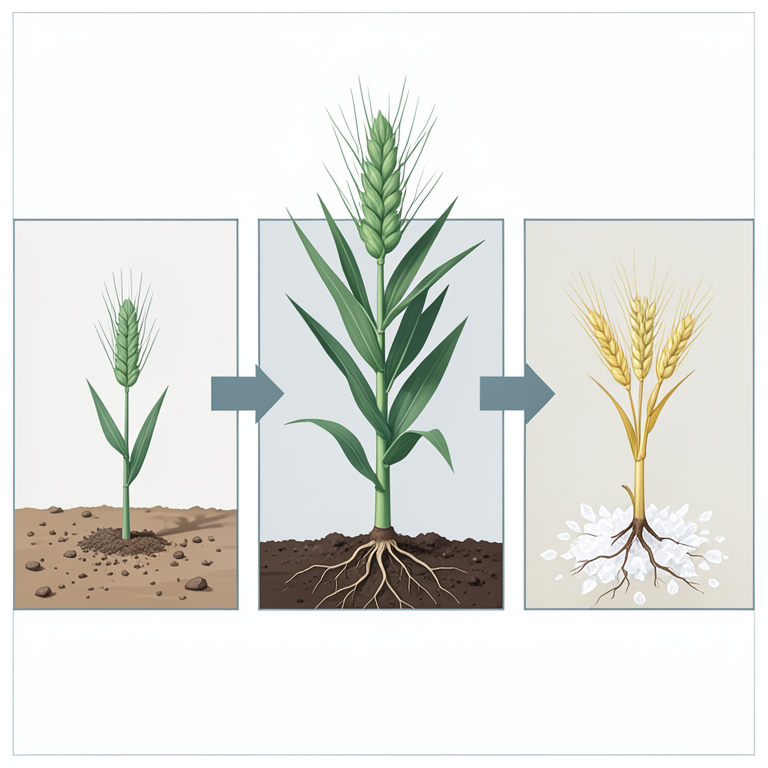
Dose-Response Effect of Fertilizers
AI-generated conceptual illustration (wheat plants (Triticum Aestivum)). It explains the idea and does not show study data.
View source evidence ↗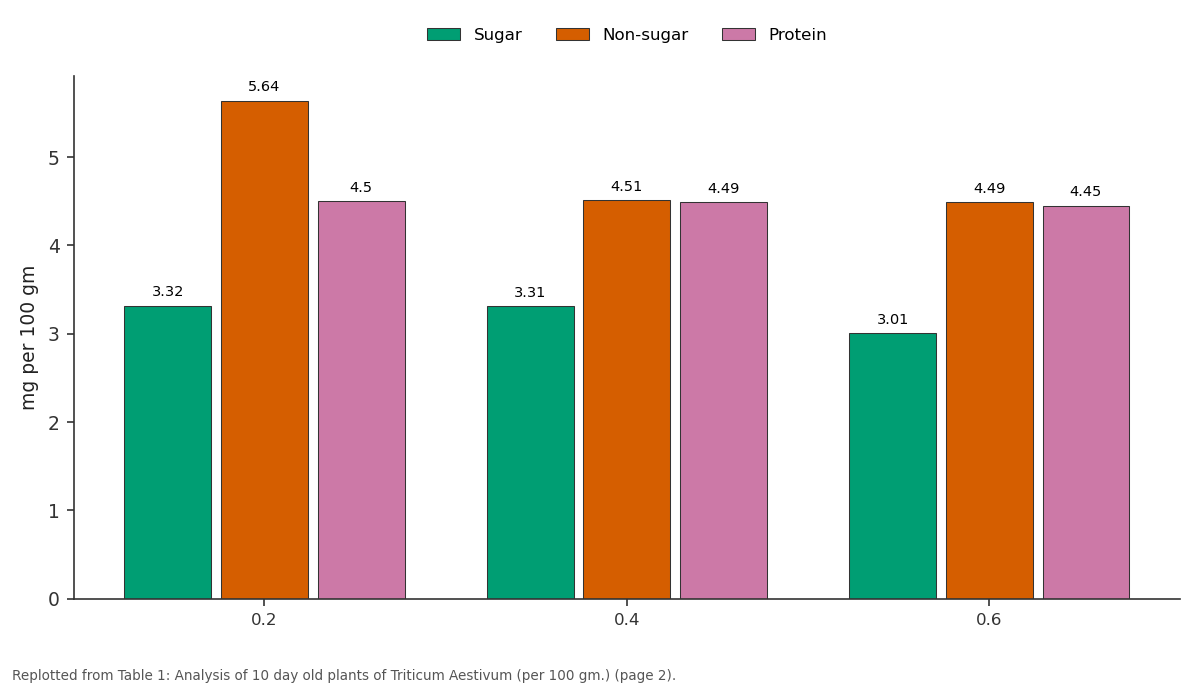
Sugar and Non-sugar and more: 0.2 vs 0.4 vs 0.6
Replotted from Table 1 (page 2) of the original paper. Every bar is the paper's own table value.
View source evidence ↗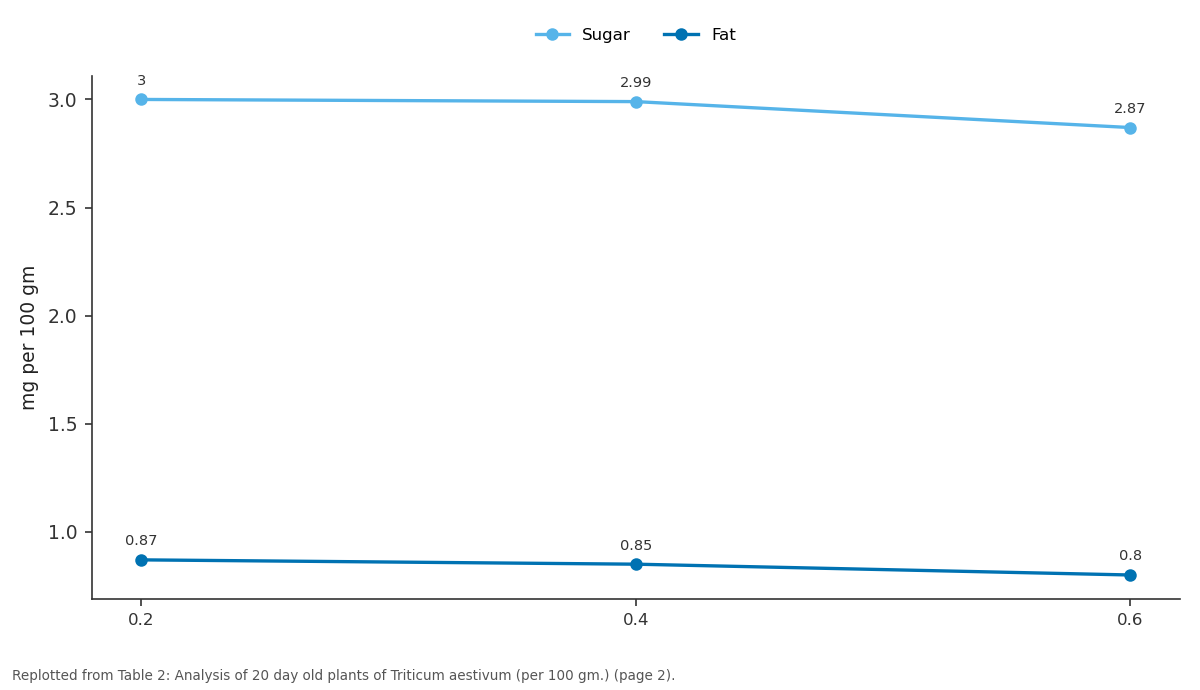
Sugar and Fat: 0.2 vs 0.4 vs 0.6
Replotted from Table 2 (page 2) of the original paper. Every bar is the paper's own table value.
View source evidence ↗Figures & tables
From the original paper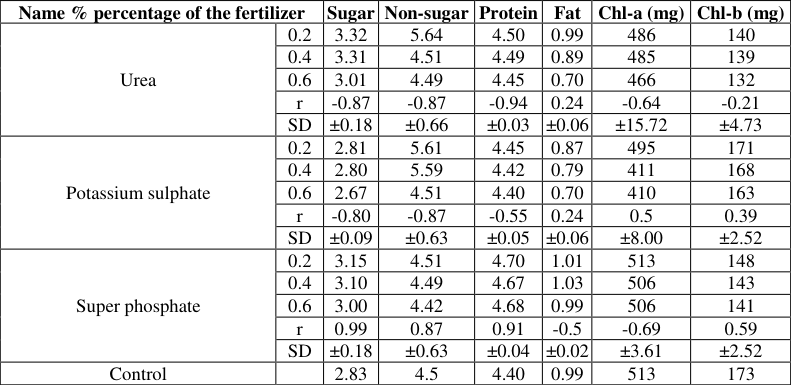 Table 1
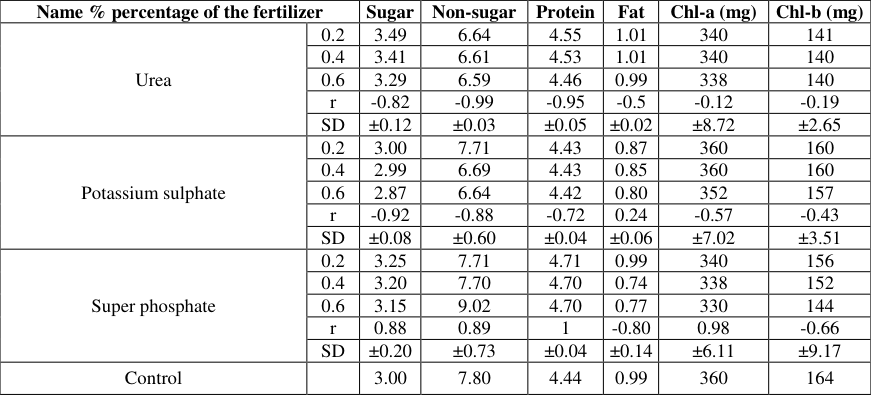 Table 2
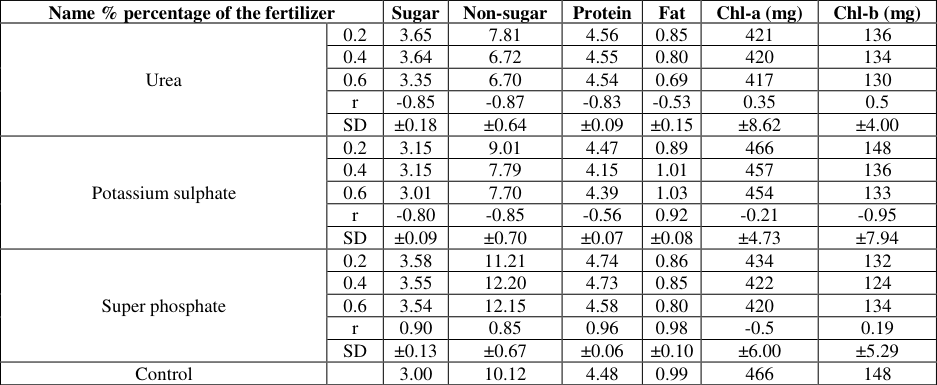 Table 3
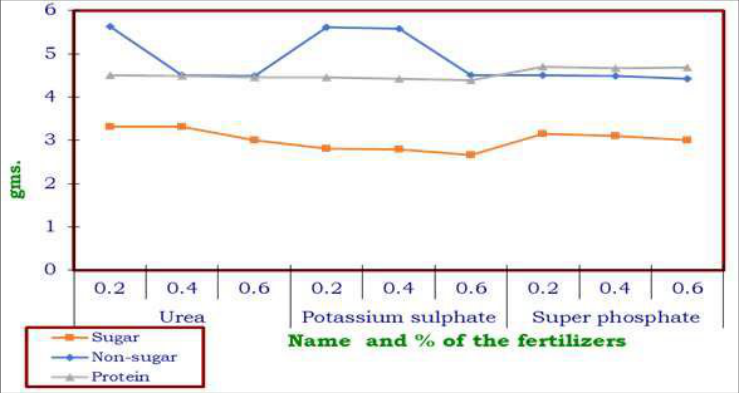 Figure 1
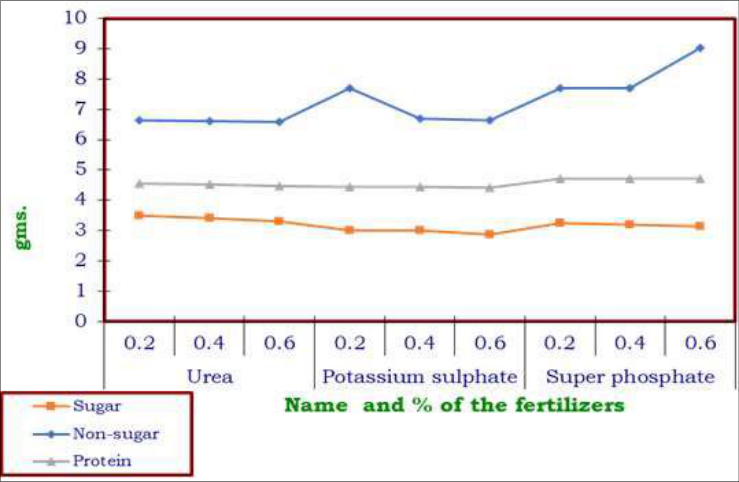 Figure 2
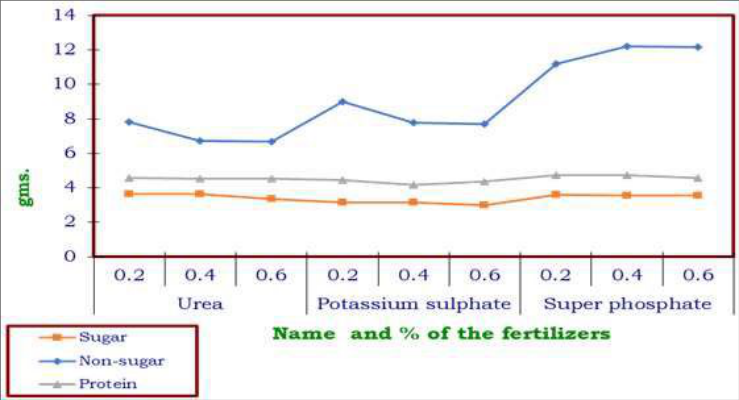 Figure 3
Introduction
Soil is a habitat for plants. As such, the soil's physical, chemical, and biological properties affect plant growth. The physical properties of a soil largely determine the ways in which it can be used. The size, shape, and arrangement of the primary soil particles are known as the physical properties of soil. Other important physical properties center on these such as the size and shape of the spaces between the particle arrangements, called the pore space, which has a direct effect on the movement of air and water, the ability of the soil to supply nutrients to plants, and the amount of water available to the plant. Wheat is one of the most important food-grains and has commodial position in the agricultural map of our country. It is the major stuff of life for millions all over the world. It is used for human food principally as other semolina products. The lower yields of this crop are of immediate concern to us in view of the fast growing population. Triticum aestivum L. (Poaceae) is one of the first cultivated grains which has been mainly used as human food. According to FAO statistics (2014) [1] . the average production of the crop in Iran is about 13.5 million tons per year that produce 90% of the country requirements. In small grain crops, seed germination and early seedling growth are very vulnerable to environmental stresses. The success at these stages could enhance crop growth and development, so the plants survive under environmental stresses to better production (Aliloo and Shokati, 2011 and Aliloo et al., 2014) [2][3] . Fertilizers are superior tools to enhance productivity however, they have disadvantages such as eutrophication (Withers, 2014) [4] , increase soil acidity and impact on soil biology (Belay et al., 2002) [5] . When fertilizers are used at sowing time or immediately before or after planting the chance will increase to impact on seed germination. Various tests have been reported conflicting effects of fertilizer on seed germination. The decrease of water potential because of dissolved mineral could affect root protrusion and seedling growth. Bouaziz and Hicks (1990) [6] , however, reported that relationship between water potential and seed germination of wheat seed was not significant. There are contradictory reports about fertilizers effects on early growth of crop plants. Therefore, the aim of this study was to determine effects of NPK fertilizer on germination and seedling growth of wheat.
Material and Methods
From the experiment it is clear that in experimental sets with 0.2% of urea, the average height of plant species Triticum aestivum increased as compared to their control sets but in another sets with 0.4% to 0.6% urea the average height of the plants was found to have decreased. In case of 0.2% of potassium sulphate the average height of the plants increased as compared to their control sets. At 0.4% and 0.6% of potassium sulphate sets, the average height was found to have decreased the correlation value was also found to be negative. In case of the superphosphate sets plants showed promoting character. The average height of the plants of all the species had registered an increase. under the treatment of 0.2% treatment. The % of super-phosphate increased from 0.4% to 0.6% the average height of the plants have decreased as compared to their control sets. The correlation values were found negative. The analysis of 10 days old plant of Triticum aestivum which were irrigated with 0.2% urea had revealed that the percentage of sugar, non-sugar, and protein had increased (i.e. as per 3.32 mg., 5.64 mg., and 4.50 mg.) when compared with that of the control sets of plants (i.e. as per 2.83mg., 4.5mg. and 4.40mg.) but with 0.6% of urea the percentage of sugar, non-sugar, and protein was found to have decreased. Likewise the values of Chl a and Chl b was observed lesser when compared with control. During the treatment of 0.2%, urea the fats conserved 0.99 mg which is similar to control if the concentration of urea soln. was increased the values of fats was observed 1.11 mg & 1.02 mg respectively. Azimi et al. (2013 a & 2013b) [7][8] . has also reported previously. In case of 0.2% and 0.4% of potassium sulphate of the ten -day old plants of Triticum aestivum, the percentage of non-sugar and protein increased up to 5.61 mg., 4.45mg. but sugar remained the same when compared with that of the control sets which recorded 4.5 gm., 4.40mg. and 2.83 mg. whereas the above sets which were irrigated with 0.6% of potassium sulphate, showed decrease in sugar (2.67 mg.) the amount of non-sugar and protein remained the same in respect of their control sets. Like wise fat, Chl a and Chl b are shows lesser value when compared with control sets. Cao et al. (2007) [9] also reported such type results.
Results and Discussion
The 10-days old plants of Triticum aestivum on treatment with 0.2 to 0.6% of super-phosphate showed increase in sugar, nonsugar & protein from 3.15 mg. to 3.00 mg., 4.51 mg. to 4.42 mg. and 4.70 mg. to 4.68/100 mg.). In case of 20-days old plants of Triticum aestivum which were treated with 0.2% to 0.6% of urea, the percentage concentration of sugar, protein, and fats have increased (3.49 mg to 3.29 mg, 4.55 mg to 4.46 mg and 1.01 mg to 0.99 mg) with respect of control ones respectively. The percentage concentration of non-sugar, Chl a and Chl b decreased.
In case of potassium-sulphate from 0.2% to 0.6%. The valus sugar, nonsugar, protein, fat, Chl a and Chl b are observed in decreasing order. Sugar 3.00 mg to 2.87 mg, non sugar 7.71 mg to 6.64 mg, protein 4.43 mg to 4.42 mg, fat 0.87 mg to 0.80 mg Chl a 360 mg to 352 mg and Chl b 160 mg to 157 mg respectively. With super-phosphate percentage from 0.2% to 0.6%, the sets exhibited increase in sugar, non-sugar and protein percentage from 3.25 mg. to 3.15 mg. 7.71 mg. to 9.02 mg. and 4.71 mg. to 4.70 mg./100 gm. respectively as compared to the control ones i.e., as per 3.00 mg. 7.80 mg. and 4.44 mg. But fat, Chl a and Chl b shows lesser amount in comparison of control. An analysis of 30-day old plants Triticum aestivum which were treated with 0.2% and 0.4% of urea, showed increase in sugar and protein i.e., 3.65 mg. and 4.56 mg. as compared to that of the control ones (3.00 mg. and 4.48 mg.) but non sugar, fat, chl a and chl b shows low values in comparision of control as the percentage of urea increased upto 0.6%, the percentage of sugar, non-sugar, protein, fat and chl a and chl b decreased. The potassium sulphate was not effective but super phosphate shows earlier good results. It is possibly due to this factor only that osmotic effects develop resulting in decreased hydration of proteins including enzymes (Laties-1954 and Honda et al. 1958) [10][11] . and there by produce changes in the rates of metabolic processes. Plant water stress is likely to reduce also the photo-synthetic surface and production of food material. Similar observation with regard to aquatic species have been made by Stocker and Hold Heild (1937) [12] ; Greenfield (1942) [13] , Ensgraber (1954) [14] . and Boyer (1965) [15] . Another reason for plants growth reduction could be high concentrations of salts which tend to slow down or stop root elongation and hasten maturation Hayward and Blair 1942) [16] . White and Rose (1939) [17] . also observed that root growth is seriously reduced due to excessively high concentration of salts.
Conclusion
In conclusion, we found different responses from wheat germination and seedling growth under fertilizer applications. Reduction in plant-growth may be due to a high salt content around the roots of the plants as it markedly reduces their power of absorbing water. Due to this factor plant water-stress occurs, whenever the loss of water in transpiration exceeds the rate of absorption. The high concentration of salt reduces the osmotic potential of the cell sap and due to it cell water potential is kept low.
Figures and tables from the paper
| Name % percentage of the fertilizer | — | Sugar | Non-sugar | Protein | Fat | Chl-a (mg) | Chl-b (mg) |
|---|---|---|---|---|---|---|---|
| Urea | 0.2 | 3.32 | 5.64 | 4.50 | 0.99 | 486 | 140 |
| 0.4 | 3.31 | 4.51 | 4.49 | 0.89 | 485 | 139 | |
| 0.6 | 3.01 | 4.49 | 4.45 | 0.70 | 466 | 132 | |
| r | -0.87 | -0.87 | -0.94 | 0.24 | -0.64 | -0.21 | |
| SD | ±0.18 | ±0.66 | ±0.03 | ±0.06 | ±15.72 | ±4.73 | |
| Potassium sulphate | 0.2 | 2.81 | 5.61 | 4.45 | 0.87 | 495 | 171 |
| 0.4 | 2.80 | 5.59 | 4.42 | 0.79 | 411 | 168 | |
| 0.6 | 2.67 | 4.51 | 4.40 | 0.70 | 410 | 163 | |
| r | -0.80 | -0.87 | -0.55 | 0.24 | 0.5 | 0.39 | |
| SD | ±0.09 | ±0.63 | ±0.05 | ±0.06 | ±8.00 | ±2.52 | |
| Super phosphate | 0.2 | 3.15 | 4.51 | 4.70 | 1.01 | 513 | 148 |
| 0.4 | 3.10 | 4.49 | 4.67 | 1.03 | 506 | 143 | |
| 0.6 | 3.00 | 4.42 | 4.68 | 0.99 | 506 | 141 | |
| r | 0.99 | 0.87 | 0.91 | -0.5 | -0.69 | 0.59 | |
| SD | ±0.18 | ±0.63 | ±0.04 | ±0.02 | ±3.61 | ±2.52 | |
| Control | 2.83 | 4.5 | 4.40 | 0.99 | 513 | 173 |
Table text extracted from the original PDF; superscript letters are shown inline. The original table image is below.
View original table image
| Name % percentage of the fertilizer | — | Sugar | Non-sugar | Protein | Fat | Chl-a (mg) | Chl-b (mg) |
|---|---|---|---|---|---|---|---|
| Urea | 0.2 | 3.49 | 6.64 | 4.55 | 1.01 | 340 | 141 |
| 0.4 | 3.41 | 6.61 | 4.53 | 1.01 | 340 | 140 | |
| 0.6 | 3.29 | 6.59 | 4.46 | 0.99 | 338 | 140 | |
| r | -0.82 | -0.99 | -0.95 | -0.5 | -0.12 | -0.19 | |
| SD | ±0.12 | ±0.03 | ±0.05 | ±0.02 | ±8.72 | ±2.65 | |
| Potassium sulphate | 0.2 | 3.00 | 7.71 | 4.43 | 0.87 | 360 | 160 |
| 0.4 | 2.99 | 6.69 | 4.43 | 0.85 | 360 | 160 | |
| 0.6 | 2.87 | 6.64 | 4.42 | 0.80 | 352 | 157 | |
| r | -0.92 | -0.88 | -0.72 | 0.24 | -0.57 | -0.43 | |
| SD | ±0.08 | ±0.60 | ±0.04 | ±0.06 | ±7.02 | ±3.51 | |
| Super phosphate | 0.2 | 3.25 | 7.71 | 4.71 | 0.99 | 340 | 156 |
| 0.4 | 3.20 | 7.70 | 4.70 | 0.74 | 338 | 152 | |
| 0.6 | 3.15 | 9.02 | 4.70 | 0.77 | 330 | 144 | |
| r | 0.88 | 0.89 | 1 | -0.80 | 0.98 | -0.66 | |
| SD | ±0.20 | ±0.73 | ±0.04 | ±0.14 | ±6.11 | ±9.17 | |
| Control | 3.00 | 7.80 | 4.44 | 0.99 | 360 | 164 |
Table text extracted from the original PDF; superscript letters are shown inline. The original table image is below.
View original table image
| Name % percentage of the fertilizer | — | Sugar | Non-sugar | Protein | Fat | Chl-a (mg) | Chl-b (mg) |
|---|---|---|---|---|---|---|---|
| Urea | 0.2 | 3.65 | 7.81 | 4.56 | 0.85 | 421 | 136 |
| 0.4 | 3.64 | 6.72 | 4.55 | 0.80 | 420 | 134 | |
| 0.6 | 3.35 | 6.70 | 4.54 | 0.69 | 417 | 130 | |
| r | -0.85 | -0.87 | -0.83 | -0.53 | 0.35 | 0.5 | |
| SD | ±0.18 | ±0.64 | ±0.09 | ±0.15 | ±8.62 | ±4.00 | |
| Potassium sulphate | 0.2 | 3.15 | 9.01 | 4.47 | 0.89 | 466 | 148 |
| 0.4 | 3.15 | 7.79 | 4.15 | 1.01 | 457 | 136 | |
| 0.6 | 3.01 | 7.70 | 4.39 | 1.03 | 454 | 133 | |
| r | -0.80 | -0.85 | -0.56 | 0.92 | -0.21 | -0.95 | |
| SD | ±0.09 | ±0.70 | ±0.07 | ±0.08 | ±4.73 | ±7.94 | |
| Super phosphate | 0.2 | 3.58 | 11.21 | 4.74 | 0.86 | 434 | 132 |
| 0.4 | 3.55 | 12.20 | 4.73 | 0.85 | 422 | 124 | |
| 0.6 | 3.54 | 12.15 | 4.58 | 0.80 | 420 | 134 | |
| r | 0.90 | 0.85 | 0.96 | 0.98 | -0.5 | 0.19 | |
| SD | ±0.13 | ±0.67 | ±0.06 | ±0.10 | ±6.00 | ±5.29 | |
| Control | 3.00 | 10.12 | 4.48 | 0.99 | 466 | 148 |
Table text extracted from the original PDF; superscript letters are shown inline. The original table image is below.
View original table image
References
16 in the original paper- Aliloo AA, Shokat B. Correlation between seed tests and seed performance of two maize hybrid (SC704 and SC500). Online Journal of Animal and Feed Research. 2011; 1:249254.
- Aliloo AA, Ezzati F, Mustafavi SH. Influence of seed moisture content and salicylic acid treatments on low and freezing temperature tolerance of fennel seeds. Agriculture and Forestry. 2014; 60:175-185.
- Withers PJA, Neal C, Jarvie HP, Doody DG. Agriculture and eutrophication: where do we go from here? Sustainability. 2014; 6:5853-5875.
- Belay A, Claassens A, Wehner FC. Effect of direct nitrogen and potassium and residual phosphorous fertilizers on soil chemical properties, microbial components and maize yield under long term crop rotation. Biol. Fert. Soils. 2002; 35:420-427.
- Bouaziz A, Hicks DR. Consumption of wheat seed reserves during germination and early growth as affected by soil water potential. Plant and Soil. 1990; 128:161-165.
- Azimi, SM, Farnia A, Shaban M, Lak M. Effect of different biofertilizers on Seed yield of barley (Hurdeom vulgar L.), Bahman cultivar. International Journal of Advanced Biological and Biomedical Research. 2013; 1(5):538-546.
- Azimi SM, Nabati E, Shaban M, Lak M. Effect of N and P bio fertilizers on yield components of barley. International Journal of Advanced Biological and Biomedical Research. 2013; 2(2):365-370.
- Cao MJ, Yu HQ, Yan HK. Difference in Tolerance to Potassium Deficiency between Two Maize Inbred Lines. Plant Production Science. 2007; 10:42-46.
- Laties GG. The osmotic inactivation in Situ of plant mitochondrial enzymes. J.Exp. Bot. 1954; 5:49-70.
- Honda SI, Robertson RN, Gregory JM. Studies in metabolism of plant cells XII. Ionic effects on oxidation of reduced diphosphopyridine nucleotide and cytochrome C by plant mitochondria. Aust. Biol. Sci. 1958; 111:1-55.
- Stocker O, Holdheild W. Die assimilation Helgolander Gezeitenalgen Wahrend der Ebbzeit. Z. Bot. 1937; 32:1-59.
- Greenfield SS. Inhibitory effects of inorganic Compounds on Photosynthesis in Chlorella Amer, J. Bot. 1942; 29:121-131.
- Ensgraber A. Uber deneinfluse der antrocknugoul die, Assimilation and atmung von moosen and Flechten, Flora. 1954; 141:432-475.
- Boyer MJ. Effect of seed soaking on the growth and development of Crop plants. Finger millet (Eleusine coracanna Gaertu) Ind. J. of Plant Physiol. 1965; 8(1):52-56.
- Hayward HE, Long EM, Uhoits R. Effect of chloride and sulphate on the growth and development of the Elberta peach on shalil and Lovell rootstocks. U.S. Dept. Agr. Tech.Bull, 1946, 922.
- White LM, Ross WH. Effect of various grades of fertilizers on the salt contents of the soil solution. J. Agr.Res, 1939; 59:81-100.