
Research article · 2021 · Full text
International Journal of Veterinary Sciences and Animal HusbandryGenetic parameter and genetic trend estimates for reproductive traits of jersey breed in Ethiopian highland environment
Volume 6(5) · Pages 01–07 · DOI: 10.22271/veterinary.2021.v6.i5a.374 ↗
Research areasGenetic and phenotypic traits in livestockReproductive Physiology in LivestockEffects of Environmental Stressors on Livestock
Abstract
Author-writtenData collected from Jersey herd in the central highland environment of Ethiopia was used to estimate genetic parameter and genetic trend analysis for reproductive/fertility traits. Totally, 11,933 Jersey reproductive records recorded during the last 30 years were used for analysis. Traits studied were NSC (number of service per conception), DO (days open), CI (calving interval), AFC (age at first calving) and AFS (age at first service). Genetic and phenotypic parameters (heritability, repeatability, genetic and phenotypic correlation and estimated breeding values of individual animal) were estimated by using WOMBAT software package, version (2020) fitting a multi trait animal model. Genetic and phenotypic trends were calculated by regression of average estimated breeding values/phenotypic values of each trait on birth years. The estimated heritability for NSC, DO, CI, AFC and AFS were 0.01, 0.08, 0.04, 0.09 and 0.08, respectively while the corresponding repeatability values were 0.01, 0.11 and 0.14, respectively without the estimated values of AFC and AFS. Genetic correlations were all positive and in the range from 0.11 between DO and AFC to 0.99 between DO and CI. Phenotypic correlations were also positive and ranges from 0.16 (AFS-CI) to 0.98 (AFC-AFS). Genetic trend analysis based on birth years for NSC, DO, CI, AFC and AFS were in the favorable direction and found to be -0.002, -0.82 day, -0.6 day, -0.002 month and -0.002 month, respectively whereas phenotypic trends were -0.05, 0.93 day, 0.81 day, 3.2 months and 2.4 months, respectively which are unfavorable direction and undesirable for most traits. As monitored in the present study, the reproductive/fertility performance of Jersey cows in the central highland of Ethiopia was somewhat based on genetic effects but larger undesirable environmental components for the total phenotypic value.
Summary
Source-checkedPlain-language reading of the full paper, prepared with AI and checked against the text. Each point links to the authors' own words.
Why it matters
- Fertility is considered the most fundamental trait in animal production because it determines an individual's contribution to the next generation and serves as the basis for selection. View evidence ↗
- The fertility of dairy cows is influenced by both genetic factors and environmental factors, the latter of which can suppress a cow's true genetic potential. View evidence ↗
- The Jersey breed is internationally recognized for having greater fertility, earlier maturity, shorter calving intervals, and fewer calving problems compared to other breeds. View evidence ↗
The question
- The study aimed to provide the first evaluation of heritability, correlation, and genetic trends for reproductive and fertility performance in pure Jersey cows within Ethiopia. View evidence ↗
What they did
- Researchers analyzed 11,933 retrospective reproductive records from pure Jersey cows at the Adea Berga sub research center in central Ethiopia, covering the period from 1986 to 2019. View evidence ↗
- The study measured five specific reproductive traits: number of services per conception (NSC), days open (DO), calving interval (CI), age at first calving (AFC), and age at first service (AFS). View evidence ↗
- A multi-trait animal model was implemented using the WOMBAT software package (version 2020) to estimate heritability, repeatability, correlations, and estimated breeding values. View evidence ↗
What they found
- Heritability estimates for the reproductive traits were low, ranging from 0.01 for NSC to 0.09 for AFC. View evidence ↗
- Repeatability values were also low, recorded at 0.01 for NSC, 0.11 for DO, and 0.14 for CI. View evidence ↗
- All genetic correlations were positive, with the strongest correlation (0.99) found between days open (DO) and calving interval (CI). View evidence ↗
- Annual genetic trends were in a favorable (negative) direction for all traits, including -0.82 days for DO and -0.6 days for CI. View evidence ↗
- In contrast to genetic trends, phenotypic trends were generally unfavorable, with increases of 0.93 days for DO, 0.81 days for CI, 3.2 months for AFC, and 2.4 months for AFS. View evidence ↗
What it means
- The authors concluded that while genetic effects played a role, the overall reproductive performance of Jersey cows in central Ethiopia was dominated by undesirable environmental components. View evidence ↗
- The authors recommend that genetic progress for fertility traits should be pursued through a combination of active selection and improved management practices. View evidence ↗
- The authors note that the current breeding program was unsuccessful due to low selection pressure and the influence of an unfavorable environment. View evidence ↗
Visual summary
2 visualsIllustrations explain the paper; charts are replotted from the paper's own table values.
Genetic vs Phenotypic Trends
AI-generated conceptual illustration (Jersey cattle in the Ethiopian highlands). It explains the idea and does not show study data.
View source evidence ↗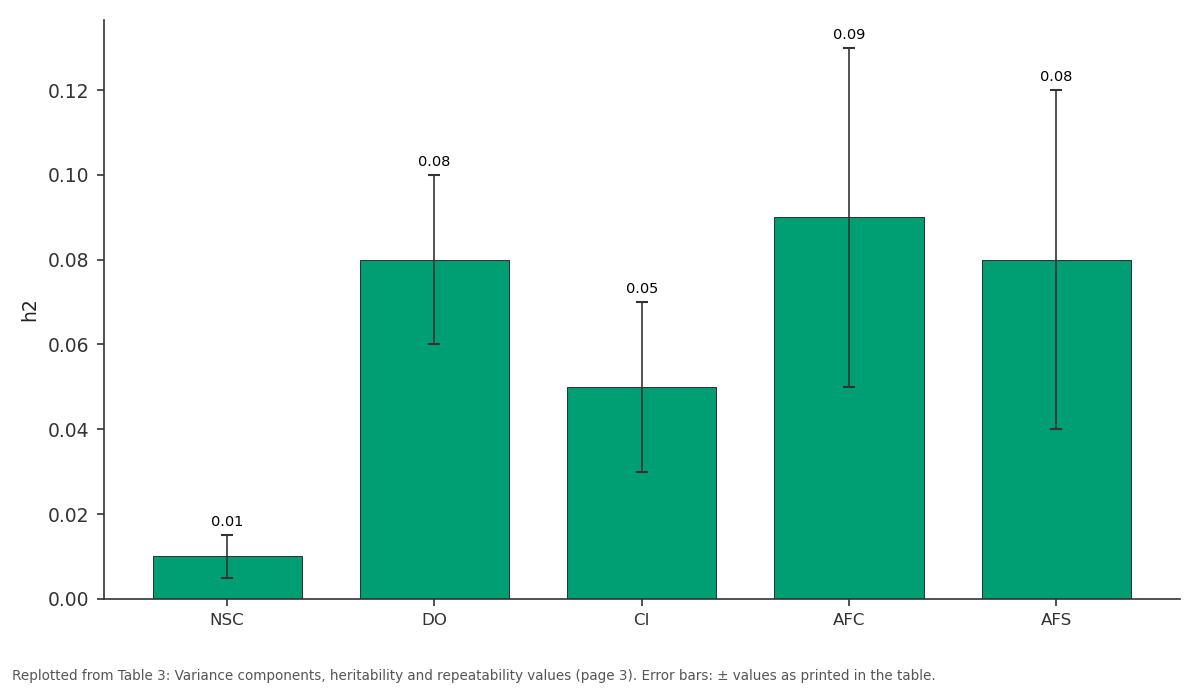
h2: NSC vs DO vs CI vs AFC vs AFS
Replotted from Table 3 (page 3) of the original paper. Every bar is the paper's own table value.
View source evidence ↗Figures & tables
From the original paper Table 1
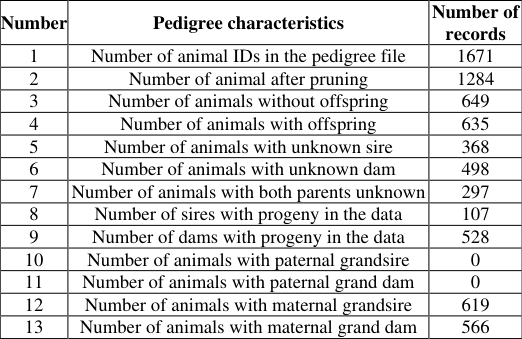 Table 2
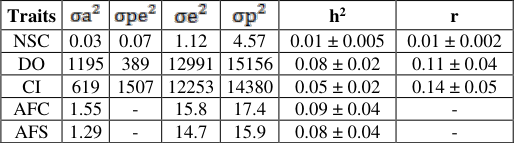 Table 3
 Table 4
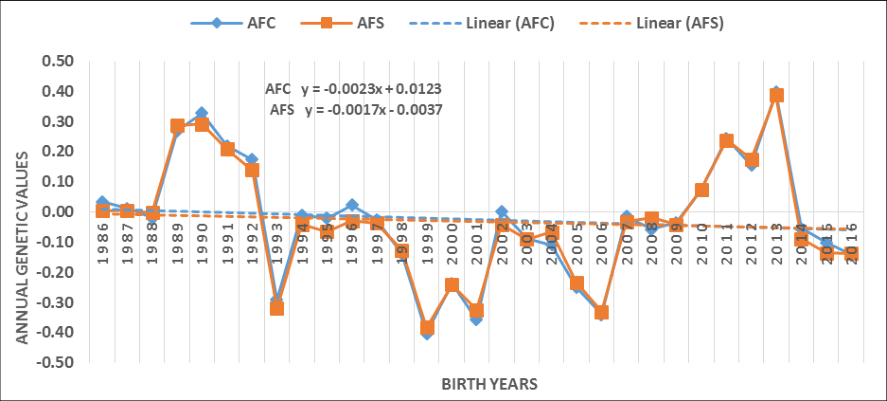 Figure 1
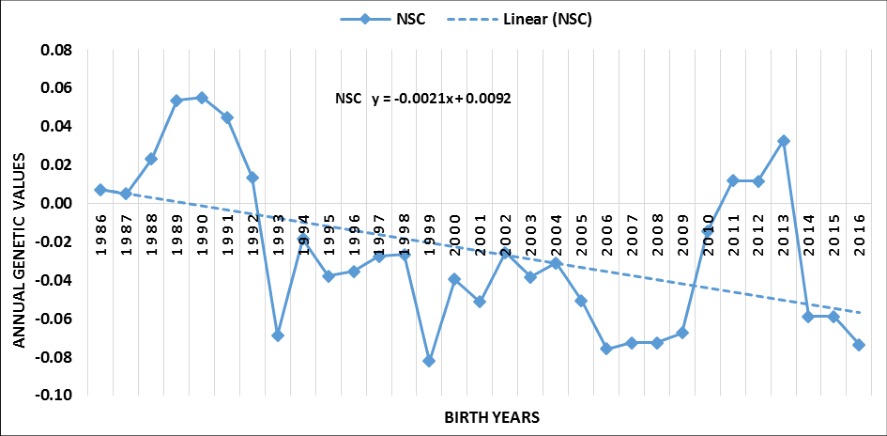 Figure 3
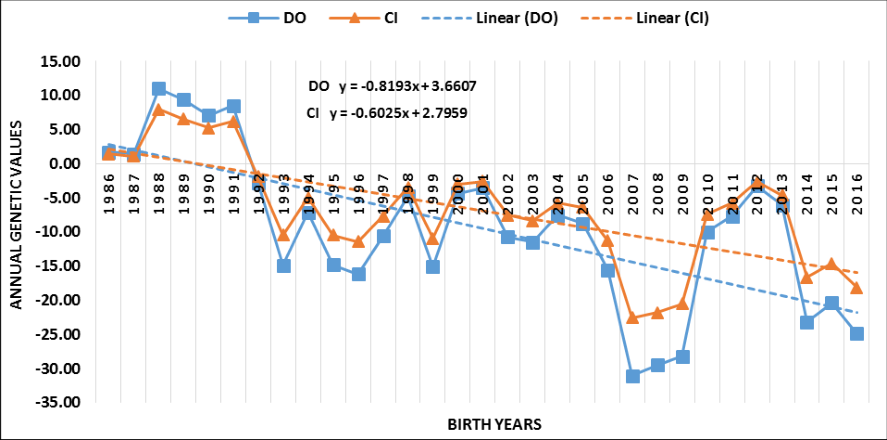 Figure 2
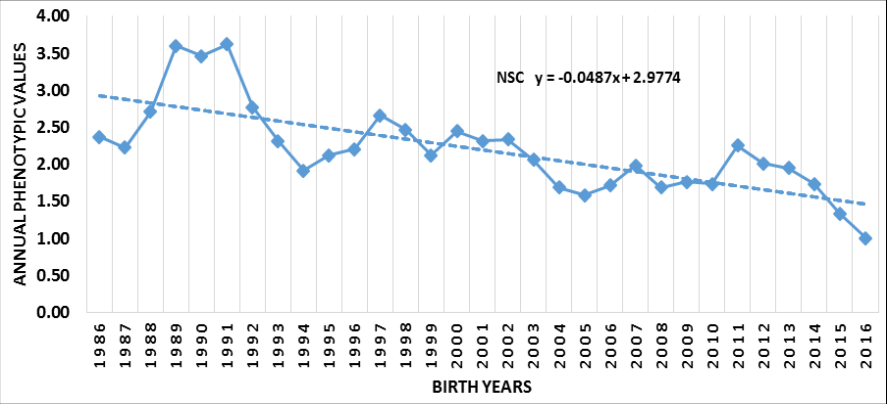 Figure 6
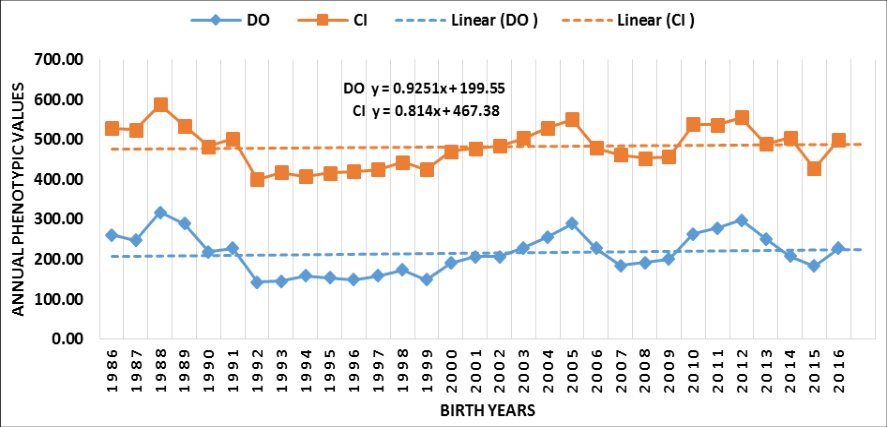 Figure 5
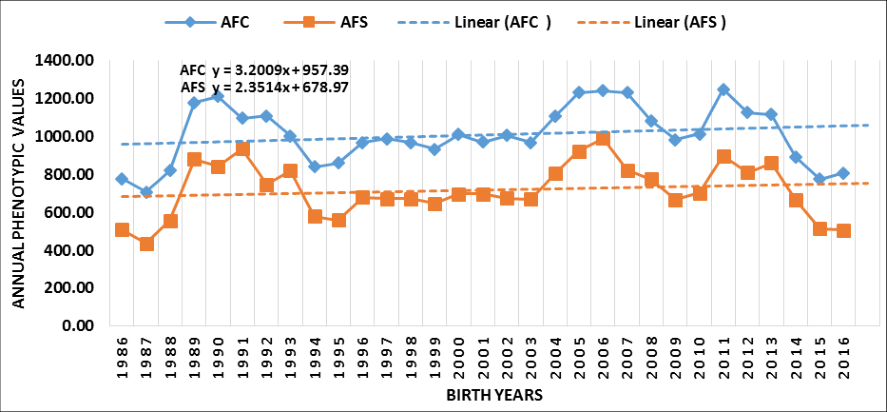 Figure 4
Introduction
stated that the genetic efficiency of animals depends primarily upon three functions: female production, fertility/reproduction and growth of progeny. There is no doubt that fertility is the most fundamental trait as it determines the contribution of an individual to next generation and thus gives the base for selection. Moreover, fertility traits are one of the most frequent reason for culling. Beside genetic factors, the fertility status of dairy cows are depends on environmental factors which suppressed the true genetic ability of the cows (Suhail et al. 2010; Fernando et al. 2016) [2,3] . In any genetic improvement program, performance evaluations on dairy herds are based on the analysis of large data. However, recording on fertility, production and health performance information for genetic evaluation of the animals are generally small/no because of small intra herd population in Ethiopia. Majority of dairy cattle are indigenous and found on the hands of smallholder farmers in a fragmented way, i.e small population with no recorded information. As a result, selection and breeding of those cattle that are more fertile, productive and less susceptible to diseases are challenged work. Efforts have been made by the government and some private sectors to establish large commercial farms, introducing high yielding exotic breeds since 1974. Exotic breeds such as Holstein Frisian and Jersey have been found in some government research and private farms for pure and/or cross breeding purposes and therefore, genetic improvement and evaluation are limited on such farms in the last 45 years.
From the fertility point of view, several authors have suggested that Jersey breed is international recognized breed with little or no calving problems, a shorter calving interval, earlier maturity and greater fertility compared to other breeds (Cunningham and Syrstad 1987 [4,5,6,7] . The inherent genetic attributes (small mature size, low maintenance requirement, high milk fat content and good reproductive performances) of Jersey, the breed is more likely chosen in the tropical dairy development. Jersey cows excel with longer productive life than other dairy breeds (Nieuwhof et al. 1989; U.S. Jersey 2014) [8,5] . Jersey breed also known for less disease and injury, and fewer foot and leg problems than other dairy breeds (U.S. Jersey 2016) [9] . Moreover, Jersey possess multifunctional characters and an ideal breed for crossbreeding with Bos indicus to produce a hardy, diseasetolerant, dairy-type cow that does not need a high plane of nutrition to produce reasonable milk yield and is suited to dairying in the communal areas. Jerseys perform well under a wide range of systems and are well known for their high feed conversion efficiency. Olson et al. (2010) [10] compared feed intake and production of Holsteins, Jerseys, and their crosses and observed that Jerseys were 6% better than Holsteins at converting input to output. Now many dairy producers showed a renew interest that change from Holsteins to Jerseys due to increasing economic pressures and Jersey breed make more profit per acre than other larger breeds (Kumar et al. 2015) [11] . For this reason, Jersey is the second largest and most important breed of dairy cattle in the world and found in more than 80 countries (Jersey Canada 2015) [12] . Jersey has been introduced into Ethiopia in 1986 and established a farm at two different location in the country for commercial milk production. The breed has been adapted and reproduced more than three decades in the cool tropical highland and midland environments of the country. Some information are generated the reproductive /fertility performance of Jersey breed at two location of Ethiopian. Hunde et al. (2015) [13] reported that the reproductive performance (AFC, CI and NSC traits for Jersey breed are 30 months, 497 days and 2, respectively) in central highland. On the other hand, Habtamu et al. (2010) [14] reported 34.5 months, 450 days and 1.8 for AFC, CI and NSC, respectively in southern mid altitude of Ethiopia. Even though many information had generated the genetic situation of Jersey breed across the world, genetic parameters and genetic trends of Jersey for reproductive traits in Ethiopia were not evaluated yet. Therefore, this study was intended to generate an information on heritability, correlation and genetic trend for reproductive/fertility performance of pure Jersey cows in Ethiopia.
Materials and Methods
Materials and Methods
Study location and data source
Retrospective data of NSC, DO, CI, AFC and AFS of pure Jersey cows calved from 1986 to 2019 was obtained from central Ethiopia, Adea Berga sub research center where pure Jersey breed is reared. This farm was founded in 1986 by introducing 400 pregnant pure Jersey heifers and 2 bulls from Denmark. Hunde et al. (2015) [13] extensively discussed the geographical location, description of the farm, herd management and breeding program of the research farm.
Data editing and statistical analysis
Prior to analysis, incomplete records were edited/deleted according to the following criteria 1. AFS below 8 months and above 46 months 2. AFC below 17 months and above 62 months 3. DO below 45 days and above 1250 days 4. CI below 330 days and above 2100 days 5. NSC greater than 25 times 6. Data with unknown sire and dam (animals with unknown pedigree were pruned) 7. Abortion and still birth data 8. Errors associated with animal birth date, calving date, service date. Finally, 11933 performance data were obtained. Multi variate analysis to estimate additive genetic and environmental variances, heritability, repeatability, genetic and phenotypic correlations were done using WOMBAT program version (2020) fitted repeatability animal model. In the preliminary analysis, season of birth/calving/service, years of birth/calving/service were identified as fixed effects and the level of significance was done by GLM procedure of SAS 2004 version 9.0. Except season of calving for DO and parity for CI, all fixed effects (year, season and parity) were significant source of variation for all fertility traits and included into the genetic parameter analysis. Therefore, birth years/seasons were fitted for AFS and AFC, calving years and calving seasons were fitted for DO, calving years were fitted for CI, service years and service seasons were fitted for NSC traits and parity of cows were fitted as a fixed effect for DO and NSC traits. Parities above 8 were merged in to 8 parity because of few records. Birth/calving/service months of the years are grouped into three seasons according to pattern of annual rainfall distribution as dry period, October to February; light rain, March to May and main rain, June to September (Hunde et al. 2015) [13] . Additive genetic, permanent environment for repeated records and residuals are used as random effects. The detailed three-step analysis were described as follows.
Step 1: preliminary Analysis of fixed effects to determine level significance
Where, Y ijkl is NSC, DO, CI, AFS and AFC traits; µ is the overall mean; B j is the fixed effect of j th year of calving/ birth/service; C k is the fixed effect of k th season of calving/birth/service; P l is the fixed effect of l th parity of cow; e ijkl is random residual term.
Step 2: Analysis of variance components and genetic parameters fitted with significant fixed effects
Where, Y, is the vector of observations (for NSC, DO, CI, AFS and AFC traits); b, includes vector of fixed effects (year/season of calving/birth/service); a, is the vector of animal (additive) genetic random effects; pe, is the vector of permanent environmental effects (not fitted for AFS and AFC); e, is the vector of residual effects and; X, Z and W are the corresponding incidence matrices of the fixed effects, additive genetic and permanent environmental effects, respectively. For AFS and AFC due to single observation per animal, permanent environmental effect was excluded in the model. This model was assumed as expected value of Y to be Xb. The vector random individual additive effects, permanent environmental effects and residual effects are assumed to be uncorrelated and have expected mean of zero and variances , and , respectively. Therefore, heritability, repeatability and genetic and phenotypic correlations were estimated by using the following formula.
Result and Discussion
Result and Discussion
Heritability
The estimated variance components, heritability and repeatability values of NSC, DO, CI, AFC and AFS traits along with their respective standard errors in this study are presented in table 3. Heritability estimates for fertility traits ranged from 0.01 for NSC to 0.09 for AFC traits. AFC had higher heritability value followed by AFS. Smaller genetic variations were found for all traits as indicated from additive genetic variance. The estimated heritability's for DO and CI were 0.08 and 0.04, which is higher than the estimates of Campos et al. (1993) [15] for DO and CI (0.03 and 0.02) in the same breed. Heritability estimates of Jersey breed for reproductive traits were variable results across different research reports probably, the result of environment and management effects, model and estimation procedure followed for analysis, the available data and the year/period in which breeds are evaluated. Musani and Mayer (1997) [16] found lower (0) heritability for CI and higher (0.03 and 0.13) for NSC and AFC. Anshuman et al. (2018) [17] reported higher heritability for DO, CI and NSC traits. Suhail et al. (2010) [2] the heritability estimates for AFC, CI and DO are 0.48, 0.10 and 0.10, respectively for Pakistani Jersey breed which is much higher than the present result. Higher estimates of heritability's (0.29, 0.22, 0.22 and 0.04) for AFS, AFC, CI and NSC are also reported on Jersey x red sindhi breed in India (Vinothraj et al. 2016) [18] . The present heritability's for all fertility traits were lower than the tropical Jersey breed research result presumably; Jersey in Ethiopia was highly influenced by management and was given lower emphasis for selection. However, our results are still within the true range of actual estimates those in the literature that reproductive traits are lower heritability values. ; h 2 , heritability and r repeatability
| Traits | — | — | — | — | h2 | r |
|---|---|---|---|---|---|---|
| NSC | 0.03 | 0.07 | 1.12 | 4.57 | 0.01 ± 0.005 | 0.01 ± 0.002 |
| DO | 1195 | 389 | 12991 | 15156 | 0.08 ± 0.02 | 0.11 ± 0.04 |
| CI | 619 | 1507 | 12253 | 14380 | 0.05 ± 0.02 | 0.14 ± 0.05 |
| AFC | 1.55 | - | 15.8 | 17.4 | 0.09 ± 0.04 | - |
| AFS | 1.29 | - | 14.7 | 15.9 | 0.08 ± 0.04 | - |
Table text extracted from the original PDF; superscript letters are shown inline. The original table image is below.
View original table image
Repeatability
The repeatability values in the present study for reproductive traits are lower (0.11 and 0.14) for DO and CI and very lower (0.01) for NSC traits. The lower repeatability indicated that culling of the cows could not be undertake on their early performance and the traits are highly influenced by unknown environmental condition. Moreover, an animal evaluation and genetic improvement using heritability value for these reproductive traits are not reliable. There are very few studies on repeatability estimates of reproductive traits for Jersey breed in the literature. Musani and Mayer (1997) [16] found 0.06 and 0.03 for NSC and CI in Kenyan Jersey while Vinothraj et al. (2016) [18] reported 0.001 and 0.23 values for NSC and CI traits for Jersey crosses in India.
Genetic and phenotypic correlations
Genetic and phenotypic correlations for reproductive/fertility traits are summarized in Table 4. The present genetic correlations were all positive and in the range from 0.11 between DO and AFC to 0.99 between DO and CI. High genetic correlation between AFS-AFC and DO-CI showed that these traits are genetically the same and suggested that an increasing performance, e.g AFC could be achieve through selection of CI. The reflection of positive genetic correlation also indicates traits are governed by combined effects of large numbers of the same genes as fertility traits are quantitative. Genetic correlation between NSC-DO and NSC-CI were lower than the values of Anshuman et al. (2018) [17] . On the other hand, the value 0.99 for DO-CI was higher than (Campos et al. 1993) [15] . Phenotypic correlations were also positive and ranges from 0.16 (AFS-CI) to 0.98 (AFC-AFS). The phenotypic correlation between DO-CI and AFS-AFC were higher while other phenotypic correlations among fertility traits were lower. There are limited studies found genetic and phenotypic correlation for reproductive/fertility traits of Jersey breed in the literature.
| — | NSC | DO | CI | AFC | AFS |
|---|---|---|---|---|---|
| NSC | 0.55 ± 0.32 | 0.56 ± 0.42 | 0.87 ± 0.10 | 0.87 ± 0.03 | |
| DO | 0.45 ± 0.02 | 0.99 ± 0.07 | 0.11 ± 0.06 | 0.18 ± 0.08 | |
| CI | 0.43 ± 0.02 | 0.84 ± 0.01 | 0.14 ± 0.04 | 0.16 ± 0.05 | |
| AFC | 0.25 ± 0.03 | 0.18 ± 0.04 | 0.17 ± 0.04 | 0.93 ± 0.05 | |
| AFS | 0.22 ± 0.04 | 0.17 ± 0.04 | 0.16 ± 0.04 | 0.98 ± 0.002 |
Table text extracted from the original PDF; superscript letters are shown inline. The original table image is below.
View original table image
Genetic and phenotypic trends 3.4.1 Genetic trends
The annual genetic components in change of all reproductive traits were the favorable (negative) direction but very small (underestimated) showing that the contribution of gene in the total phenotypic performance per year is negligible as result of no effective breeding program (selection) in the herd as the farm was used for milk production not for total genetic improvement program. Figure 1, 2 and 3 depicted the annual genetic trend for AFS, AFC, CI, DO and NSC traits. There were an annual declined genetic progress over 36 year's period. Fertility traits as measured by AFS, AFC, CI, DO and NSC showed variable genetic gain during the study period. All fertility traits showed slightly higher genetic trends until 1992. AFS, AFC and NSC gone the up and down ways which would decline in the right direction until 2009. However, the trend increased then after and declined again. On the other hand DO and CI showed marked decline through the whole study period after 1992. Few literature results are available for Jersey genetic trend for fertility traits. Njubi et al. (1992) [19] reported 0.15 day/year for CI trait which is completely different from the present result (-0.6 day/year).
Phenotypic trends
The annual phenotypic components in change of reproductive traits were significantly different from zero for AFS and AFC but for DO, CI and NSC showing that the declines in phenotypic performance was largely due to environment and management effects especially availability and quality of feed and, disease effect. Figure 4, 5 and 6 showed the annual phenotypic trends of fertility (reproductive) traits for Jersey cows. During the study period, reproductive performance as measured by AFS, AFC, CI, DO and NSC showed a variable performance across the whole study periods. AFS, AFC, DO and CI were more or less constant in the mid-1990s and 2000s. Recently AFS and AFC were declined but DO and CI increased. Disease and feed manifestation in terms of quality and quantity over the study period made the phenotypic trend variable and directed in undesirable direction, which finally deteriorated the fertility traits of Jersey cows. On the other hand, phenotypic trend of NSC was markedly declined towards the negative direction, which is favorable. Njubi et al. (1992) [19] agreed with the present study and reported that the increased of CI (2.36 days/year) for Kenyan Jersey breed are not from genetic but environmental deterioration.
Conclusion
As monitored in the present study, the fertility/reproductive performances of Jersey cows were based on genetic effect but very small contribution to the total phenotype value. The Poor reproductive efficiency affected by large environment in the present study has reduced the genetic gain of Jersey cows.
Heritability values for fertility traits were very lower than other Jersey breeds in the world in which traits in this study are affected by unknown environments. The smaller genetic contribution and higher environmental condition for fertility traits showed that the expected genetic progress should be achieved through selection and improving management levels. We could not successful in the current breeding program that undertaken on Jersey cows as the herd was influenced by unfavorable environment and no/lower selection pressure. As animal breeders who targeted to maximum genetic gain, we must design any alternative breeding methods to optimize genetic gain and keep the Jersey cows more productive.
Acknowledgment
This study was done by using long-term Jersey herd data at Adea Berga Jersey herd improvement center. The authors are grateful to Adea Berga research staff.
Figures and tables from the paper
| Number | Pedigree characteristics | Number of records |
|---|---|---|
| 1 | Number of animal IDs in the pedigree file | 1671 |
| 2 | Number of animal after pruning | 1284 |
| 3 | Number of animals without offspring | 649 |
| 4 | Number of animals with offspring | 635 |
| 5 | Number of animals with unknown sire | 368 |
| 6 | Number of animals with unknown dam | 498 |
| 7 | Number of animals with both parents unknown | 297 |
| 8 | Number of sires with progeny in the data | 107 |
| 9 | Number of dams with progeny in the data | 528 |
| 10 | Number of animals with paternal grandsire | 0 |
| 11 | Number of animals with paternal grand dam | 0 |
| 12 | Number of animals with maternal grandsire | 619 |
| 13 | Number of animals with maternal grand dam | 566 |
Table text extracted from the original PDF; superscript letters are shown inline. The original table image is below.
View original table image
References
19 in the original paper- Dickerson GE. Efficiency of animal production molding the biological components. Journal of Animal Science 1970;30: 849-859.
- Suhail SM, Ahmad I, Hafeez A, Ahmed S, Jan D, et al. Genetic study of some reproductive of Jersey cattle under subtropical conditions. Sarhad J. Agric 2010;26(1):87-91.
- Fernando PRP, Sinniah J, Thatchaneshkanth S. Productive and Reproductive Performance of Jersey Cattle in the Hill Country of Sri Lanka. Global Veterinaria 2016;17(4):392-400. DOI:10.5829/idosi.gv.2016.392-400.
- Cunningham EP, Syrstand O. Crossbreeding Bos indicus and Bos taurus for milk production in tropics. 1987; FAO (Food and Agricultural Organization of the United Nation). Animal Production and Health paper No. 68, Rome, Italy.
- Jersey US. American Jersey Cattle Association. Reynoldsburg: National All-Jersey Inc 2014.
- Yao C, Weigel KA, Cole JB. Genetic evaluation of stillbirth in US Brown Swiss and Jersey cattle. Journal of Dairy Science 2014;97:2474-2480. https://doi.org/10.3168/jds.2013-7320.
- Stocco G, Cipolat-Gotet C, Bobbo T, Cecchinato A, Bittante G. Breed of cow and herd productivity affect milk composition and modeling of coagulation, curd firming, and syneresis. Journal of Dairy Science 2017;100:129-145. https://doi.org/10.3168/jds.201611662.
- Nieuwhof GJ, Norman HD, Dickinson FN. Phenotypic trends in herd life of dairy cows in the United States. Journal of Dairy Science 1989;72:726-736. https://doi.org/10.3168/jds.S0022-0302(89)79166-9.
- Jersey US. Why Jersey. 2016; http://www.usJersey.com/Portals/0/AJCA/2Docs/WhyJer seys2016.
- Olson KM, Cassell BG, Hanigan MD. Energy balance in first-lactation Holstein, Jersey, and reciprocal F1 crossbred cows in a planned crossbreeding experiment. Journal of Dairy Science 2010;93:4374-4385. https://doi.org/10.3168/jds.2010-3195.
- Kumar UA, Gawande P, Sahatpure SK, Patil MS, Lakde CK, et al. Assessment of semen quality in pure and crossbred Jersey bulls. Veterinary World 2015;8:12661272. https://doi.org/10.14202/vetworld.2015.1266-1272.
- Jersey Canada. Jersey history and Jersey Canada, Jersey owner's manual 2015, 80. www.Jerseycanada.com.
- Hunde D, Mészáros G, Dessie T, Assefa G, Tadesse M, et al. Milk yield and reproductive performance of pure Jersey dairy cattle in the Central Highlands of Ethiopia. Livestock Research for Rural Development 2015; 27, Article #130. Retrieved October 14, 2020, from http://www.lrrd.org/lrrd27/7/hund27130.htm.
- Habtamu Lemma, Kelay Belihu, Desie Sheferaw. Study on the reproductive performance of Jersey cows at Wolaita Sodo dairy farm, Southern Ethiopia. Ethiopian Veterinary Journal 2010;14(1):53-70.
- Campos MS, Wilcox CJ, Becerril CM, Diz A. Genetic Parameters for Yield and Reproductive Traits of Holstein and Jersey Cattle in Florida. Journal of Dairy Science 1994;77:867-873.
- Musani SK, Mayer M. Genetic and environmental trends in a large commercial Jersey herd in the central rift valley, Kenya. Tropical Animal Health and Production 1997;29:108-116.
- Anshuman K, Ajoy M, Gupta AK, Karunakaran M, Das SK, Dutta TK. Genetic analysis of fertility traits in Jersey crossbred cows Indian Journal of Animal Research 2018;52(8):1113-1118.
- Vinothraj S, Subramaniyan A, Venkataramanan R, Joseph C, Sivaselvam SN. Genetic evaluation of reproduction performance of Jersey × Red Sindhi crossbred cows. Veterinary World 2016;9(9):1012-1017.
- Njubi D, Rege JEO, Thorpe W, Collins-Lusweti E, Nyambaka R. Genetic and Environmental Variation in Reproductive and Lactation Performance of Jersey Cattle in the Coastal Lowland Semi humid Tropics. Tropical Animal Health and Production 1992;24:231-241.