
Research article · 2018 · Full text
International Journal of Agriculture Extension and Social DevelopmentFarmers’ perception and practice on the shift from free grazing to zero grazing of livestock: lessons from learning watersheds of Western Amhara, Ethiopia
Volume 1(1) · Pages 26–34 · DOI: 10.33545/26180723.2018.v1.i1a.77 ↗
Research areasRangeland Management and Livestock Ecology
Abstract
Author-writtenIn addition to livestock feed shortage, free grazing contributes more for soil erosion and land degradation. Zero grazing or stall feeding is one of the feeding systems that prevent the above problem. The main objective of the study was to assess farmers’ perception on the disadvantages of free grazing and to assess farmers’ perception on the advantages of zero grazing of livestock. The study was conducted in the selected Watersheds of West Gojjam Zone, Amhara Region. A total of 200 households were selected for interview by using systematic random sampling technique. Data analysis was done by using descriptive statistics of mean, mode, standard deviation and frequency. Inferential analysis of independent sample t-test and chi-squared tests were done to test mean and occurrence comparison among adopter and non-adopter farmers of zero grazing system. Likert scale was used to scale and quantify the level of farmer’s perception. The research result revealed that there is a good understanding and perception on the disadvantages of free grazing and the advantages of zero grazing. There are also challenges of zero grazing implementation which were shortage of land for private grazing and feed production and shortage of animal power source for crop production. On the other hand the Watershed development created an opportunities for the production of improved feed at different niches, government focus on the cross breeding, experience of livestock sharing and availability of ground water. Adoption of zero grazing can be successful without any enforcement mechanism, by increasing training and awareness creation works on the zero grazing, increasing forage and water availability, improving local livestock breed and increasing farm mechanization for crop production should be planned and implemented.
Summary
Source-checkedPlain-language reading of the full paper, prepared with AI and checked against the text. Each point links to the authors' own words.
Why it matters
- Free grazing of livestock is associated with feed shortages and contributes to land degradation and soil erosion. View evidence ↗
- Zero grazing, or stall feeding, is a system that can mitigate land degradation, improve livestock productivity and fodder quality, and reduce disease spread and inbreeding. View evidence ↗
The question
- The study aimed to evaluate how farmers perceive the disadvantages of free grazing and the advantages of zero grazing. View evidence ↗
What they did
- The research was conducted in the Aba Gerima and Debreyakob watersheds within the West Gojjam zone of the Western Amhara Region. View evidence ↗
- A sample of 200 households was selected for interviews using a systematic random sampling technique. View evidence ↗
- Data were analyzed using descriptive statistics (mean, mode, standard deviation, frequency) and inferential tests, including independent sample t-tests and chi-squared tests, to compare adopters and non-adopters of zero grazing. View evidence ↗
What they found
- Adopters of zero grazing held significantly fewer cattle on average (3.33 ± 1.77) compared to non-adopters (4.07 ± 2.55). View evidence ↗
- Crop residues were the most common feed source for all households (99.5%), followed by local brewery byproducts (brint 90%, atela 36.5%) and grass hay (46%). View evidence ↗
- Feed availability varied by season, with peak scarcity occurring from April to early June for 14.4% to 53.5% of households. View evidence ↗
- Nearly half of the farmers (49.7%) perceived that communal grazing areas had decreased in size. View evidence ↗
- Farmers strongly perceived free grazing as a cause of soil erosion, with 84.5% strongly agreeing and a mean Likert scale value of 4.8. View evidence ↗
- A majority of farmers (69% strongly agree, 26% agree) believe that free grazing facilitates the expansion of animal diseases. View evidence ↗
- Farmers perceived zero grazing as superior for livestock productivity, with 72% strongly agreeing and a mean Likert value of 4.56. View evidence ↗
- Many farmers (62.5% strongly agree) believe that zero grazing can be implemented by reducing the number of livestock to match available feed. View evidence ↗
What it means
- The authors conclude that free grazing is more disadvantageous to both the environment and livestock productivity than zero grazing. View evidence ↗
- The authors recommend increasing training, improving forage and water availability, introducing improved breeds, and increasing farm mechanization to facilitate the adoption of zero grazing. View evidence ↗
Visual summary
3 visualsIllustrations explain the paper; charts are replotted from the paper's own table values.
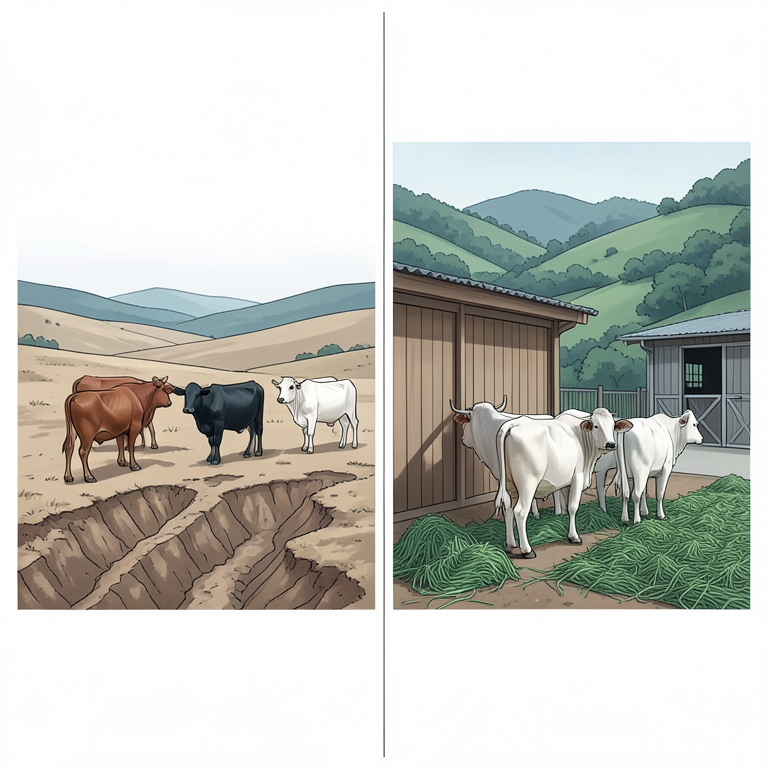
Comparison of Grazing Systems
AI-generated conceptual illustration (Ethiopian highland cattle). It explains the idea and does not show study data.
View source evidence ↗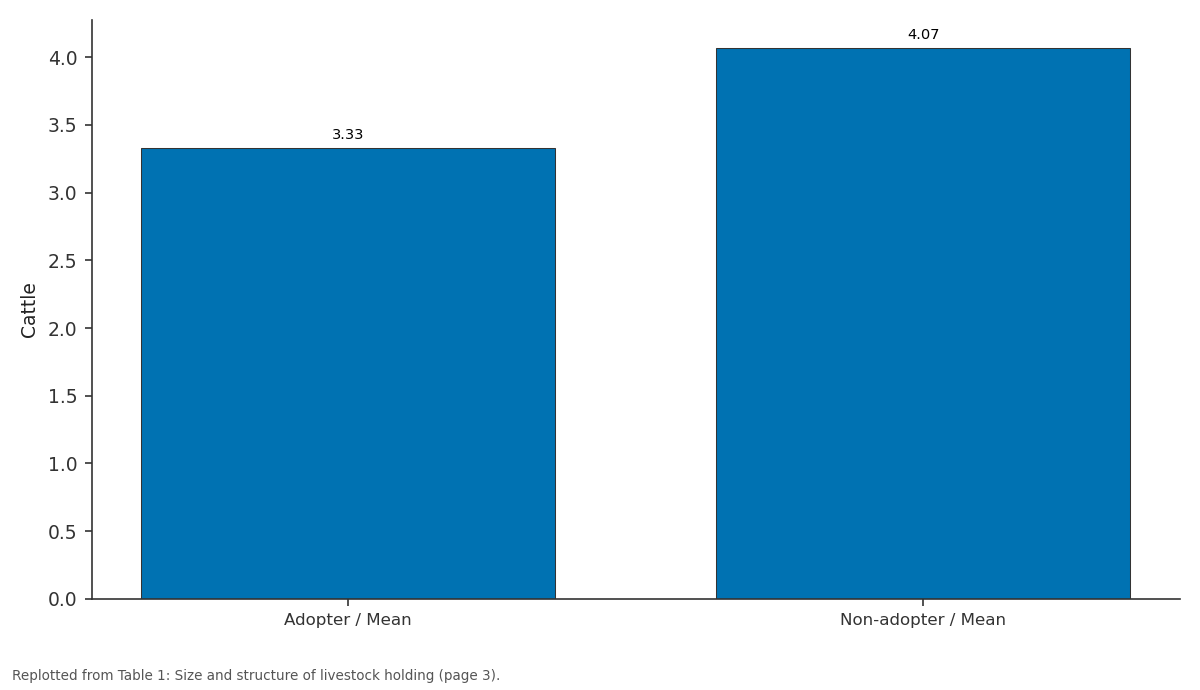
Cattle: Adopter / Mean vs Non-adopter / Mean
Replotted from Table 1 (page 3) of the original paper. Every bar is the paper's own table value.
View source evidence ↗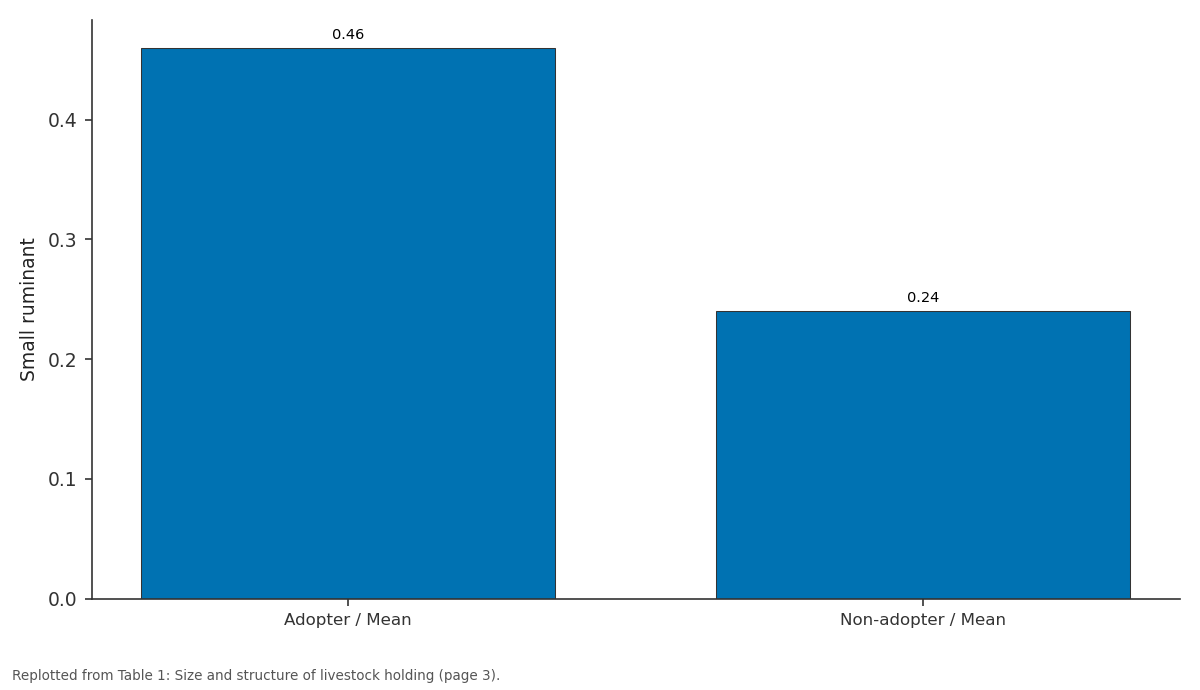
Small ruminant: Adopter / Mean vs Non-adopter / Mean
Replotted from Table 1 (page 3) of the original paper. Every bar is the paper's own table value.
View source evidence ↗Figures & tables
From the original paper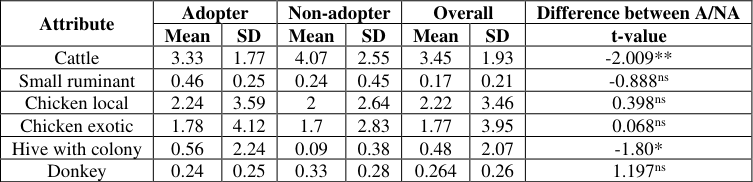 Table 1
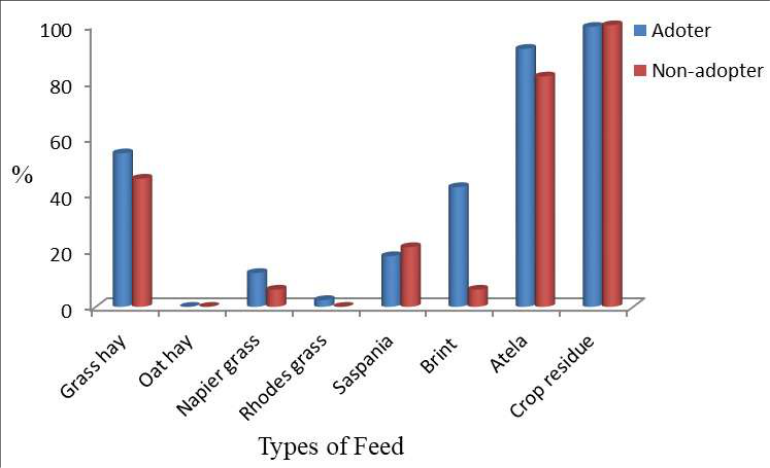 Figure 1
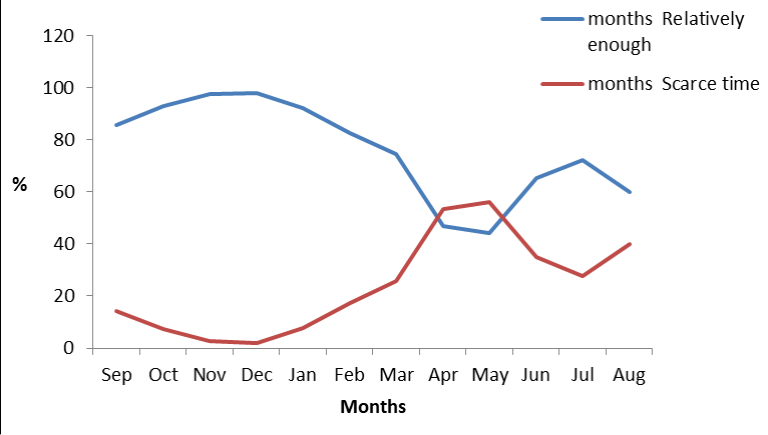 Figure 2
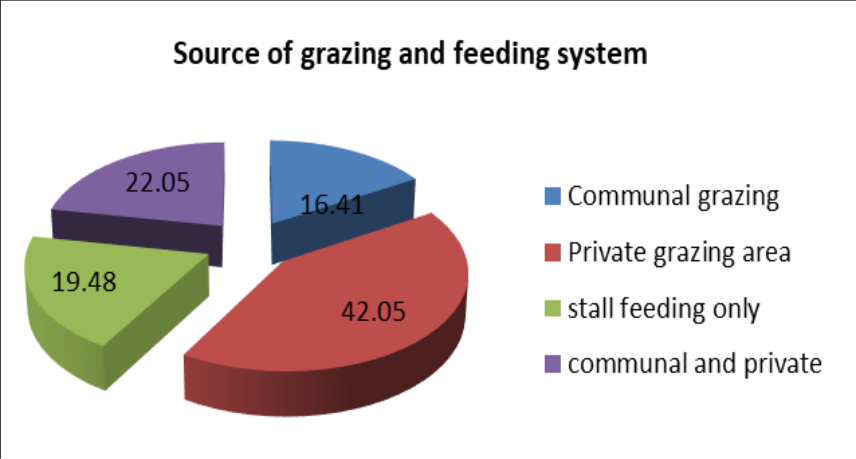 Figure 3
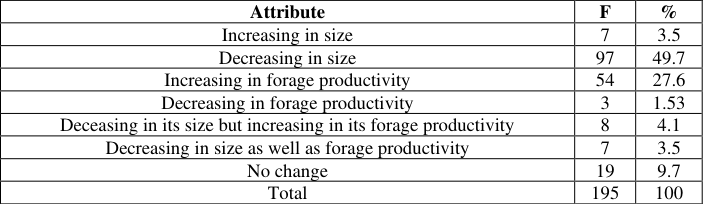 Table 2
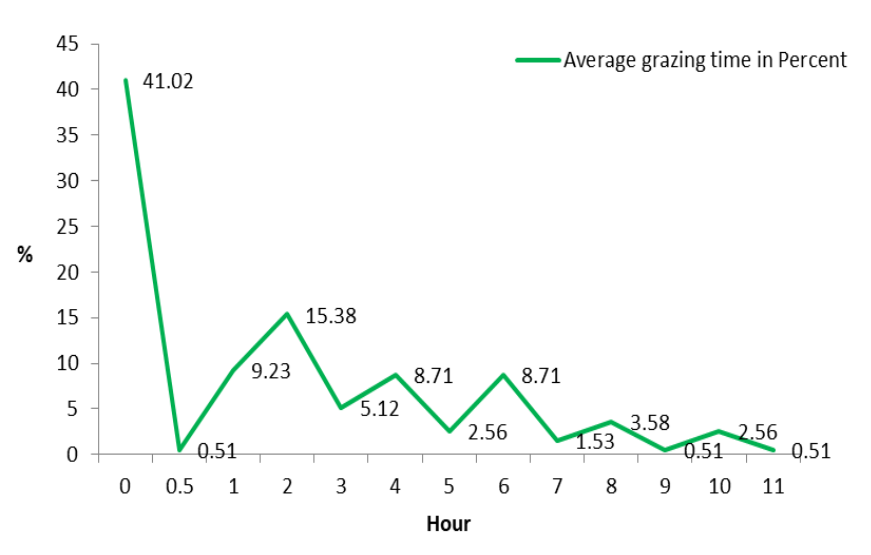 Figure 4
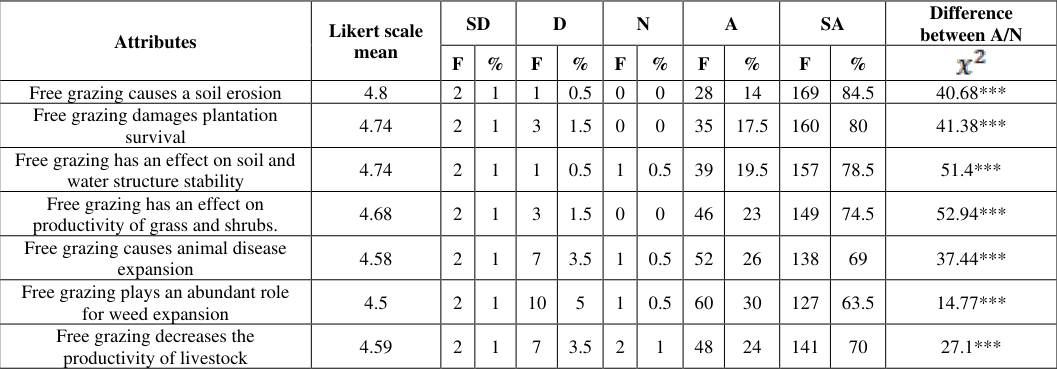 Table 3
 Table 4
Introduction
Ethiopia has a largest cattle population in Africa with the estimated population size of 57.83 million cattle, 28 million sheep, 28.6 million goat, 1.23 million camel, 60.5 million poultry, 2.1 million horses, 0.4 million mule and 7.88 million donkey (CSA, 2016) [12] . While there is abundant livestock population, because of population growth, rising income and urbanization, the demand for livestock products such as milk, meat and egg become increased and not satisfied in Ethiopia (Smith, 2013) [16] . On the other hand the production and productivity of livestock is very low due to different reasons. Among various reasons, shortage of feed both in quality and quantity was the major problems that affect the overall livestock product and productivity (Adugna Tolera et al., 2012) [1,2] . The dominant source of feed is natural pasture, improved forage and browse with its different nutritive values (CSA, 2012) [10] . The country's total area of grazing land is estimated about 61 to 65 million ha, of which 12% hectare is found in mixed farming system and the rest is found in pastoral areas (Alemayehu sMengitu, 1998) [5] . The feed sources gained from grazing lands are communally owned and administered by the community (Gebremedihin Sintayehu et al., 2013). Even the availability and quality of feed depended up on the agro-ecology, the type of crop produced, accessibility and production system was different across areas (Ahmed Hassen et al., 2009). The use and status of communal and private grazing lands as a livestock feed resources has been declined overtime (Benin et al., 2003) [7] . The main reason for depletion of grazing land is free grazing of animals under the natural condition. Free grazing of animals means free scavenging of livestock without any time and space restriction. In addition to feed shortage, free grazing contributes more for soil erosion and land degradation (Alemayehu Mengistu, 2006) [4] . To solve such problems different methods of feed production and management system has been promoted especially in developed watershed areas of Amhara Region and other parts of the country (Malede Birhan & Takele Adugna, 2014). Zero grazing or stall feeding is one of the feeding systems that prevent the livestock from free grazing (Wilson, 2014) [20] . Zero grazing also helps to address the issues of land degradation, low productivity of livestock, low quality and quantity of fodder, disease expansion and inbreeding between free grazing livestock. In Amhara Region, zero grazing system mainly implemented through enclosing the communal grazing lands and putting communal enforcement measures/community by-laws on livestock owners in order to enforce them to www.extensionjournal.com keep their animals indoor and to practice animal feeding through cut and carry system. However, there is high challenge and cost on the implementation of zero grazing. Because farmers' perception towards free grazing and zero grazing system do not further studied and improved (McCarthy et al., 2001). Farmers' perception and practices on the implementation of zero grazing system was not well documented. This research identified the major positive and negative factors that contribute to the implementation of zero grazing in the selected learning watershed areas of western Amhara Region. Therefore, this study was conducted to assess the issues raised by the farmers' and different development practitioners, related to zero grazing and free grazing systems in the selected learning watershed areas.
Objectives ▪ To Assess farmers' perception on the disadvantages of free grazing and ▪
To Assess farmers' perception on the advantages of zero grazing in watersheds ▪ To identify the available feed types in the selected areas
Research Methodology Description of the Study Areas
The study was conducted in the selected two watersheds of Western Amhara Region. The watersheds were namely Aba Gerima and Debreyakob which is located in west Gojjam zone, Amhara region. The Watersheds were established in 2012 G.C by Water and land Resource Center project (WLRC) to undertake research-supported, participatory, integrated watershed development to combat land degradation and achieve sustainable land management (WLRC, 2012) [21] .
Sampling Procedure
Multi-stage sampling technique was used to select representative study sites and respondents. From western Amhara Region, West Gojjam was selected purposively because out of the (Water and Land Resource Center project) watersheds in the Region five of them are found in these zones which are trying to implement zero grazing system for above five years. From those learning watersheds in the Zone, two watersheds were selected randomly using lottery method, namely Aba Gerima and Debre Yakob. Abagerima watershed covers two kebeles namely Laguna and Gombat kebeles. Whereas, Debreyakob watershed covers relatively small numbers of villages and remain in one kebele. Then three villages were selected from each kebeles because of considering the communal grazing land holding at village level from two watersheds. The villages were selected purposively based on their experience of involving in watershed development program in learning watershed. Finally, from each village, farmers' were selected using systematic random sampling from the sampling frame. The number of farmers' in the village was determined using the formula of Yamane (1967) to minimize availability of error and bias during sample determination selection for the study. The formula for sample determination was described as follows:-n=Sample drawn from the total households of the woreda N=Total households of the two watershed e=Error tolerated for the study (9) The sample equality for each watershed was the returned sample from the total interview but Aba Gerima watershed has a larger population than D/Yakob.
Methods of Data Collection
Qualitative and quantitative types of data were used. The source of secondary data was from government and NGO reports, different published and unpublished reports, scientific journals, and proceedings from online source and from different office libraries and individuals resources. The nature of collected data was about the trend and number of livestock hold in the study area, source of feed and feeding management, different efforts made through scientific techniques, methods and official decisions to improve livestock and feed management.
Methods of Data Analysis
The collected data was coded, entered and managed by SPSS (Version 20). Descriptive statistics was also conducted by the software and results were presented through mean, mode, standard deviation and frequency. Statistical tests of independent sample t-test and chi-squared tests were done to test mean and occurrence comparison purpose among adopter and non-adopter farmers of zero grazing system. Farmers' perception data which was collected by using five point likert scale measurement was analyzed by using frequency and non-parametric test of Chi-square test to know the difference between adopter and non-adopter farmers of zero grazing system. Before running the Chisquare test, item reliability test (Cronbach's alpha test) was done to know the inter reliability of questions or statements (Harry et al., 2012). Average likert scale value was established after summation of the rates for each statements and it was considered to measure to which individuals are a part. Then the chi-square test was done to know which type of people more perceived the dis-advantage of free grazing and advantages of zero grazing in their farming system.
Results and Discussions Livestock Holding and Production Practice
From a total sampled household, one farmer owns on average 3.45±1.93 cattle, 0.17±0.21 small ruminant, 2.22±3.46 local chicken, 1.7±3.95 exotic chicken, 0.48±2.07 hive with colony and 0.26±0.26 equine with TLU converted value (ILRI, 2013) [14] . Zero grazing system adopter households have an average of 3.33±1.77 cattle, 0.46±0.25 small ruminant, 2.24±3.59 local chicken, 1.78±4.12 exotic chicken, 0.56±2.24 hive with colony and 0.24±0.25 equine. Also non-adopter households have an average of 4.07±2.55 cattle, 0.24±0.45 small ruminant, 2±2.64 local chicken, 1.7±2.83 exotic chicken, 0.09±0.38 hive with colony and 0.33±0.28 equine. There is a significant mean difference between the adopter and non-adopter farmers in cattle and hive holdings with (p<0.05 and P<0.01) respectively (Table 1). www.extensionjournal.com Cattle holding of adopter households were less than nonadopters which have a good contribution for crop production. It's because about 91% adopter households minimized their livestock number. This is used to fit the number of livestock with the available feed resource. The result of Agraw Amanie et al., (2016) [3] , which was studied in the same watershed shows feed gap between the available livestock number and available feed.
| Attribute | Adopter | — | Non-adopter | — | Overall | — | Difference between A/NA |
|---|---|---|---|---|---|---|---|
| Mean | SD | Mean | SD | Mean | SD | t-value | |
| Cattle | 3.33 | 1.77 | 4.07 | 2.55 | 3.45 | 1.93 | -2.009** |
| Small ruminant | 0.46 | 0.25 | 0.24 | 0.45 | 0.17 | 0.21 | -0.888ns |
| Chicken local | 2.24 | 3.59 | 2 | 2.64 | 2.22 | 3.46 | 0.398ns |
| Chicken exotic | 1.78 | 4.12 | 1.7 | 2.83 | 1.77 | 3.95 | 0.068ns |
| Hive with colony | 0.56 | 2.24 | 0.09 | 0.38 | 0.48 | 2.07 | -1.80* |
| Donkey | 0.24 | 0.25 | 0.33 | 0.28 | 0.264 | 0.26 | 1.197ns |
Table text extracted from the original PDF; superscript letters are shown inline. The original table image is below.
View original table image
Major Livestock Feed Sources and Utilization Practices
The major feed sources in the mixed farming system of two watersheds were communal and private grazing lands, crop residues, grass hay, alcohol residues (brint and atela), and improved forages (Napier grass, saspania and Rhodes). Due to shortage of land, improved forage species were not more expanded by farmers.
Access and source of feeds to livestock were 99.5% crop residue, 46% grass hay, local brewery byproduct (90% brint and 36.5% atela), 11% Napier grass, 18.5% Saspania and 2% Rhodes for all sampled households. Access and source of livestock feed as a feed sources for adopter households were 99.4% crop residue, 54.5% grass hay, local brewery byproduct (42.5% brint and 91.6% atela), 12% Napier grass, 18% Saspania, and 2.4% Rhodes. Also Access and source of livestock feed as a feed sources for non-adopter households were 100% crop residue, 45.5% grass hay, local brewery byproduct (6.1% brint and 81.8% atela), 6.1% Napier grass and 21.2% Saspania (Fig. 1).
Crop residues and roughages were the major feeds in the dry season, but it has a poor quality. Improving of this feed source to increase its palatability and nutritive value was essential to increase the productivity of livestock. But majority households (98%) have no experience of improving the palatability and quality of crop residues. Feed sources and types were in line with the identified feed sources and types by study of Agraw Amanie et al., (2016) [3] in the same watersheds. Also the feed types and feed sources of the Region was agreed with this result (ALA, 2017; CSA, 2016; Adugna Tolera et al., 2012) [12,1,2]
Feed Availability across Seasons
Llivestock feed was enough for 85.6% and 74.4% households from September to half March respectively. But for 14.4% and 25.6% households have a feed scarcity from September to March respectively. Then from April to first June there was a peak feed scarcity time for (14.4% and 53.5%) households. During the feed scarcity time the farmers purchased additional feed for their livestock both at formal and informal feed markets (Fig. 2).
According to the FGD, its due to the rainy season is not started in this month's fully. When the rainy season started the green grass and weeds reached (Fig. 6). According to the results of Adugna Tolera et al., (2012) [1,2] , Berhanu Gebremedihin et al., (2009) [9] and Dehininet gizie, (2008), to get full livestock production potential of the animals, from livestock get enough feed at every time when needed was the key issue. Food security for animals should be assured at least all year round. www.extensionjournal.com Major Livestock Grazing Sources In the study watersheds there are two types of grazing sources, communal and private grazing sources. From the total sampled households only 16.41% have free grazing access and use of communal grazing lands for their livestock. The rest 42.05%, 22.05% and 19.48% households have a private grazing land, restricted communal and private grazing land and zero grazing/stall feeding source respectively (Fig. 3). The average distance of the communal grazing land was 17.5 minute on foot from household's resident.
During FGD, farmers and experts understood that, freely grazed communal grazing areas have no enough feed sources and it's not balanced with the number of animals or stock. Because of it animals unable get enough feed.
According to the conclusion of (MoA, 2011, Benin et al., 2012 and Abera Adie, 2006) [15,8] , grazing areas unable to fulfil feed requirements of animals all year round. From a total sampled households 49.7%, 1.53% and 3.5% households observed that communal grazing areas decreased in its size only, forage productivities only and decreased both in its size and forage productivities respectively. On the other side about 3.5% and 27.69% households have an observation and perception of grazing areas become increasing in its size and forage productivity respectively. The other households' (4.1%) understands that our communal grazing areas become decreased in its size but increased in its forage productivity. The rest interviewed households did not see any change on the status of communal grazing areas since 1997 G.C (Table 2). The main reason for decrease in the communal land size was provision of the communal lands for youths. The reason for increasing forage productivity was because of watershed development the communal grazing areas are closed from free grazing.
| Attribute | F | % |
|---|---|---|
| Increasing in size | 7 | 3.5 |
| Decreasing in size | 97 | 49.7 |
| Increasing in forage productivity | 54 | 27.6 |
| Decreasing in forage productivity | 3 | 1.53 |
| Deceasing in its size but increasing in its forage productivity | 8 | 4.1 |
| Decreasing in size as well as forage productivity | 7 | 3.5 |
| No change | 19 | 9.7 |
| Total | 195 | 100 |
Table text extracted from the original PDF; superscript letters are shown inline. The original table image is below.
View original table image
The households' looks the decreasing status of free grazing areas in its size and nutritive value pushes individuals to adopt zero grazing and restrict their livestock from free grazing. According to the reports of (Teshome Abate et al., 2010 [18] , Elias Zerfu et al., 2017 and Amaha Kassahun et al., 2007) [6] , the status of grazing areas in Amhara Region as well as the country Ethiopia have been similarly decreasing.
Farmers' Perception on the Disadvantages of Free Grazing
The following statements were targeted to measure farmers' perception on free grazing. The item type statements was about the effects free grazing on soil fertility, livestock productivity, soil and water structures and plantation survival. Cronbach's alpha test has been used to measure the reliability and consistency of questions. Cronbach's alpha result showed that, the questioner was reached above acceptable reliability level above (α=0.7) which is α=0.94.
Farmers' Perception on Soil and Water Structures and Plantations
Farmers were asked to be either, strongly agreed, agreed, disagreed and strongly disagreed on the statements of "Free grazing cause's soil erosion". From the total interviewed www.extensionjournal.com households about 84.5%, 14%, 0.5% and 1% households were strongly agreed, agreed, disagreed and strongly disagreed respectively on the above statement. The overall mean scale value of the above statement was 4.8, which is above neutral response and approaches to strongly agree. The chi-square test result showed that there is a significant (P<0.01) difference between adopters and non-adopters towards the effect of free grazing on soil stability (Table 3).
| Attributes | Likert scale mean | SD | — | D | — | N | — | A | — | SA | — | Difference between A/N |
|---|---|---|---|---|---|---|---|---|---|---|---|---|
| F | % | F | % | F | % | F | % | F | % | |||
| Free grazing causes a soil erosion | 4.8 | 2 | 1 | 1 | 0.5 | 0 | 0 | 28 | 14 | 169 | 84.5 | 40.68*** |
| Free grazing damages plantation survival | 4.74 | 2 | 1 | 3 | 1.5 | 0 | 0 | 35 | 17.5 | 160 | 80 | 41.38*** |
| Free grazing has an effect on soil and water structure stability | 4.74 | 2 | 1 | 1 | 0.5 | 1 | 0.5 | 39 | 19.5 | 157 | 78.5 | 51.4*** |
| Free grazing has an effect on productivity of grass and shrubs. | 4.68 | 2 | 1 | 3 | 1.5 | 0 | 0 | 46 | 23 | 149 | 74.5 | 52.94*** |
| Free grazing causes animal disease expansion | 4.58 | 2 | 1 | 7 | 3.5 | 1 | 0.5 | 52 | 26 | 138 | 69 | 37.44*** |
| Free grazing plays an abundant role for weed expansion | 4.5 | 2 | 1 | 10 | 5 | 1 | 0.5 | 60 | 30 | 127 | 63.5 | 14.77*** |
| Free grazing decreases the productivity of livestock | 4.59 | 2 | 1 | 7 | 3.5 | 2 | 1 | 48 | 24 | 141 | 70 | 27.1*** |
Table text extracted from the original PDF; superscript letters are shown inline. The original table image is below.
View original table image
During FGD, livestock producers responded that free grazing of animals in the cropping area aggravates soil erosion through their foot and horn. This result revealed that, farmers' perception and understanding towards the negative side of free grazing leads' was important to adopt the zero grazing system. Different research results agreed on the above statement or the effects of free grazing animal on the soil erosion and land degradation (Adugna Tolera et al., 2012, Alemayehu Mengistu, 2006) [1,2,4] .
From the total sampled households, 80%, 17.5%, 1.5% and 1% households were strongly agreed, agreed, disagreed and strongly disagreed respectively on the effect of free grazing on the survival of planation. The average likert scale value for the above statement was 4.74, which is above the negative perception of the likert scale value. The chi-square test result shows a significant (P<0.01) difference between adopter and non-adopter households perception level on the effects of free grazing on plantation survival (Table 3). During FGD session there was a big dialog "if the farmers accept about effects of the free grazing on the planation why they don't adopt zero grazing". These showed that the reasons for not responding free grazing fully was lack of realization and follow up. Also result of (Adugna Tolera et al., 2012, Alemayehu Mengistu, 2006) [1,2,4] agreed on the above statement and farmers' view on the effects of free grazing on survival of plantations.
From the total sampled households about 78.5%, 19.5%, 0.5%, 0.5% and 1% households were strongly agreed, agreed, neutral, disagreed and strongly disagreed respectively on the effects of free grazing on stability of soil and water structures. The average likert scale value for the above statement was 4.74, which is above the negative value or (above three). There was a significant chi-square score (P<0.01) difference between the adopter and non-adopter households on the above statement (Table 3).
During FGD, farmers elaborated more about the negative effect of free grazing on constructed soil and water conservation structures. This effect becomes high during external parasite incidence because, animals have more contact and friction with earth. It is more destructive during rainy season when other sources of feed (e.g., growing grazing and crop residues) were finishing (Samuel & John, 2002).
Farmers' Perception on the Effects of Free Grazing on
Farmers' Perception on the Effects of Free Grazing on
Grass and Shrubs
From the total sampled households about 74.5%, 23%, 1.5%, and 1% adopter households were strongly agreed, agreed, disagreed and strongly disagreed respectively on the effects of free grazing on shrubs and grasses. The chi-square result shows a significant (P<0.01) difference between adopters and non-adopters (Table 3). The average likert scale value for the above statement was 4.68; this means the perception tends to be strongly agreed. Free grazing and over stocking destructs communal grazing areas (Elias Zerfu et al., 2017).
Farmers' Perception on the Role of Free Grazing on
Animal Disease Spread About 69%, 26%, 0.5%, 3.5% and 1% households were strongly agreed, agreed, neutral, disagreed and strongly disagreed respectively on the role of free grazing for disease transmission from one animal to other. The average likert scale value of the above statement was 4.5 which is above negative perception value of disagree and strongly disagree. There is a chi-square statistical difference between adopter and non-adopter households with the p-value of (P<0.01) (Table 3). These show that animal diseases can be increased at the grazing areas. The result of (Tadesse Birhanu, 2015) shows that the disease transfer was high between grazing animal.
Farmers' Perception on Role of Free Grazing on Weed Expansion
Of the total sampled households about 63.5%, 30%, 0.5%, 5% and 1% households were strongly agreed, agreed, neutral, disagreed and strongly disagreed respectively on the role of free grazing to expand weed from one area to other. The average likert scale value for the above statement was 4.5 which were above the negative perception. There is a statistical difference between adopter and non-adopter households of zero grazing system with the p-value of (P<0.01) (Table 3). This result shows that adopter households have a better perception and understanding on the negative side of free grazing on weed transfer. The result of the Alemayehu Mengistu et al., (2006) [4] , agreed on these result weeds are transferred through different ways among which the major one is through animal journey and dung.
Farmers' Perception on the Effects of Free Grazing on Livestock Productivity
From the total households about 70%, 24%, 1%, 7% and 1% households were strongly agreed, agreed, neutral, disagreed and strongly disagreed respectively on the negative effects of free grazing on the productivity of livestock. The average perception likert scale value was 4.59 for the above statement of "Free grazing decreases the productivity of livestock''. The non-parametric chi-square test result shows a significant (P<0.01) difference between adopter and nonadopters for the above argument (Table 3). The result implies that free grazing of animals did not give good production by itself. It's because they don't get enough feed at grazing areas, lost their energy through long journey and other integral environmental destructions may happen. This shows that if people fail to manage livestock well we fail to get effective product from animals. Productivity of livestock was mainly affected by feed requirement, in addition to the health and breed potentials. www.extensionjournal.com Among zero grazing adopter households about 72%, 19.5%, 2%, 5.5% and 1% households were strongly agreed, agreed, neutral, disagreed and strongly disagreed respectively on advantages of zero grazing system for livestock productivity. The average likert scale value for the above statement was 4.56 which were above the neutral scale value. The chi-squire result (P<0.01) confirmed that there is a significant difference between adopters and non-adopters (Table 4).
| Attributes | Likert scale mean | SD | — | D | — | NA/D | — | A | — | SA | — | Difference between A/N |
|---|---|---|---|---|---|---|---|---|---|---|---|---|
| F | % | F | % | F | % | F | % | F | % | |||
| Zero grazing has a better livestock productivity than free grazing | 4.56 | 2 | 1 | 11 | 5.5 | 4 | 2 | 39 | 19.5 | 144 | 72 | 40.19*** |
| Zero grazing did not need more labor at home | 4.42 | 4 | 2 | 15 | 7.5 | 2 | 1 | 50 | 25 | 129 | 64.5 | 44.13*** |
| Zero grazing can be implemented through minimizing number of animals | 4.42 | 3 | 1.5 | 13 | 6.5 | 6 | 26.5 | 53 | 26.5 | 125 | 62.5 | 44.99*** |
Table text extracted from the original PDF; superscript letters are shown inline. The original table image is below.
View original table image
The above result sows that, adopter households tend to strongly accept the above statement than non-adopter households, because adopter households have good access to training and information than non-adopter households.
Farmers' Perception on the Advantages of Zero Grazing to Minimize Labour Cost
From the total interviewed households about 64.5%, 25%, 1%, 7.5% and 2% households were strongly agreed, agreed, in neutral, disagreed and strongly disagreed respectively on the statement of "Zero grazing did not need more labor ". The average perception scale value for the above statement was 4.42 (Table 4). The chi-square result (P<0.01) shows a significant difference between adopter and non-adopter households on zero grazing minimizes labor for livestock management. Adopter households show a positive perception than non-adopters on the above statement.
During the FGD the farmers said that:-"Because of implementing zero grazing our animals can eat breakfast, lunch and dinar with us because we see animals nearest to us. When we need to eat our food we think about animals feed because they are in front of us"
Farmers' Perception on Means of Zero Grazing Implementation
Since the farmers were enforced to stop free grazing both at the communal and cropping lands, they started to design and implement different strategies. Among different strategies minimizing number of animals was used by farmers to solve feed shortage. From a total sampled household about 62.5%, 26.5%, 26.5%, 6.5% and 1.5% households were strongly agreed, agreed, in neutral, disagreed and strongly disagreed respectively on above means of zero grazing implementation. The mean likert scale value for the statement of ''Zero grazing can be implemented through minimizing number of animals" was 4.44. Based on the chisquare result (P<0.01) shows a significant difference between adopters and non-adopter households on the above statement (Table 4).
The above result implies that households were minimizing their animals, those who have no option to produce more feed for their desired amount of livestock. The result of Agraw Amanie et al., (2016) [3] which was in agreement with this result, which was conducted in four learning watersheds to assess feed gaps between livestock number and available feeds.
Conclusions and Recommendations Conclusion
Cattle holding of adopter household was less than nonadopters which have a contribution for crop production than other livestock specious. This is because of that the farmers minimized their animal number to fit the number of livestock with the available feed resource. There are two types of livestock housing. The first house was constructed adjacent with the main human house. The second type of house was partitioned from the main human house.
In the study watersheds a major sources of feed were communal and private grazing lands, crop residue, grass hay, local brewery by product (brint and atela), and improved forages (Napier grass, Saspania and Rhodes). The contribution of those feed resources were crop residue, grass hay, local brewery byproducts (brint and atela) and improved forages (Napier grass, Saspania and Rhodes) respectively. Crop residues and roughages were the major feeds in the dry season, but it has a poor quality.
In the study area there were enough feed from September to half March and then from April to first June there was a peak feed scarcity. During feed shortage time farmers purchase additional feed for their livestock such as grass hay, crop residue, and local brewery by product (i.e brint and atela), concentrate (wheat bran and nuag seed cake/Fagulo) and salt with its importance order. From the above results it shall be concluded that there was a feed shortage and low level of nutritive value. Therefore improving of this feed source was essential to advance its palatability to increase the productivity of livestock. Farmers strongly agreed on the advantages of zero grazing system. The major advantage of zero grazing which was perceived by farmers were about livestock productivity, minimizes labor demand and easily implemented through minimizing the number of livestock. Generally from this objective it can be concluded that, adopter farmers have better understanding and perception about dis-advantages of free grazing and advantages of zero grazing. Generally from the above results it can be concluded that the implementation of zero grazing was mainly through enforcement. It's because of the farmers challenged accept it. The main reason for challenging to accept zero grazing was feed shortage and lack of awareness by the farmers. On the other hand there are good things that make implementation of zero grazing easy that is watershed development increases the access to feed and feed developing niches. The overall conclusion of the study is free grazing have more disadvantages both at environment and livestock productivity than zero grazing.
Recommendations
To adopt zero grazing easily, training and awareness creation on the disadvantages and advantages of free grazing and zero grazing, increasing forage and water availability, improving local breed, increasing farm mechanization for crop production.
Increasing training and awareness creation:
The result of these study shows that there is a good understanding and perception on the dis-advantages of free grazing. But there was resistance to adopt zero grazing. Because the farmers have a traditional believe, "if the livestock lives inside the house and does not refresh, there will be incidences of animal disease". Therefore, efforts should be made to enhance the level of awareness of smallholder farmers, especially on those who do not adopt zero grazing system, through intensive trainings and follow ups about the advantages and disadvantages of free grazing. Besides, experience sharing should also be arranged to the areas where zero-grazing practice is more successful in order to dissatisfy with their current free grazing practices and to more inspire to reach that success full practice.
Increasing forage and water availability:
The main determining factor of zero grazing was availability of feed.
Increasing quality feed throughout the year should be encouraged. In the learning watersheds there was a different started forage development works at different niches of land; at the gullies, soil bunds, and at the communal grazing areas integrated with water and soil conservation structures and forest development. The farmers should increase access to forage at their private grazing areas and cropping areas.
Allocating private grazing land nearest to the farmers resident is a key issues raised by the farmers during key informant interviews and FGD. Therefore individual farmers shall be encouraged to allocate their land for private grazing/refreshing areas for their livestock. Perennial forage should also be developed to nearest their residence to increase access to green forages such as saspania, tree Lucerne, pigeon pea etc.to meet their multiple needs.
In addition, water shortage is the other constraining factor to promote zero-grazing in the study areas. Farmers traveled a long distance for searching drinking water for their animals.
As the result, they could not supply adequate amount of drinking water for their animals by human labor difficult to keep. Therefore, farmers should be encouraged to dig borehole to produce water for their animals and household consumption at a possible nearest place of their resident.
Improving local breed:
The dominant livestock breed was local breed which low productive in both milk and meat production. Even though; the farmers adopted zero grazing system in some part of the study areas. They were not still receiving the full potential benefits from their livestock activities. Therefore, to maximize the benefits of zero grazing in the study watersheds, improved animal breed should be introduced and promoted. To do so, the already synchronization technique should be keep continued with organized and effective way to solve a shortage of crossbred milking cows in the study watersheds.
Figures and tables from the paper
References
20 in the original paper- Adudgna Tolera, Alemu Yami, Dawit Alemu. Livestock feed resources in Ethiopia: Challenges, Opportunities and the need for transformation: Ethiopia Animal Feed Industry Association, Addis Ababa, Ethiopia 2012.
- Adugna Tolera, Alemu Yami, Dawit Alemu Livestock feed resources in Ethiopia: challenges, opportunities and the need for transformation 2012.
- Agraw Amanie, Shigdaf Mekuriaw, Wondimeneh Mekonen, Yenesew Abebe, Adebabay Kebede, Mekonnen Tilahun et al. Assessment of locally available feed resources and feeding package www.extensionjournal.com development for ruminants in selected Watersheds of North Western Amhara Region, Ethiopia: Proceeding of the 9th Annual Amhara Regional Agricultural Research Institute Conference on Completed Socio economics and Agricultural extension Directorate Completed Activity 2016.
- Alemayehu Mengistu. Country pasture profile of Ethiopia: National pasture improvement study around small holder dairy areas. MoA Small Dairy Developemnt Project (SDDP), Addis Abeba, Ethiopia 2006.
- Alemayehu Mengistu. National pasture improvement study around small holder dairy areas. MoA Small Dairy Developemnt Project (SDDP), Addis Abeba, Ethiopia 1998.
- Amaha Kassahun, Snyman HA, Smith GN. Livestock grazing behavior along a degradation gradient in the Somali Region of eastern Ethiopia 2007.
- Benin S, Ehui S, Pender J. Policies for livestock development in the Ethiopian highlands Environment, Development and Sustainability 2003.
- Benin S, Ehui S, Pender J. Policies for livestock development in the Ethiopian highlands, Socioeconomic and Policy Research Working Addis Ababa, Ethiopia: The International Livestock Research Institute(ILRI) 2012, 41.
- Berhanu Gebremedihin, Adane Hirpa, Kahsay Berehe. Feed Marketing in Ethiopia: Results of Rapid Market Appraisal, Improving Productivity and Market Success (IPMS) of Ethiopian Farm Owners Project Working Paper 15. ILRI (International livestock research Institute), Nairobi Kenya 2009.
- CSA (Central Statistics Agency) Federal democratic Republic of Ethiopia: Statistical Abstract, Addis Ababa, Ethiopia 2012.
- CSA (Central Statistics Agency) Federal democratic Republic of Ethiopia, agricultural sample survey, Addis Ababa, Ethiopia 2014.
- CSA, (Central Statistics Agency) Agricultural sample survey report on livestock and livestock characteristics, volume II, Addis Ababa, Ethiopia 2016.
- ILRI (International Livestock Research Institute) Harnessing the genetic diversity of goats to improve productivity in Africa: University of Dschang Poster prepared for 82 ILRI APM, Addis Ababa. Ethiopia 2013. URL http://www.slideshare.net/ILRI/apm2013 accessed (Friday, November 3, 2017;5:05:21 PM)
- MoA. Agricultural Investment Potential of Ethiopia Ministry of Agriculture and Rural Development 2011.
- Smith P. Delivering food security without increasing pressure on land. Global Food Security. 2013;2(1):https://www.sciencedirect.com/science/articl e/pii/S2211912412000363 accessed (Friday, November 3, 2017, 5:05:21 PM)
- Solomon T, Snyman HA, Smith GN. Cattle-rangeland management practices and perceptions of pastoralists towards rangeland degradation in the Borana zone of southern Ethiopia: Journal of Environmental Management 2006.
- Teshome Abate, Abule Ebro, Lisanework Nigatu. Traditional rangeland resource utilization practices and pastoralists' perceptions on land degradation in southeast Ethiopia 2010.
- Wade R. The management of common property resources: collective action as an alternative to privatization and state regulation. Agricultural and Rural Development Department Discussion paper No. 54. Washington DC: The World Bank 1986.
- Wilson B. Stall-fed livestock production an efficient method to produce organic fertilizers (manure) for the conservation and improvement of soil fertility 2014.
- WLRC (Water and land resource center) Description of the learning Watersheds in Amhara Region 2012. http://walris.wlrc-eth.org/about/about_wlrc.html accessed (Tursday, June 14, 2018, 3:25:12PM)