
Research article · 2021 · Full text
International Journal of Geography Geology and EnvironmentAssessing the agricultural suitability of groundwater using SAR values in Nasrullaganj area, district Sehore, Madhya Pradesh
Volume 3(2) · Pages 78–82
Research areasGroundwater and Watershed AnalysisGroundwater and Isotope Geochemistry
Abstract
Author-writtenThe classification of irrigation waters with respect to SAR is based primarily on the effect of exchangeable sodium on the physical condition of the soil. Sodium-sensitive plants may, however, suffer injury as a result of sodium accumulation in plant tissue, when exchangeable sodium values are lower than those effective in causing deterioration of the physical condition of the soil. In the present study the SAR values for groundwater samples have been calculated to understand the suitability of groundwater in the study area. The highest value of SAR is reported to be 4.4 and the lowest value is 0.5 at two locations, the average value is 1.9. The values fall in the excellent category of Richards (1954) [4] classification, and is very suitable for the agricultural purposes.
Summary
Source-checkedPlain-language reading of the full paper, prepared with AI and checked against the text. Each point links to the authors' own words.
Why it matters
- Agriculture is the primary occupation and economic basis of India, making the study of factors like groundwater quality essential for agricultural productivity. View evidence ↗
- The Sodium Adsorption Ratio (SAR) is used to determine if water is suitable for irrigation because high sodium levels can damage soil structure and reduce permeability. View evidence ↗
- Certain sodium-sensitive plants can be injured by sodium accumulation even when levels are too low to physically deteriorate the soil. View evidence ↗
The question
- The study aims to calculate SAR values of groundwater samples to determine the agricultural suitability of water in the Nasrullaganj area. View evidence ↗
What they did
- Researchers collected and analyzed 18 groundwater samples from 18 different locations across a 158 km² area between Nasrullaganj and Rehti. View evidence ↗
- Chemical analysis of the samples was conducted at the State Regional Laboratory of the Public Health Department in Bhopal. View evidence ↗
- The SAR was calculated by measuring the relative proportion of sodium ions compared to calcium and magnesium ions in the water samples. View evidence ↗
What they found
- The highest SAR value recorded in the study area was 4.4 at the Barodiya location. View evidence ↗
- The average SAR value across all sampled locations in the study area was 1.9. View evidence ↗
- Based on Richards' classification, where values under 10 are 'Excellent', the entire study area falls into the excellent category. View evidence ↗
What it means
- The authors conclude that the groundwater quality in the Nasrullaganj area is excellent for agricultural use. View evidence ↗
- The authors note that high sodium concentrations generally lead to soil hardening and compaction, which reduces soil permeability. View evidence ↗
Visual summary
2 visualsIllustrations explain the paper; charts are replotted from the paper's own table values.
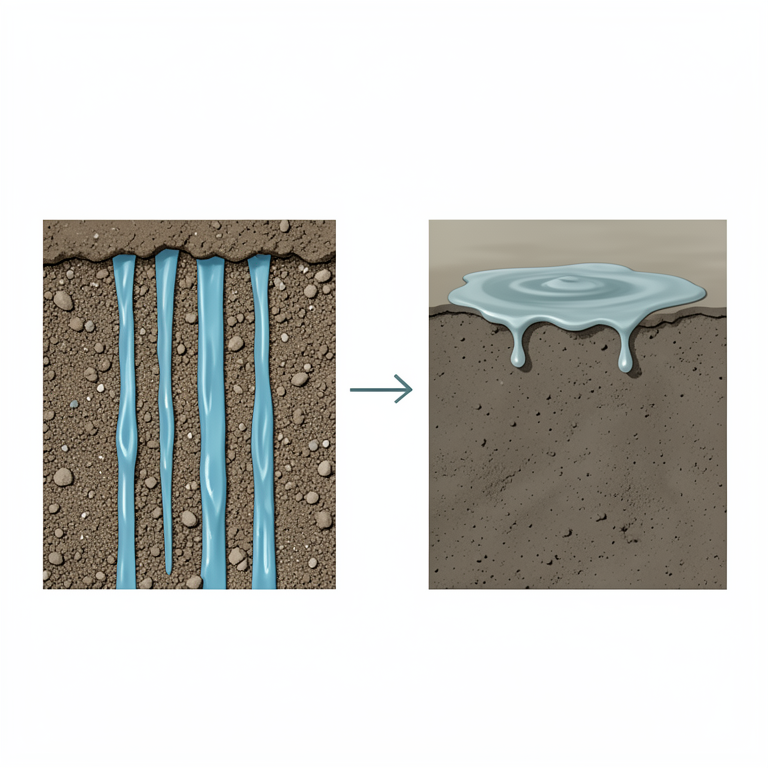
Impact of Sodium on Soil
AI-generated conceptual illustration (soil profiles with water infiltration). It explains the idea and does not show study data.
View source evidence ↗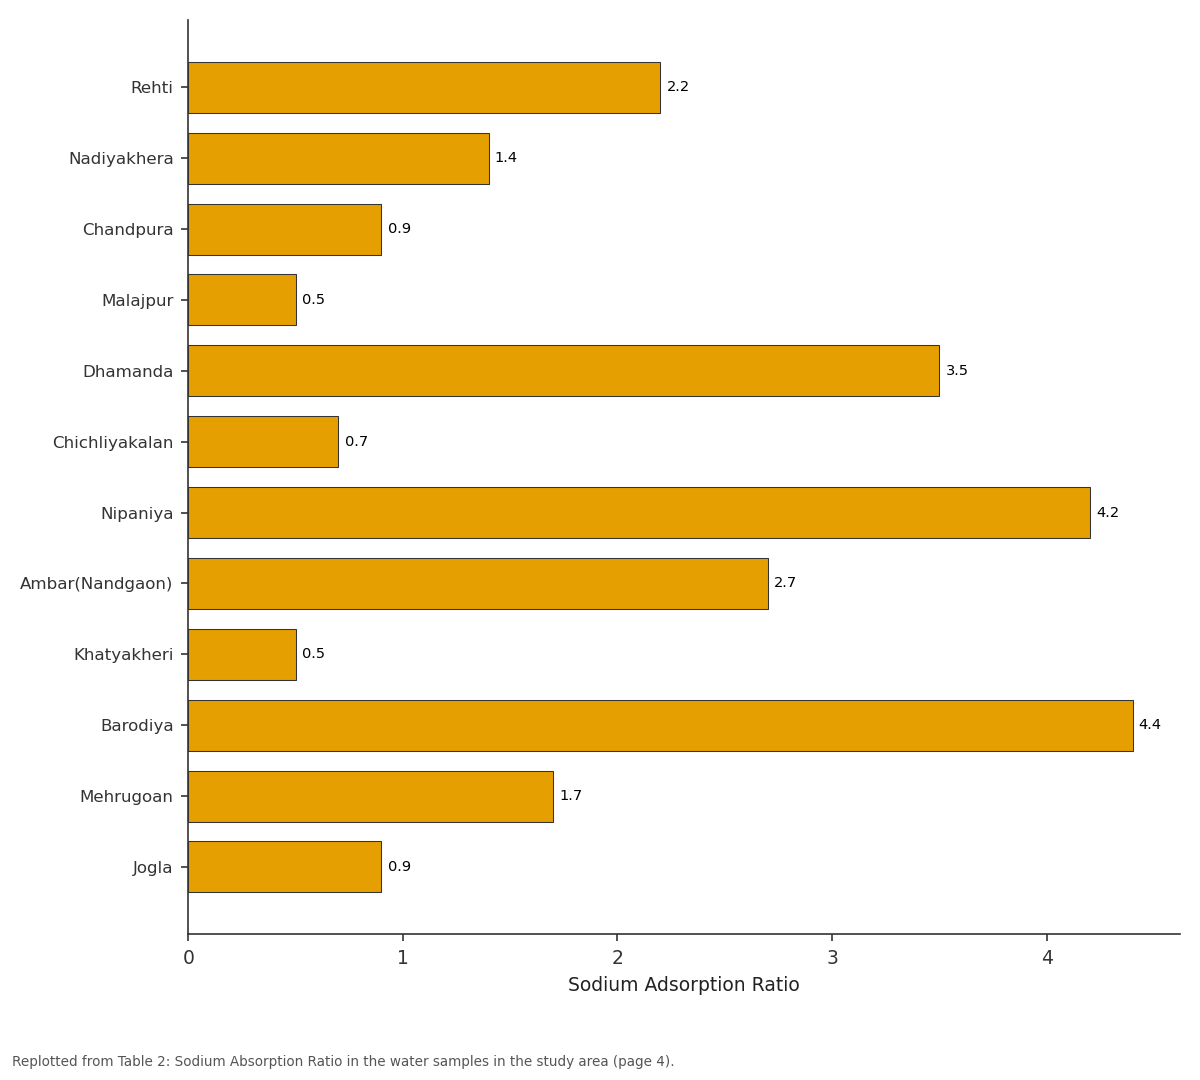
Sodium Adsorption Ratio: Rehti vs Nadiyakhera vs Chandpura vs Malajpur vs Dhamanda
Replotted from Table 2 (page 4) of the original paper. Every bar is the paper's own table value.
View source evidence ↗Figures & tables
From the original paper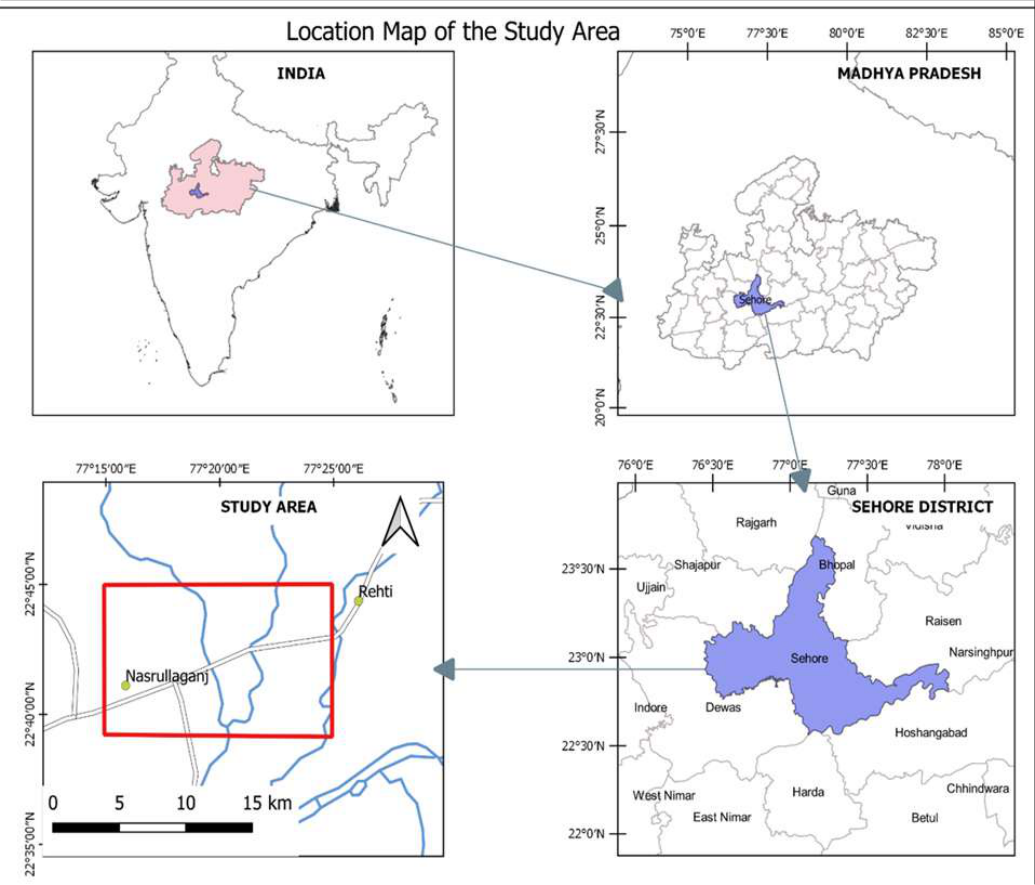 Figure 1
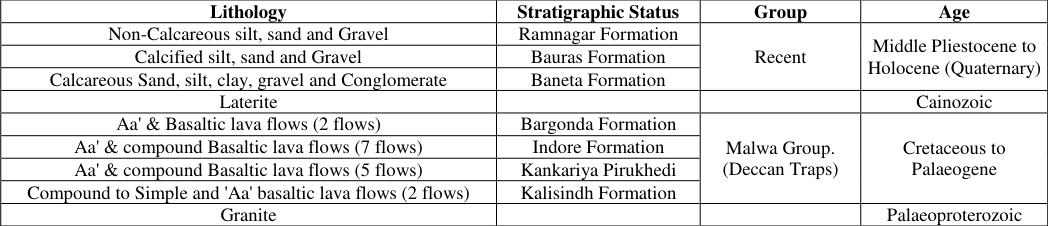 Table 1
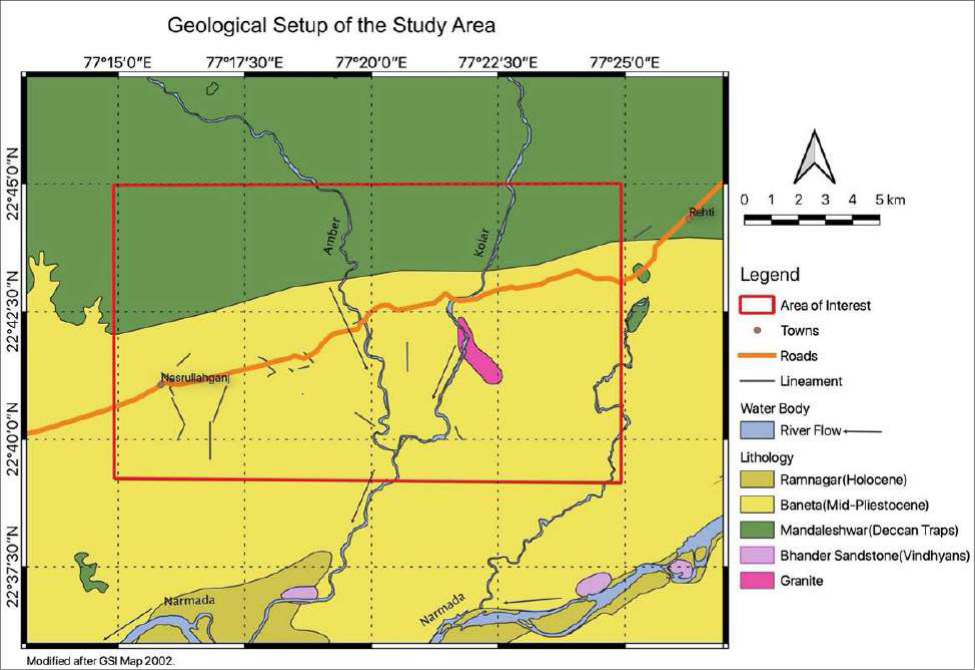 Figure 2
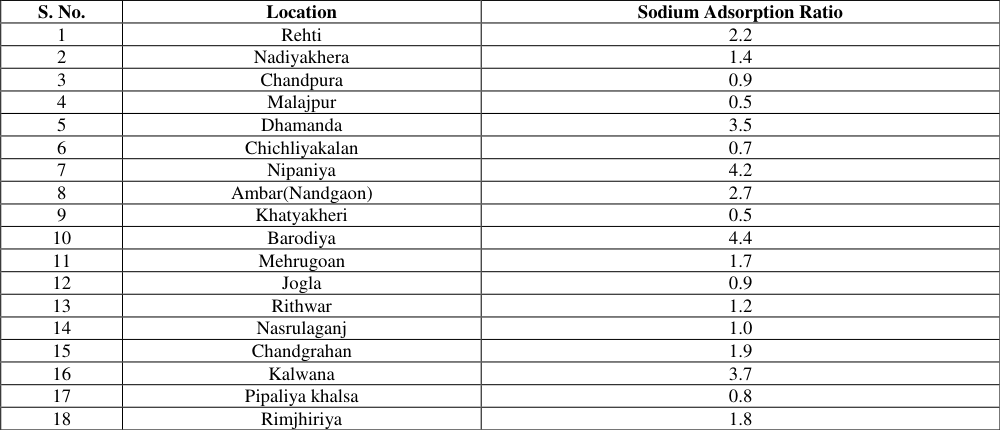 Table 2
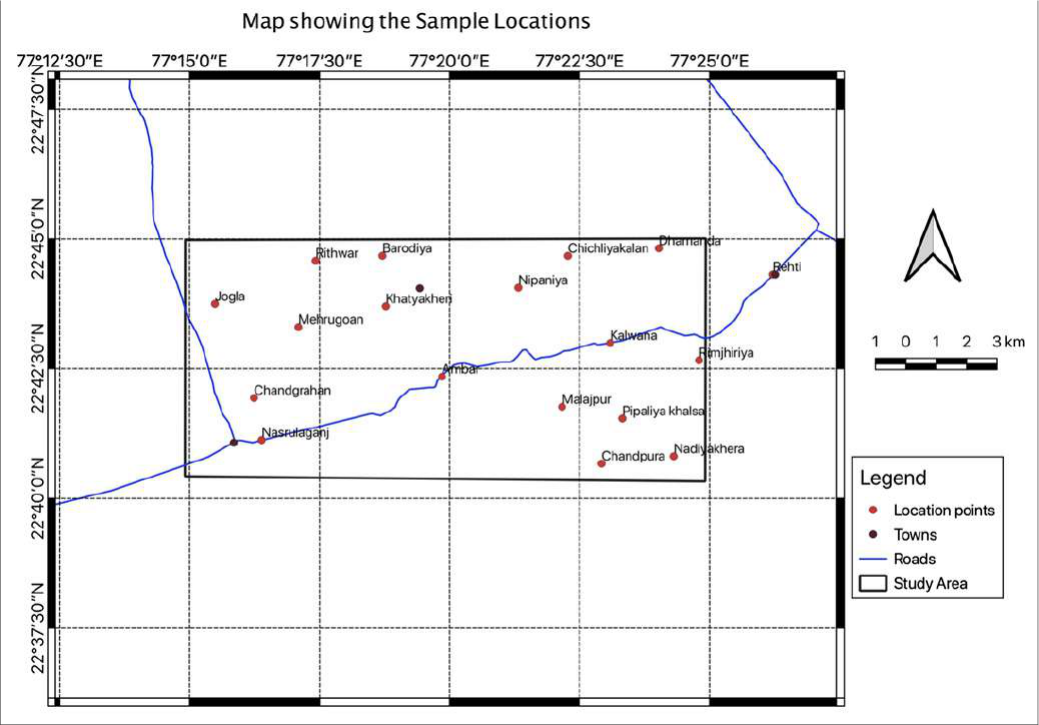 Figure 3
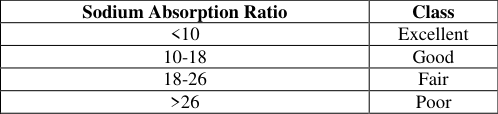 Table 3
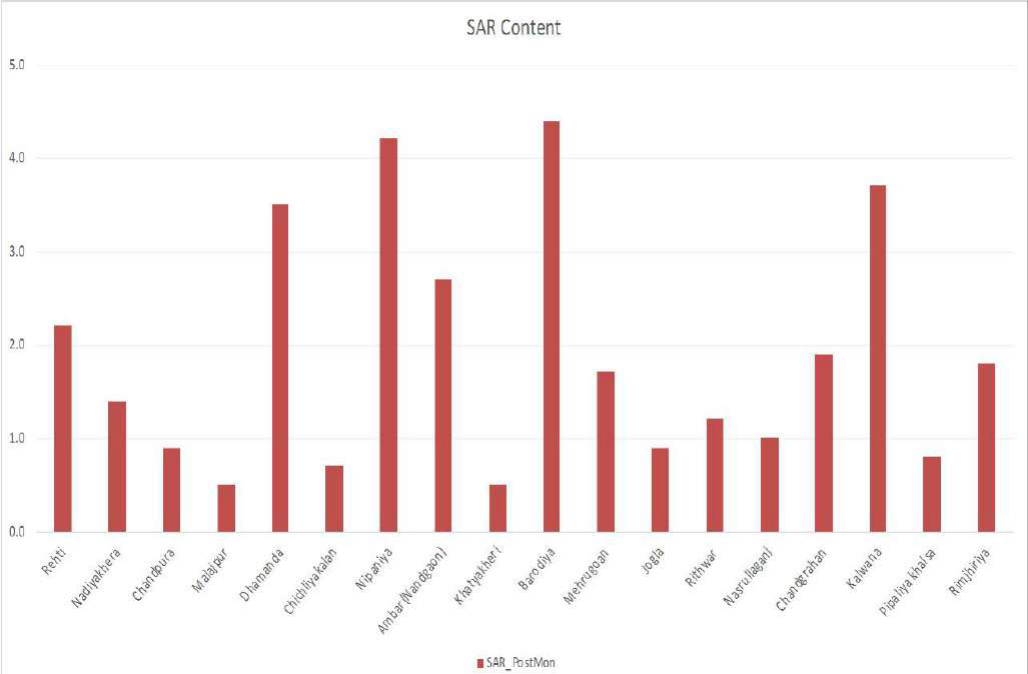 Figure 4
Introduction
India is a country, which has agriculture as its prime occupation. The country's economy is based on agriculture, hence it becomes important to understand the various factors effecting the agriculture produce like rainfall, soil types, groundwater conditions and the quality of groundwater. The quality of groundwater is a very important factor as mentioned with the other factors, various anions and cations present in the groundwater decide its quality and play important role in increasing or decreasing the agricultural produce in any area. The study of these ions and their combination, their relationship at a particular area effects the soil, groundwater and ultimately the agriculture, as a lot of areas today use groundwater as an important source of water for irrigation. As discussed about the quality of groundwater, SAR (sodium adsorption ratio) is one of the important factors that effects the agriculture of an area for sodium sensitive plants. The presence of this ion in the groundwater and its effects on the plants have been studied to understand for a long time now. Sodium adsorption ratio (SAR) is a measure of the suitability of water for use in agricultural irrigation, because sodium concentration can reduce the soil permeability and soil structure (Todd & Mays, 2005) [5] . Salinity indicates leaching of salts into groundwater. This creates a lot of problems, especially in dry climatic regions, where clayey soils occur. As the water salinity develops saline soils, this in turn affects the salt intake capacity of plants through the roots. Excess concentration of salts in agricultural fields due to loss of water through evaporation causes poor drainage conditions. These conditions decline groundwater levels up to the root zone of plants, which accumulates the salts in soil solution through capillary rise, following the water evaporation (Hem, 1985) [2] , the SAR measures the relative proportion of sodium ions in a water sample to those of calcium and magnesium (Kalra & Maynard, 1991) [3] and is calculated using the following equation:
Where the metal ions are expressed as milliequivalents per litre (meq/L)
The above formula can be expressed as below, when the metal ions are expressed as mg/L.
The study area is a part of Nasrullaganj in Sehore district, and falls on Survey of India Toposheet No. 55 F/6 and bounded by latitudes 22°40'00''to 22°45'00'' N and longitudes 77°15'00''to 77° 25'00''E and covers about a total of 158 km 2 area. Sehore is the nearest railway station and Bhopal the state capital of Madhya Pradesh is the nearest airport. The entire area can be accessed through all-weather and fair weather roads. The area of present study lies to the north of Nasrullaganj in Sehore district of Madhya Pradesh. The Location map of the study area is given in the Figure 1.
Fig 1: Location Map of the Study Area
The major settlement on the western side of the area is Joglan, whereas Rehti stands on the eastern boundary. Barodiya is the northern and Nasrullaganj is the southernmost settlement of the area covered. The study area consists of nearly 18 villages. Most of the population is dependent on agriculture and agricultural products. Geologically Granites, are the oldest rocks, overlain by Vindhyans and Deccan basalts followed by laterites and alluvial deposits in the area. The recent formations can be encountered randomly in the area. Major structure in the area is the Narmada-Son Lineament running NNE-SSW. The regional geological map of the study area is given in Figure 2. A detailed stratigraphic succession of Sehore district can be seen in the The values are plotted graphically with help of a bar graph in the Figure 4. It can be interpreted from the bar graph, the minimum value of SAR is 0.5 at two locations i.e.
Khatyakheri and Malajpur, and the maximum is 4.4 at Barodiya. The average SAR value in the study area is 1.9.
Conclusions
High sodium concentration effects the permeability of soil and also hardens the soil, which in turn increases the compaction, this eventually leads to the low permeability in soil. However, there are other factors as well such as soil texture, drainage conditions, soil type responsible for the permeability but this aspect of SAR is actually taken into account sodium sensitive plants.
The classification of irrigation waters with respect to SAR is based primarily on the effect of exchangeable sodium on the physical condition of the soil. This classification, as given by (Richards, 1954) [4] is listed in the Table 3 below. [4] . The entire area falls under the excellent category of Richards classifications and the water quality in the study area is excellent for the agricultural purposes.
| Sodium Absorption Ratio | Class |
|---|---|
| <10 | Excellent |
| 10-18 | Good |
| 18-26 | Fair |
| >26 | Poor |
Table text extracted from the original PDF; superscript letters are shown inline. The original table image is below.
View original table image
Sodium Absorption Ratio
Sodium Absorption Ratio
Figures and tables from the paper
| Lithology | Stratigraphic Status | Group | Age |
|---|---|---|---|
| Non-Calcareous silt, sand and Gravel | Ramnagar Formation | Recent | Middle Pliestocene to Holocene (Quaternary) |
| Calcified silt, sand and Gravel | Bauras Formation | ||
| Calcareous Sand, silt, clay, gravel and Conglomerate | Baneta Formation | ||
| Laterite | Cainozoic | ||
| Aa' & Basaltic lava flows (2 flows) | Bargonda Formation | Malwa Group. (Deccan Traps) | Cretaceous to Palaeogene |
| Aa' & compound Basaltic lava flows (7 flows) | Indore Formation | ||
| Aa' & compound Basaltic lava flows (5 flows) | Kankariya Pirukhedi | ||
| Compound to Simple and 'Aa' basaltic lava flows (2 flows) | Kalisindh Formation | ||
| Granite | Palaeoproterozoic |
Table text extracted from the original PDF; superscript letters are shown inline. The original table image is below.
View original table image
| S. No. | Location | Sodium Adsorption Ratio |
|---|---|---|
| 1 | Rehti | 2.2 |
| 2 | Nadiyakhera | 1.4 |
| 3 | Chandpura | 0.9 |
| 4 | Malajpur | 0.5 |
| 5 | Dhamanda | 3.5 |
| 6 | Chichliyakalan | 0.7 |
| 7 | Nipaniya | 4.2 |
| 8 | Ambar(Nandgaon) | 2.7 |
| 9 | Khatyakheri | 0.5 |
| 10 | Barodiya | 4.4 |
| 11 | Mehrugoan | 1.7 |
| 12 | Jogla | 0.9 |
| 13 | Rithwar | 1.2 |
| 14 | Nasrulaganj | 1.0 |
| 15 | Chandgrahan | 1.9 |
| 16 | Kalwana | 3.7 |
| 17 | Pipaliya khalsa | 0.8 |
| 18 | Rimjhiriya | 1.8 |
Table text extracted from the original PDF; superscript letters are shown inline. The original table image is below.
View original table image
References
5 in the original paper- APHA. Standards Methods for the Examination of Water and Wastewater. Washington: American Public Health Association 2017.
- Hem JD. Study and Interpretation of the Chemical Characteristics of Natural Water. Alexandria: Department of the Interior, US Geological Survey 1985.
- Kalra YP, Maynard DG. Methods manual for forest soil and plant analysis, Edmonton, Alberta: Northern Forestry Centre, Canada 1991.
- Richards LA. Diagnosis and Improvement of Saline and Alkali Soils, Washington: Soil and Water Conservation Research Branch, Agricultural Research Service 1954.
- Todd DK, Mays LW. Groundwater Hydrology. 3rd Edition ed. Hoboken, NJ: John Wiley and Sons 2005.
Cited by 1
From OpenAlex, OpenCitations and reference lists read by Scinovex
- Integrating stable isotopes and hydrogeochemical indices for vulnerability assessment of extensively irrigated Kala Oya basin, Sri Lanka ↗
Sivaperumaan Himanujahn, H D N Jayaweera, E.A.N.V. Edirisinghe, B.C.L. Athapattu, Morihiro Maeda, Rim Trabelsi et al. · Journal of Contaminant Hydrology · 2025
❝ 2