
Research article · 2021 · Full text
International Journal of Advanced Biochemistry ResearchThe relationship and significance between lipoprotein abnormalities and HDL dysfunction in severely obese people
Volume 5(2) · Pages 08–12 · DOI: 10.33545/26174693.2021.v5.i2a.67 ↗
Research areasAntioxidant Activity and Oxidative StressRetinal Diseases and TreatmentsGlaucoma and retinal disorders
Abstract
Author-writtenObesity and dyslipidemia may have a role in the development of cardiovascular disease. Neuropathy has also been linked to obesity. The existence of peripheral nerve injury and the presence of metabolic syndrome and lipoprotein abnormalities were evaluated in patients with severe obesity who did not have type 2 diabetes. Detailed proteomics of neuropathic and an evaluation of lipoproteins and HDL-functionality were performed on 49 patients with extreme obesity and 35 age-matched healthy controls. Compared to healthy controls, participants with extreme obesity exhibited a more excellent neuropathy symptom portfolio, lower sural and peroneal nerve impedance, aberrant temperature thresholds, heart rate with controlled breathing, and corneal nerve characteristics. People with significant obesity suffer from little nerve fiber injury. In comparison to controls, obese patients have abnormal lipoproteins and impaired HDL activity. Obese patients with minor nerve fiber injury showed significantly higher serum triglycerides, decreased PON-1 activity, and a higher frequency of obesity than those without.
Summary
Source-checkedPlain-language reading of the full paper, prepared with AI and checked against the text. Each point links to the authors' own words.
Why it matters
- Obesity and dyslipidemia are considered potential contributors to the development of cardiovascular disease. View evidence ↗
- Neuropathy associated with obesity might be caused by systemic inflammation and a decrease in the antioxidant function of high-density lipoprotein (HDL). View evidence ↗
The question
- The study aimed to evaluate lipoprotein abnormalities, metabolic syndrome, and peripheral nerve injury in severely obese patients without type 2 diabetes. View evidence ↗
What they did
- The researchers evaluated 49 patients with extreme obesity and 35 age-matched healthy controls. View evidence ↗
- Obese participants were recruited from a specialist weight management program at Salford Royal Hospital and had HbA1c levels below 44 mmol/mol (5.0%) to exclude diabetes or prediabetes. View evidence ↗
- Neuropathy was assessed using the Neuropathy Symptom Profile (NSP) and the revised neuropathy disability score (NDS), which measured vibration, temperature, and pin-prick sensitivity. View evidence ↗
- Lipid profiles, including total cholesterol, serum triglycerides, and apolipoprotein A1, were measured using standardized biochemical methods. View evidence ↗
What they found
- Obese participants had significantly higher BMI (49.3 ± 8.3 vs 26.4 ± 4.2 kg/m2) and waist circumference (133.2 ± 14.9 vs 90.5 ± 13.6 cm) compared to controls (p < 0.0001). View evidence ↗
- Obese patients exhibited significantly lower HDL-C levels (1.0 ± 0.3 mmol/l) compared to healthy controls (1.5 ± 0.4 mmol/l) (p < 0.0001). View evidence ↗
- Obese subjects showed significantly lower corneal nerve fiber density (26.7 ± 4.8 vs 39.4 ± 6.2 no/mm2), branch density (57.5 ± 25.4 vs 110.4 ± 35.1 no/mm2), and fiber length (18.4 ± 3.9 vs 29.2 ± 4.1 mm/mm2) than controls (p < 0.0001). View evidence ↗
- Obese patients with small nerve fiber injury had significantly higher serum triglycerides (1.9 ± 1.3 mmol/l) than obese patients without such injury (1.4 ± 0.7 mmol/l) (p = 0.02). View evidence ↗
- Metabolic syndrome was more frequent in obese patients with small nerve fiber injury (58%) than in those without (23%) (p = 0.02). View evidence ↗
What it means
- The authors conclude that serum triglycerides, metabolic syndrome frequency, and PON1 activity are linked to small nerve fiber injury in obese patients and could serve as therapeutic targets. View evidence ↗
Visual summary
3 visualsIllustrations explain the paper; charts are replotted from the paper's own table values.
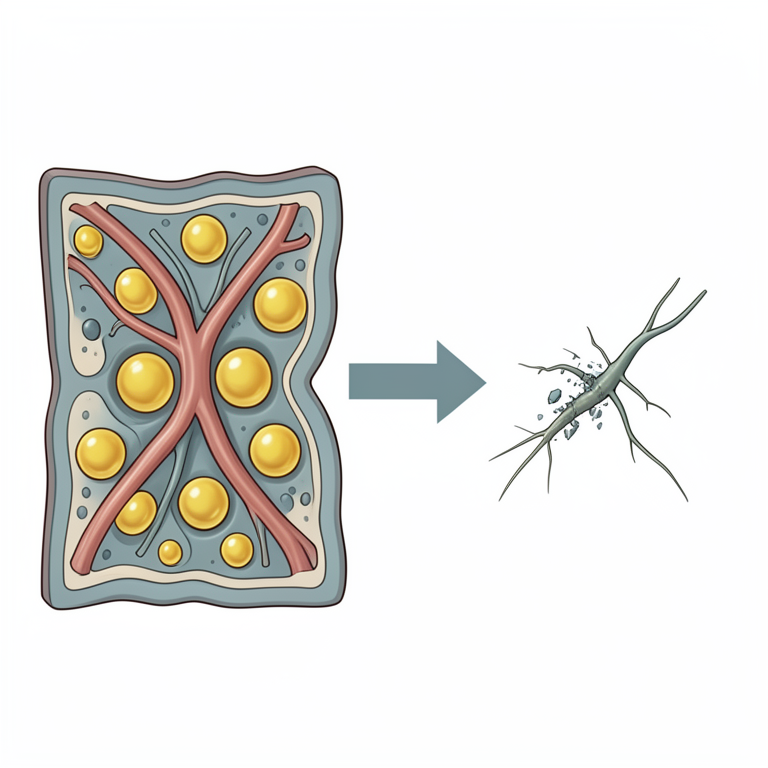
Proposed Therapeutic Targets
AI-generated conceptual illustration (human peripheral nerves and blood vessels in obese tissue). It explains the idea and does not show study data.
View source evidence ↗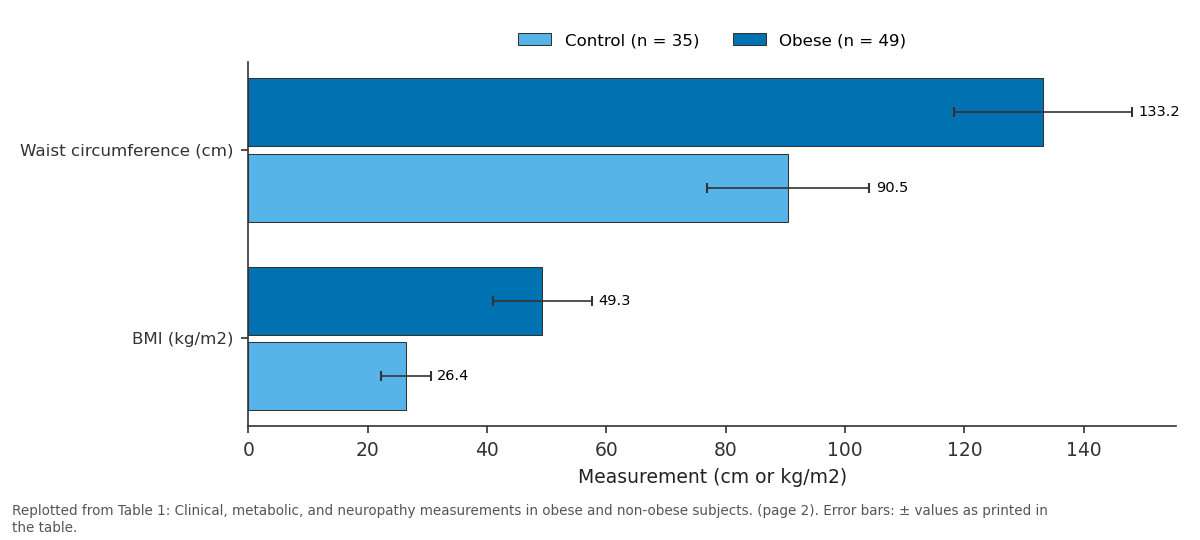
Control (n = 35) and Obese (n = 49): Waist circumference (cm) vs BMI (kg/m2)
Replotted from Table 1 (page 2) of the original paper. Every bar is the paper's own table value.
View source evidence ↗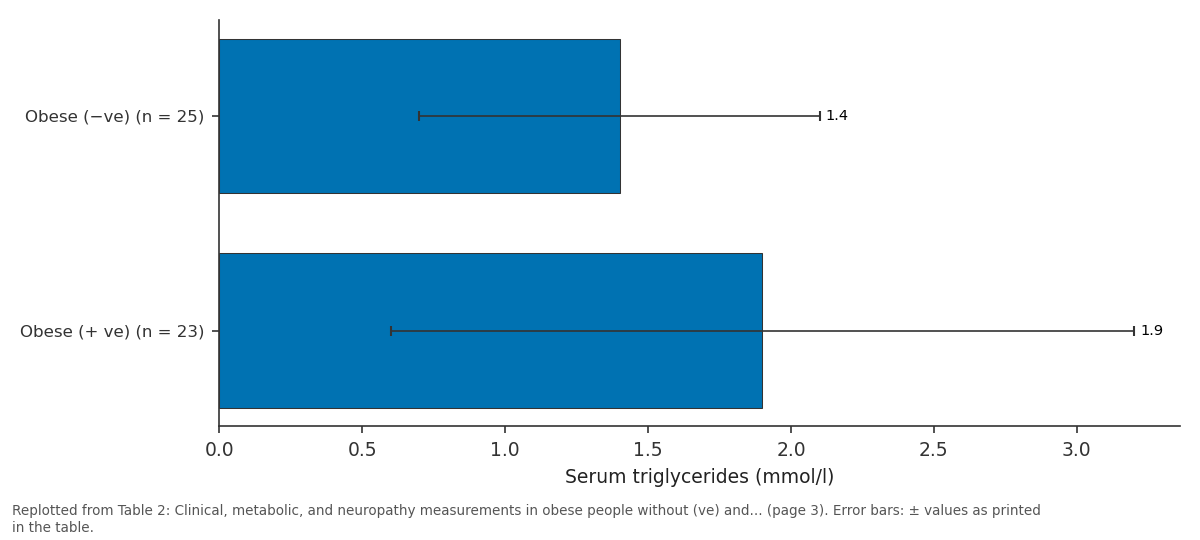
Serum triglycerides (mmol/l): Obese (−ve) (n = 25) vs Obese (+ ve) (n = 23)
Replotted from Table 2 (page 3) of the original paper. Every bar is the paper's own table value.
View source evidence ↗Figures & tables
From the original paper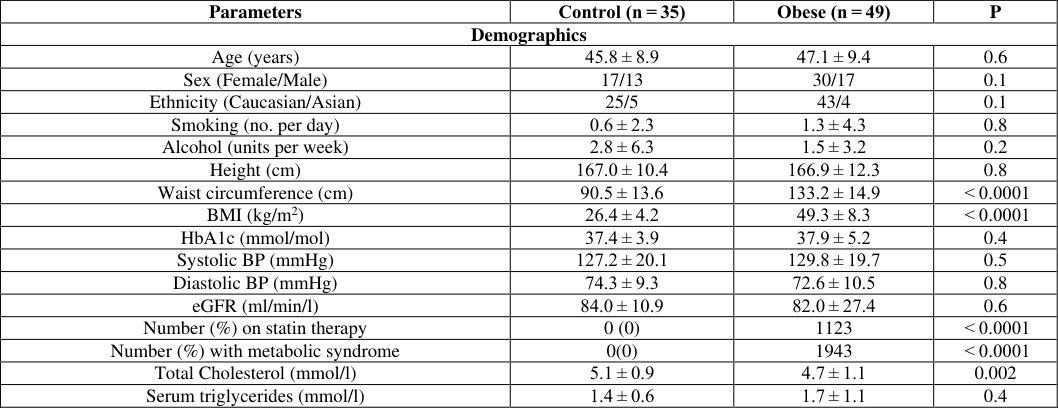 Table 1
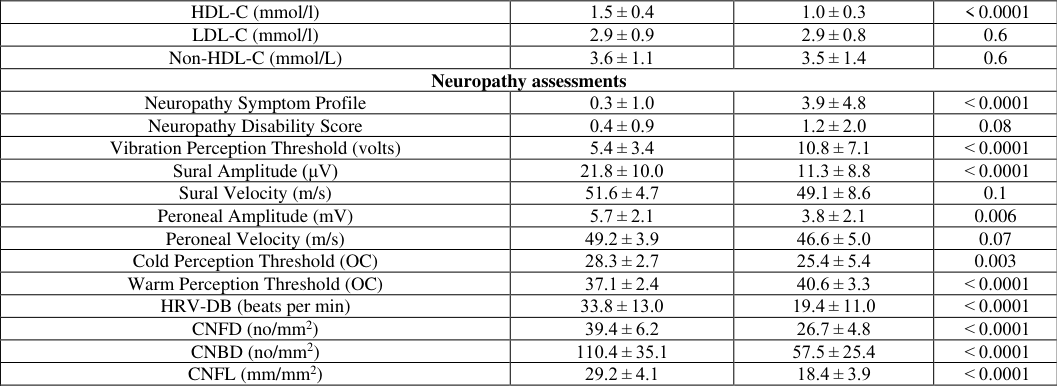 Table 2
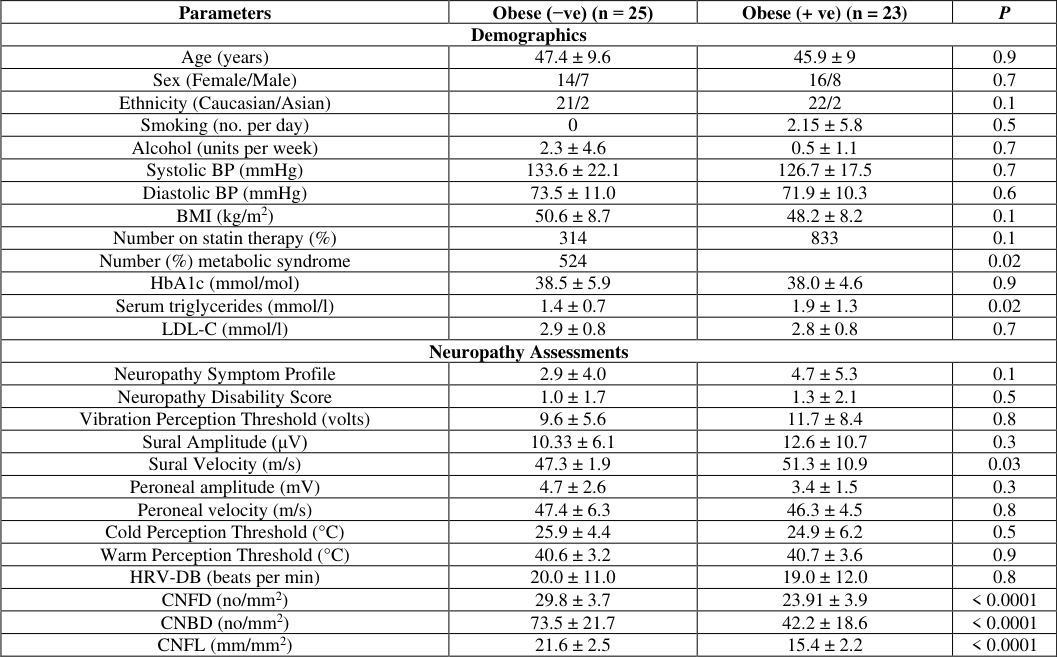 Table 2
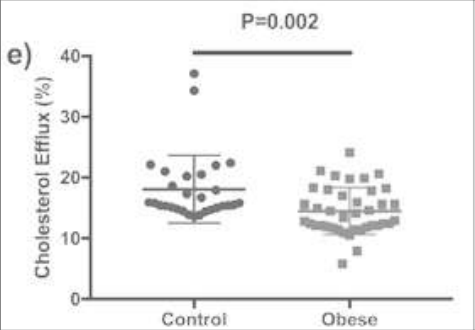 Figure 1
Introduction
Obesity has several etiological variables that have been found. Obesity has a complex scientific foundation that includes genetics, biological aspects related to proper body growth, food patterns, energy needs, and adipose tissue activity, among others. Obesity growth can be examined from a psychosocial standpoint. Stress is the result of a person's reaction to their surroundings. Stress activates parasympathetic and sympathetic nervous systems in organisms. Acute and chronic stress are two types of stress. Obesity is still poorly understood when it comes to stress. Obese people with and without T2DM can develop small fiber neuropathy and autonomic heart dysfunction. Lower intraepidermal nerve fibers have been linked to hypertriglyceridemia and obesity, and lower nerve conduction velocity is linked to higher HbA1c. Small fiber pathology has previously been observed in persons with IGT, particularly those who develop diabetes. In persons with IGT, particularly those with metabolic syndrome, intraepidermal nerve fiber temperature rises following diet and exercise, and tiny nerve fibers regenerated after bariatric surgery. Dyslipidemia has been linked to the development of diabetic neuropathy in the past. People with diabetes and micro vascular problems have reduced serum paraoxonase-1 (PON-1), a reactive and antiatherogenic component of HDL that lowers the vulnerability of LDL to lipid peroxidation. Short-term reductions improve diabetic neuropathy in serum triglycerides 21. Mice fed a high-fat diet and overexpressing 12/15-lipoxygenase in the peripheral nerve, and dorsal root ganglia show minor nerve fiber injury. Obesity-mediated neuropathy may potentially be caused by a reduction in HDL's antioxidant function, as well as systemic and adipose tissue inflammation.
Materials and Methods
The Study and Control Groups Obese participants were selected from a regional tier 3 specialist weight management program at the Salford Royal Hospital and had never been diagnosed with T2D or prediabetes, as evidenced by an HbA1c of less than 44 mmol/mol (5.0%).
Healthy volunteers from Manchester University Foundation Trust and the University of Manchester made up the control group. History of cancer, prior chemotherapy or radiotherapy, diabetes, prediabetes, anemia, hereditary neuropathies, inborn inconsistencies of metabolism, undiagnosed vitamin/mineral deficiencies, low vitamin B12 or folate tiers that may impact the cornea were all considered exclusion criteria. The Central Manchester Research and Ethics Committee gave their approval to this project. Guidelines and regulations.
Neuropathy Evaluation and Demographics
All study participants had their BMI (kg/m 2 ), blood pressure, and neuropathy symptoms assessed using the Neuropathy Symptom Profile (NSP). The revised neuropathy disability score (NDS) was used to assess neurological abnormalities, which included vibration sensitivity, pin-prick, temperature feeling, and the existence or disappearance of ankle reflexes. An ANX 3.0 autonomic nervous system monitoring device was used to measure heart rate variability with deep breathing (HRV-DB).
Lipid Profile
Total cholesterol was determined by the cholesterol oxidase phenol 4-aminoantipyrine peroxidase method, serum triglycerides were determined by the glycerol phosphate oxidase phenol 4-aminoantipyrine peroxidase method, and apolipoprotein A1 was determined by immunoturbidimetric tests. The direct clearing method was used to measure HDL-C. A Randox daytona analyzer was used for all of these tests. RIQAS, which is CRC calibrated, is used by the laboratory. The Friedewald formula was used to calculate LDL.
Blood Sample
After a 10-hour overnight fast, blood samples were obtained, and serum and EDTA-plasma were separated by centrifugation at 1500 g for 20 minutes at 5 °C within 2 hours of collection and stored at -50 °C.
PON-1 (paraoxonase-1) Behavior
A moderately micro-titer plate approach employing paraoxon was used to evaluate serum PON-1 activity. A multiclan multiset plate scanner was used to read the plates at 405 nm. CVs were 4% and 4.5% intra-assay and interassay, respectively.
Statistical analysis
SPSS for Mac was used to conduct the analysis (Version 19.0, IBM Corporation, New York, USA). The mean and standard deviation are used to express all of the data (SD). The data were checked for normality and statistical analysis was carried out. We employed one-way analysis of variance (ANOVA) or a non-parametric equivalent to analyze differences within and between groups. A significant pvalue was defined as less than 0.05.
Results
We compared 49 people with extreme obesity to 35 healthy people of the same age (P = 0.5) (Table 1). In comparison to controls, obese people had significantly higher weight (P 0.0001), waist circumference (P 0.0001), and BMI (P 0.0001), but no statistically significant differences in HbA1c, blood pressure, or eGFR (Table 1). Nineteen (40%) of the obese subjects fit the metabolic syndrome criteria. When compared to controls, obese participants exhibited significantly higher NSP (P 0.0001) and lower sural (P 0.0001) and peroneal (P = 0.006) nerve amplitudes, but no change in sural and retroperitoneal nerve conduction velocity and delay (Table 1). When comparing obese participants to controls, VPT (P = 0.0001) and WPT (P 0.0001) were significantly greater, while CPT (P = 0.003) and HRV-DB (P 0.0001) were significantly lower. Obese subjects had significantly lower CNFD (P 0.0001), CNBD (P 0.0001), and CNFL (P 0.0001) than controls. Fifty-three percent of obese subjects had substantial minor nerve fiber damage based on a CNFL cut-off larger than two standard deviations below the mean of healthy controls. Metabolic syndrome was found in 58 percent of persons with minor nerve fiber injury compared to 23 percent of those without (P = 0.02). In obese patients with minor nerve fiber injury, CNFD (P 0.0001), CNBD (P 0.0001), and CNFL (P 0.0001) were considerably lower than in those without. Except for a more incredible sural nerve conduction velocity (P = 0.03), no other parameters of neuropathy differed substantially between obese participants with and without minor nerve fiber loss (Table 2). Although 25% of the people with extreme obesity were given statins, their lipid profile, apoA1, apoB, and HDL functioning markers were not different from those who were not. In persons with extreme obesity, total cholesterol was significantly lower (P = 0.002).
| Parameters | Obese (−ve) (n = 25) | Obese (+ ve) (n = 23) | P |
|---|---|---|---|
| Demographics | |||
| Age (years) | 47.4 ± 9.6 | 45.9 ± 9 | 0.9 |
| Sex (Female/Male) | 14/7 | 16/8 | 0.7 |
| Ethnicity (Caucasian/Asian) | 21/2 | 22/2 | 0.1 |
| Smoking (no. per day) | 0 | 2.15 ± 5.8 | 0.5 |
| Alcohol (units per week) | 2.3 ± 4.6 | 0.5 ± 1.1 | 0.7 |
| Systolic BP (mmHg) | 133.6 ± 22.1 | 126.7 ± 17.5 | 0.7 |
| Diastolic BP (mmHg) | 73.5 ± 11.0 | 71.9 ± 10.3 | 0.6 |
| BMI (kg/m2) | 50.6 ± 8.7 | 48.2 ± 8.2 | 0.1 |
| Number on statin therapy (%) | 314 | 833 | 0.1 |
| Number (%) metabolic syndrome | 524 | 0.02 | |
| HbA1c (mmol/mol) | 38.5 ± 5.9 | 38.0 ± 4.6 | 0.9 |
| Serum triglycerides (mmol/l) | 1.4 ± 0.7 | 1.9 ± 1.3 | 0.02 |
| LDL-C (mmol/l) | 2.9 ± 0.8 | 2.8 ± 0.8 | 0.7 |
| Neuropathy Assessments | |||
| Neuropathy Symptom Profile | 2.9 ± 4.0 | 4.7 ± 5.3 | 0.1 |
| Neuropathy Disability Score | 1.0 ± 1.7 | 1.3 ± 2.1 | 0.5 |
| Vibration Perception Threshold (volts) | 9.6 ± 5.6 | 11.7 ± 8.4 | 0.8 |
| Sural Amplitude (μV) | 10.33 ± 6.1 | 12.6 ± 10.7 | 0.3 |
| Sural Velocity (m/s) | 47.3 ± 1.9 | 51.3 ± 10.9 | 0.03 |
| Peroneal amplitude (mV) | 4.7 ± 2.6 | 3.4 ± 1.5 | 0.3 |
| Peroneal velocity (m/s) | 47.4 ± 6.3 | 46.3 ± 4.5 | 0.8 |
| Cold Perception Threshold (°C) | 25.9 ± 4.4 | 24.9 ± 6.2 | 0.5 |
| Warm Perception Threshold (°C) | 40.6 ± 3.2 | 40.7 ± 3.6 | 0.9 |
| HRV-DB (beats per min) | 20.0 ± 11.0 | 19.0 ± 12.0 | 0.8 |
| CNFD (no/mm2) | 29.8 ± 3.7 | 23.91 ± 3.9 | < 0.0001 |
| CNBD (no/mm2) | 73.5 ± 21.7 | 42.2 ± 18.6 | < 0.0001 |
| CNFL (mm/mm2) | 21.6 ± 2.5 | 15.4 ± 2.2 | < 0.0001 |
Table text extracted from the original PDF; superscript letters are shown inline. The original table image is below.
View original table image
| HDL-C (mmol/l) | 1.5 ± 0.4 | 1.0 ± 0.3 | < 0.0001 |
|---|---|---|---|
| LDL-C (mmol/l) | 2.9 ± 0.9 | 2.9 ± 0.8 | 0.6 |
| Non-HDL-C (mmol/L) | 3.6 ± 1.1 | 3.5 ± 1.4 | 0.6 |
| Neuropathy assessments | |||
| Neuropathy Symptom Profile | 0.3 ± 1.0 | 3.9 ± 4.8 | < 0.0001 |
| Neuropathy Disability Score | 0.4 ± 0.9 | 1.2 ± 2.0 | 0.08 |
| Vibration Perception Threshold (volts) | 5.4 ± 3.4 | 10.8 ± 7.1 | < 0.0001 |
| Sural Amplitude (μV) | 21.8 ± 10.0 | 11.3 ± 8.8 | < 0.0001 |
| Sural Velocity (m/s) | 51.6 ± 4.7 | 49.1 ± 8.6 | 0.1 |
| Peroneal Amplitude (mV) | 5.7 ± 2.1 | 3.8 ± 2.1 | 0.006 |
| Peroneal Velocity (m/s) | 49.2 ± 3.9 | 46.6 ± 5.0 | 0.07 |
| Cold Perception Threshold (OC) | 28.3 ± 2.7 | 25.4 ± 5.4 | 0.003 |
| Warm Perception Threshold (OC) | 37.1 ± 2.4 | 40.6 ± 3.3 | < 0.0001 |
| HRV-DB (beats per min) | 33.8 ± 13.0 | 19.4 ± 11.0 | < 0.0001 |
| CNFD (no/mm2) | 39.4 ± 6.2 | 26.7 ± 4.8 | < 0.0001 |
| CNBD (no/mm2) | 110.4 ± 35.1 | 57.5 ± 25.4 | < 0.0001 |
| CNFL (mm/mm2) | 29.2 ± 4.1 | 18.4 ± 3.9 | < 0.0001 |
Table text extracted from the original PDF; superscript letters are shown inline. The original table image is below.
View original table image
| Parameters | Control (n = 35) | Obese (n = 49) | P |
|---|---|---|---|
| Demographics | |||
| Age (years) | 45.8 ± 8.9 | 47.1 ± 9.4 | 0.6 |
| Sex (Female/Male) | 17/13 | 30/17 | 0.1 |
| Ethnicity (Caucasian/Asian) | 25/5 | 43/4 | 0.1 |
| Smoking (no. per day) | 0.6 ± 2.3 | 1.3 ± 4.3 | 0.8 |
| Alcohol (units per week) | 2.8 ± 6.3 | 1.5 ± 3.2 | 0.2 |
| Height (cm) | 167.0 ± 10.4 | 166.9 ± 12.3 | 0.8 |
| Waist circumference (cm) | 90.5 ± 13.6 | 133.2 ± 14.9 | < 0.0001 |
| BMI (kg/m2) | 26.4 ± 4.2 | 49.3 ± 8.3 | < 0.0001 |
| HbA1c (mmol/mol) | 37.4 ± 3.9 | 37.9 ± 5.2 | 0.4 |
| Systolic BP (mmHg) | 127.2 ± 20.1 | 129.8 ± 19.7 | 0.5 |
| Diastolic BP (mmHg) | 74.3 ± 9.3 | 72.6 ± 10.5 | 0.8 |
| eGFR (ml/min/l) | 84.0 ± 10.9 | 82.0 ± 27.4 | 0.6 |
| Number (%) on statin therapy | 0 (0) | 1123 | < 0.0001 |
| Number (%) with metabolic syndrome | 0(0) | 1943 | < 0.0001 |
| Total Cholesterol (mmol/l) | 5.1 ± 0.9 | 4.7 ± 1.1 | 0.002 |
| Serum triglycerides (mmol/l) | 1.4 ± 0.6 | 1.7 ± 1.1 | 0.4 |
Table text extracted from the original PDF; superscript letters are shown inline. The original table image is below.
View original table image
Conclusion
Finally, we show that persons with significant obesity have signs of slight nerve fiber injury. Obese patients showed higher triglycerides and SAA in their blood and reduced HDL-C, PON-1 activity, and cholesterol efflux. Furthermore, obese people with minor nerve fiber injury had greater serum triglycerides, a higher frequency of metabolic syndrome, and lower PON1 activity than those without. These factors could be used as therapeutic targets in obesity to avoid or reverse tiny nerve fiber damage.
Figures and tables from the paper
References
11 in the original paper- Asghar O, et al. Corneal confocal microscopy detects neuropathy in subjects with impaired glucose tolerance. Diabetes Care. 2015;37(8):2634-2639.
- Bongaerts BW, et al. older subjects with diabetes and prediabetes are frequently unaware of having distal sensorimotor polyneuropathy: the KORA F4 study. Diabetes Care. 2014;35(6):1151-1156.
- Valensi P, et al. Cardiac autonomic neuropathy in diabetic patients: influence of diabetes duration, and obesity. 2003;52(6):815-200.
- Asghar O, et al. Individuals with impaired glucose tolerance demonstrate normal cardiac sympathetic innervation using I-123 Official Publ. Am. Soc. Nuclear Cardiol. 2015;24(7):1265-12761.
- Iqbal Z, et al. Metabolic and cardiovascular outcomes of bariatric surgery. 2019;32(3):247-257.
- Davidson W, et al. Proteomic analysis of defined HDL subpopulations. Arterioscler. Thromb. Vasc. Biol. 2010;30(6):870-876.
- Obrosova et al. Effects of healthy diet and aldose reductase inhibition. Diabetes. 2008;57(10):2599-2609.
- Kalteniece A, et al. Rapid reproducible ophthalmic technique for quantifying corneal nerve abnormalities. PLoS one. 2018;12(8):e0183040.
- Asztalos BF, et al. HDL subpopulations on cellular ABCA1 and SR-BI-mediated cholesterol efflux. J Lipid Res. 2006;46(10):2240-2255.
- Adam S, et al. Improvements in diabetic neuropathy and nephropathy after bariatric surgery: a prospective cohort study. Obes. Surg. 2021;31(2):554-563.
- Zhao Y, et al. Association between serum amyloid a and obesity: a meta-analysis and systematic review. Res. 2011;60(5):322-335.