
Research article · 2021 · Full text
International Journal of Statistics and Applied MathematicsInterregional multiple regression models of inflation rates in Nigeria
Volume 6(4) · Pages 90–94 · DOI: 10.22271/maths.2021.v6.i4b.710 ↗
Research areasMonetary Policy and Economic ImpactModeling, Simulation, and Optimization
Abstract
Author-writtenThe differences in inflation rates in the regions of Nigeria occur with little or no attention paid to it but all effort is concentrated on the national inflation rates. Regions of Nigeria are as large as some countries of Africa and as a result it became imperative to look at the contribution of each of the region’s inflation rates to the national rates. Original prices data collected by the National Bureau of Statistics of Nigeria was used to produce state price index series. This research made use of the state price index series to compute state inflation rates for all the states. The already existing regional structure of the country was utilized and average inflation rates of states under each region was computed and used to generate a multiple regression model of inflation rate for the regions. The study was able to discover that not all the regions contribute to the rise in inflation rates in Nigeria. From the research also, it was discovered that North West and South East regions have minimum contributions to the rising inflation rates in Nigeria during the period under study.
Summary
Source-checkedPlain-language reading of the full paper, prepared with AI and checked against the text. Each point links to the authors' own words.
Why it matters
- High inflation rates are problematic because they create uncertainty that discourages public investment and make domestic exports less competitive. View evidence ↗
- Inflation is a social issue that particularly impacts low-income earners due to their relatively low wages. View evidence ↗
- Nigeria's regional differences in religion, culture, and population size lead to varying production capabilities and consumption patterns across the country. View evidence ↗
The question
- The study aims to determine how the inflation rates of individual regions contribute to Nigeria's overall national inflation rate. View evidence ↗
What they did
- The researchers used original price data from the National Bureau of Statistics of Nigeria to create state price index series. View evidence ↗
- The study analyzed headline inflation as the dependent variable over a ten-year period from 2011 to 2020. View evidence ↗
- The independent variables in the model were the inflation rates from six distinct regions of Nigeria. View evidence ↗
- Due to the number of variables, the researchers used SPSS statistical software to perform the multiple regression analysis. View evidence ↗
What they found
- The South West, South South, North East, and North Central regions contributed positively to national inflation, whereas the South East and North West regions contributed negatively. View evidence ↗
- The South East and North West regions were found to have the lowest inflation rates during the study period. View evidence ↗
- The resulting regression model for headline inflation (Hi) is defined by the equation: Hi = -2.863 + 1.856R1 + 0.166R2 − 1.405R3 − 3.038R4 + 3.304R5 + 0.457R6 + Ei. View evidence ↗
- The study observed a pattern similar to the United States, where the South East and North West regions of Nigeria exhibited deflation. View evidence ↗
What it means
- The authors recommend that the National Bureau of Statistics begin compiling regional Consumer Price Indices (CPIs) to better compute inflation rates. View evidence ↗
- The authors conclude that current government monetary policy fails to address the diverse economic conditions existing across different regions of Nigeria. View evidence ↗
- The study could not determine the causes of regional inflation differences because it relied on pre-computed indices from the National Bureau of Statistics. View evidence ↗
Visual summary
1 visualsIllustrations explain the paper; charts are replotted from the paper's own table values.
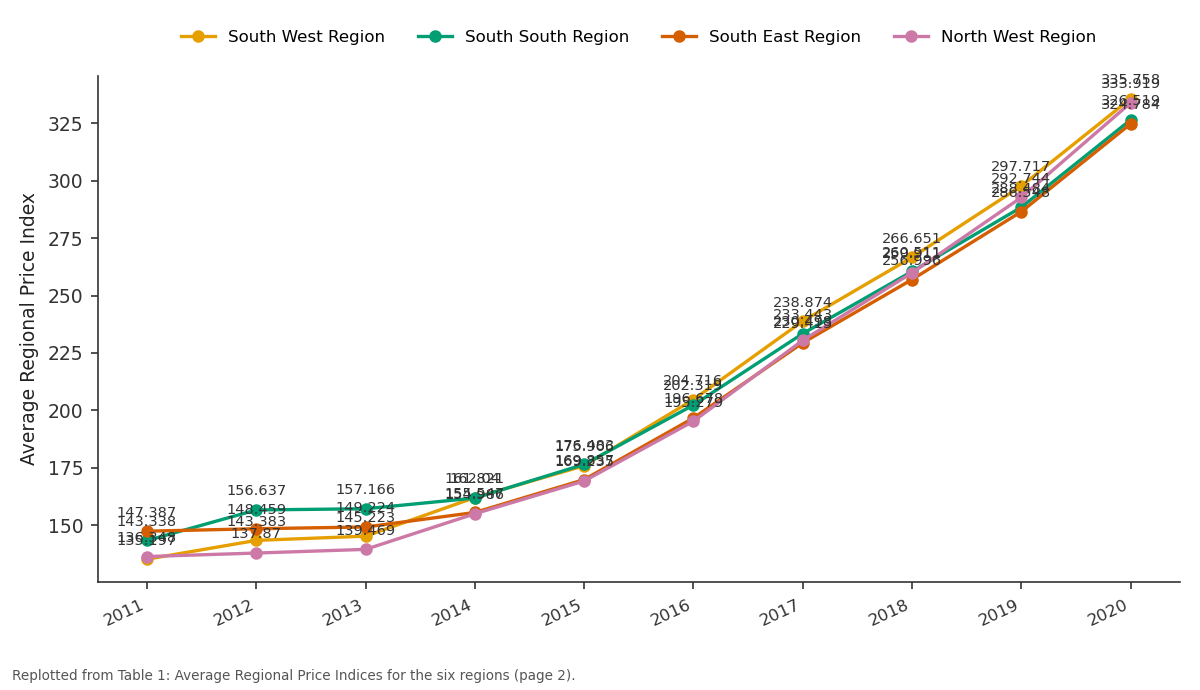
South West Region and South South Region and more: 2011 vs 2012 vs 2013 vs 2014 vs 2015
Replotted from Table 1 (page 2) of the original paper. Every bar is the paper's own table value.
View source evidence ↗Figures & tables
From the original paper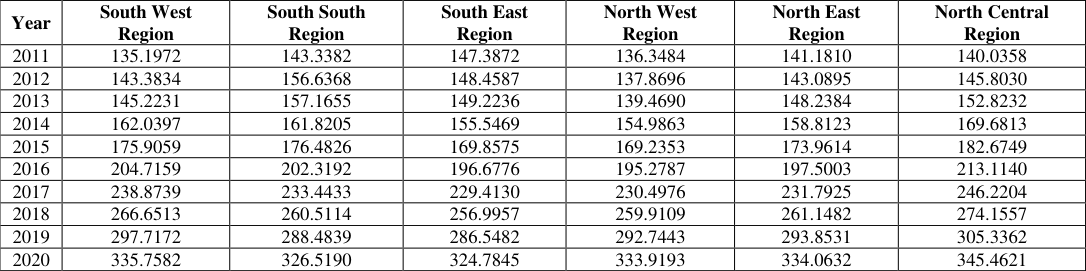 Table 1
 Table 2
Introduction
The regional structure of Nigeria is mostly in the line of religion, culture and size of the population; this has made it possible for consumption patterns and production capabilities to differ across the regions. It is based on these assumptions that this study on variations or otherwise of interregional inflation rates is being embarked upon. The consumer price index which is used to compute inflation rates will lead the process for this study. The Consumer Price Index measures changes in the average level of retail prices of goods and services paid by consumers over time; this is an internationally accepted practice which Nigeria has adopted a long time ago. High inflation rates create high level of uncertainty, thereby reducing incentives for investment for the consuming public. It also reduces the competitiveness of domestic exports. Note also that high inflation is also a social problem because salary earners will directly feel its impact. The low income earners are the most vulnerable to inflation because their wages are relatively low. In this case, they will start to demand for increase in their wages. In 2004, a comprehensive price index manual: Theory and practice was published by International Labour Office (ILO), with the cooperation of a number of other international Organization. IMF CPI hand book (2) page. Consequently, it is of great interest to government, labour unions, business organization, research institutions and the general public. In Nigeria, the consumer price index (CPI) is mainly used by Government as an important fiscal tool for the yearly budget. Some institutions such as the National Accounting Standard Board of Nigeria use it as a deflator. The Labour Unions, other agencies and individuals settling disputes on contract agreements over periods utilize the CPI as a reference. In view of the foregoing, various aspects of the methodology had been examined and re-examined from time to time. The index relates to all households living in the urban and rural areas in Nigeria except those in institutional homes such as old people and motherless homes. According to consumer price index (CPI) report of National Bureau of Statistics (NBS), a comprehensive national statistical frame of market outlets was compiled and Price collection outlets were selected from the frame. About 835 products specifications are to be priced in each centre for computation and this form the CPI basket. Research works have been undertaken concerning inflation rates. Some have compared countries inflation rates, others doing trend analysis of inflation rate over a long period of time, but it seems that much work has not been done on interregional comparison of inflation rates. The study will rely mainly on official assignment and experience gathered while carrying out daily price statistics compilation work. Michael McCracken (May 2018), in his work ''Monetary Policy and Regional Inflation'' said that the Federal Reserve has a dual mandate from congress loosely stated as ''full employment'' and ''Price Stability". There are many ways to define and evaluate these mandates, but most shares one thing in common: They consider the U.S. as a whole, ignoring any idiosyncrasies present among Regions, States and even cities. As such, it is possible that monetary policy works on aggregate despite not having the intended effects in a particular geographic portion of the country's Inflation across Regions. In a 2015 post, Alejandro Badel and Joseph McGillicuddy investigated the differences in consumer Price Index (CPI) based Inflation rates across the four Regions: Western Region, Midwestern Region, North Eastern Region and Southern Region. At the time, aggregate Inflation for the Nation was slightly above zero, but among the four Regions, only the Western Region exhibited positive levels of Inflation. The other three regions had essentially zero inflation or were even exhibiting a bit of inflation. These differences were largely the result of higher energyand shelterdriven inflation in the western region. Obviously, national inflation reports need not accurately represent price movements in any specific part of the country. National Policy versus Regional Needs: This comparison is just one example of how inflation levels differ across geographic areas within the U.S. even between cities in the same region of the country. As such, it reminds us that monetary policy is a blunt tool. Policy makers at the federal are unable to address separately the heterogeneous economic conditions that exist among the different parts of this large diverse country. In a study "An Econometric Model for Inflation Rates in the Volta Region of Ghana" by Francois Mahama, Elikem Krampa and Solomon Yemidi all of Department of Mathematics and Statistics, HO Technical University, Ghana, the paper noted that Ghana has been challenged by high inflation rates for a long period of time. The phenomenon in many cases leaves in its trial adverse economic consequences. Therefore, forecasting inflation rates in Ghana becomes very important for government and central bank to design fiscal measures or effective monetary policies to combat any unexpected high inflation in the country. The paper added that for firms and households, knowledge about the rate of inflation in future enables them to factor it into their planning so as to guard against unpleasant ramifications. The paper employed Autoregressive integrated moving average (ARIMA) technique to model inflation rates in Volta region of Ghana.
The paper looked at one region in Ghana (Volta), but this research will attempt to study the six regions in Nigeria with a view to determining which regions have minimum inflation rates. It is also important to note that using yearly data takes care of seasonal effects instead of the monthly data used to come up with the conclusion by the Ghana researchers.
Materials And Methods
Materials And Methods
Materials
The materials used in this research work are sourced from the National Bureau of Statistics, Nigeria. The method of data collection for prices data for the meantime is twelve module structured paper questionnaire of the NBS. A list containing all goods and services in the consumer price index (CPI) basket is prepared and handed to price data collectors who carry out the data collection. The National Statistics office (NBS) has offices in the 36 federating states including Abuja (Federal Capital Territory). Well trained staff of the office collects prices data on monthly basis from each state from selected outlets. Since the country is partitioned along regional lines, six regions exist with average of six states per region. One central state in each region is made the head quarter of the region for ease of data gathering coordination. These headquarters are equipped with computer networks. Upon transmission of data from the states to their respective headquarters, data entry is carried out and the data transmitted online to the Federal capital (National headquarters) where analysis and publications are done.
Methods
In this research, attempt will be made to determine how regional inflation rates R1, R2… R6 in Nigeria depend on activities of the years under study. The aim in multiple regressions is to examine the nature of the relationship between a given dependent variable and two or more independent variables. The research is intended to solve real live economic problem of the household by using economic model (multiple regression) to measure the values of the parameters (B values) in the model. The parameters relate to R variables which will be used to determine the contribution of each region's inflation rates to the overall national inflation rate. The variables R 1, R 2, R 3, R 4, R 5 and R 6 are the regional inflation rates for the six regions of the country; H represents the headline inflation (dependent variable) for the country for a period of ten years (2011 -2020).
In multiple regression, as in simple regression, the model describing the relationship between the dependent variable (H) and a set of K independent variables, R1, R2, R3… R6 can be expressed as:
where 'n'is the number of observations in both the dependent and independent variables H i is the ith observation on the dependent variable H, B1, B2, B3, …, B6 are known constants representing respectively the ith observations on the independent variables R1, R2, R3, …, R6 which also represents the six regions in Nigeria. The error terms captured in E, are assumed to be independently and normally distributed with mean zero and variance δ 2 and parameters B 0 , B 1 , … , B 6 are parameters referred to as regression coefficients.
Multiple Regression Model
Having explained above how inflation rates are computed, our task here is to employ the multiple regression technique to The second normal equation is obtained by multiplying every term in the regression equation by X i1 and summing the result. The third normal equation is obtained by multiplying every term in the regression equation by X i2 and summing the result, and so on. It will be too cumbersome to obtain separate expression for the estimates b 0 , b 1 , … b 6 . Instead these coefficients are obtained by calculating the required sums from the data for the various combinations of Y, X 1 , X 2 , … , and X 6 and substituting these sums into the normal equations, which are solved simultaneously. The cumbersomeness of manual calculation involved due to large number of variables has made it inevitable the use of statistical software such as statistical package for social sciences (SPSS) for this analysis.
Results and discussion
Results and discussion
Discussion
This research work is able to discover that there are differences in contribution of regional inflation rates to the national. This is revealed in the multiple regression model developed from the data set. The standard error determines how much variability surrounds a coefficient estimate. A coefficient is significant if it is non-zero, therefore since all the regions are having nonzero standard error, it shows that the standard errors of the estimates of the regions are significant. Also inflation rates in the respective regions are significantly different from each other. It was also discovered that South East and North West recorded the minimum inflation rates within the period under study. The table above shows the result obtained when a multiple regression analysis is carried out using the data. From the result, South West, South South, North East and North Central Regions made positive contributions while South East and North West regions made negative contributions to the overall national inflation rate. The interregional multiple regression models can therefore be stated thus:
To fit multiple regression models above is the aim of this research. The Nigerian regional inflation exhibits similar pattern as the United States with South East and North West Regions exhibiting deflation. The reason for the differences in the regional inflation rates cannot be determined in this research since we are making use already computed indices from the National Bureau of Statistics. Although like the earlier researcher has observed, National inflation rates reports need not accurately represent price movements in any specific part of the country, this research has been able to observe a similar movement. This comparison has observed how inflation levels differ across regions within the country. This reminds us that the monetary policy of government has not been able to address separately the heterogeneous economic conditions that exist among the different parts of this large and diverse country. From the result also, it can be seen that the minimum inflation rates are recorded in two regions (South East and North West of Nigeria).
Conclusion
This research has been able to address the main question of fitting multiple regression models of interregional inflation rates in Nigeria. Multiple regression models fitted discovered that while two of the regions (South East and North West) contributed minimally to the high rate of inflation, the other four are the main reason why inflation rates have being on the rise. Our candid suggestion is that the National Bureau of Statistics should as a matter of need start the compilation of regional CPI's leading the computation of the inflation rates. The current practice only gives a Macro picture of the economy ignoring the components where proper planning should start from that will metamorphose into clear view and better understanding of the entire economy. This practice will aid the National government to beam their search light on the regions that need any form of economic assistance.
Figures and tables from the paper
References
14 in the original paper- Adenomon MO, Micheal VA. Introductory Econometric with Examples in EViews. Jube-Evans Books and Publications F.M.C Road, Bida, Niger State 2017.
- Bruce EW, Clifford J. Drew Theory and Application of Statistics 1990.
- Biyi Afonja. Introductory Statistics: A Learner's Motivated Approach 1975.
- Consumer Price Index Manual, Theory and Practice with support of ILO 2004.
- ECOWAS: Harmonized Consumer Price Index Guideline on how to compile CPI"s in ECOWAS Price Index Manual Sub-Region 2013.
- Jude IE, Micah EO, Edith NE. Statistics and Quantitative Methods for Construction and Business Managers. The Nigerian Institute of Building Moris Hamburg: Statistical analysis for decision making 2005.
- Oyeka CA. Applied Statistical Methods Michael F. Bryan: Origin and evolution of the word inflation 1996.
- Swiss Bank: Monetary policy instruments (situation in 2009.
- Brown Peter Robert Lamont The world of late Antiquity 1971.
- Potter David Stone. The Roman Empire at Bay, AD 180 -395, Routledge history of the ancient world 2004.
- Francis O, Francois M, Solomon Y, Elikem K. An Econometric Model for Inflation Rates in the Volta Region of Ghana. IOSR Journal of Economics and Finance (IOSR-JEF) e-ISSN: 2321-5933, p-ISSN: 23215925 2015;6(6):48-55. Retrieved from http://www.iosrjournals.org
- Michael McCracken. Monetary Policy and Regional Inflation Rates 2018.
- Nwaboku OF. Methodology of CPI in Nigeria 2014.
- Sani Bawa, Ismaila Abdullahi S, Adamu Ibrahim. Analysis of Inflation Dynamics in Nigeria, (1981-2015) 2016.