
Research article · 2021 · Full text
International Journal of Statistics and Applied MathematicsA statistical analysis of the Indian premiere league 2018-2021
Volume 6(4) · Pages 16–22 · DOI: 10.22271/maths.2021.v6.i4a.699 ↗
Research areasSports Analytics and Performance
Abstract
Author-writtenFounded in 2007, the Indian Premiere League (IPL) is one the most watched sports leagues in the world. The event is followed and enjoyed by millions of Indians and cricket lovers across the globe. This study determines the quantitative factors that have played a role in winning matches in the last three seasons of the IPL. This is done using statistical tools such as Karl Pearson’s and Multiple Correlation along with regression analysis and the t-test. The qualifiers and finalists of the IPL 2021 are predicted using the binomial distribution with the help of past winning percentages. Cricket is not only governed by numerical factors; therefore, the predicted qualifiers are further investigated for a qualitative factor analysis using the chi-square test and rank correlation. This overall analysis successfully predicts the team that has the highest chance of winning the IPL 2021 considering both quantitative and qualitative factors.
Summary
Source-checkedPlain-language reading of the full paper, prepared with AI and checked against the text. Each point links to the authors' own words.
Why it matters
- The Indian Premiere League (IPL), established in 2007, is one of the most viewed sports leagues globally. View evidence ↗
- The introduction of Twenty20 cricket in 2003 revolutionized the sport by introducing fewer overs and power hitting, attracting a new audience. View evidence ↗
The question
- The study aims to identify the most effective quantitative and qualitative factors that contributed to winning matches in the IPL over the previous three seasons. View evidence ↗
What they did
- The researchers used Karl Pearson's correlation, multiple correlation, regression analysis, and t-tests to analyze the data. View evidence ↗
- A binomial distribution was used to calculate the probability of shortlisted teams reaching the playoffs and winning based on their winning probabilities. View evidence ↗
- A chi-square test was performed using a questionnaire from 100 cricket enthusiasts to determine if team rankings were dependent on qualitative factors. View evidence ↗
What they found
- Strong positive correlations were found between matches won and both the average runs of the top five scorers (+0.8073) and the number of batsmen with a strike rate over 140 (+0.8504). View evidence ↗
- The total number of wickets taken per match showed a strong positive correlation (+0.826) with the number of matches won. View evidence ↗
- Combining the total wickets taken per match and the bowling average of the top two opening pacers resulted in a multiple correlation of 0.8515, explaining 72.51% of the variance in matches won. View evidence ↗
- The chi-square test yielded a value of 21.5554, which exceeded the critical value, proving that team ratings are dependent on qualitative factors like fielding performance. View evidence ↗
What it means
- The authors conclude that Chennai Super Kings had the highest chance of winning IPL 2021 due to their high probability of winning matches and superior qualitative ratings. View evidence ↗
- The authors note that probability and data analysis can only provide predictions, as the inherent uncertainty of cricket prevents full predictability until a match concludes. View evidence ↗
Visual summary
2 visualsIllustrations explain the paper; charts are replotted from the paper's own table values.
Factors Influencing IPL Wins
AI-generated conceptual illustration (Cricket equipment (leather ball, willow bat, and three wooden stumps)). It explains the idea and does not show study data.
View source evidence ↗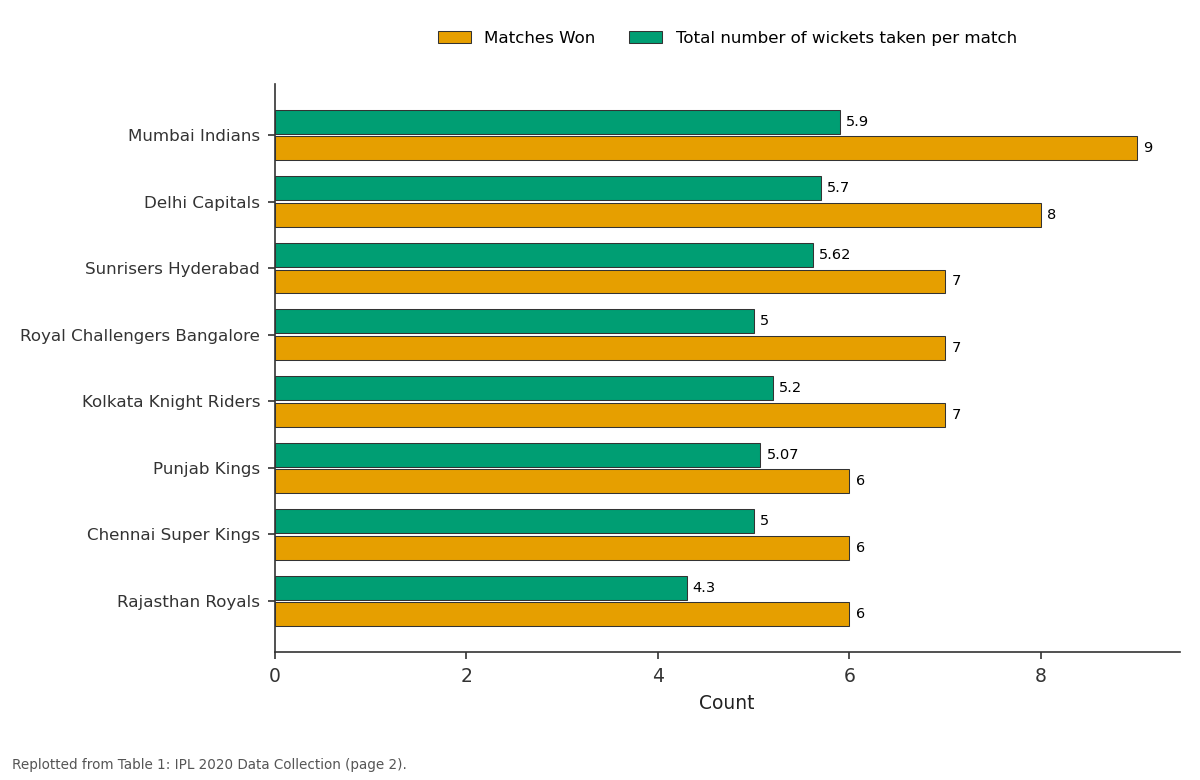
Matches Won and Total number of wickets taken per match: Mumbai Indians vs Delhi Capitals vs Sunrisers Hyderabad vs Royal Challengers... vs Kolkata Knight Riders
Replotted from Table 1 (page 2) of the original paper. Every bar is the paper's own table value.
View source evidence ↗Figures & tables
From the original paper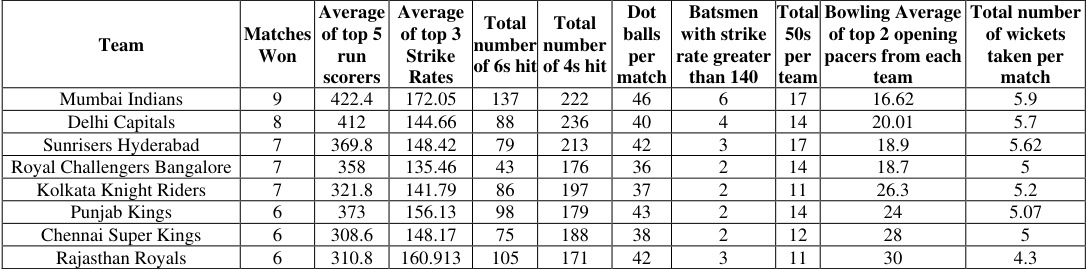 Table 1
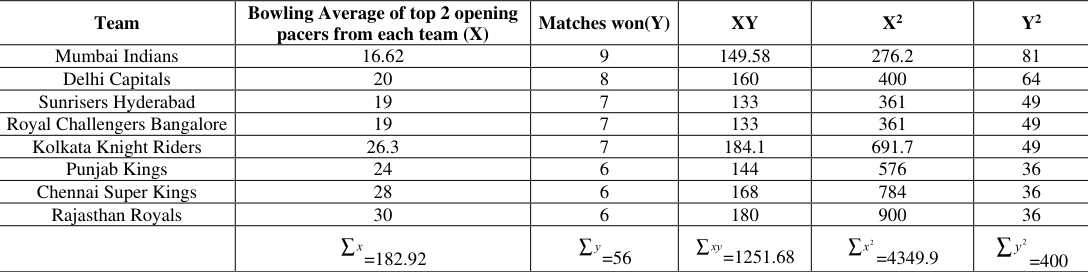 Table 2
 Table 3
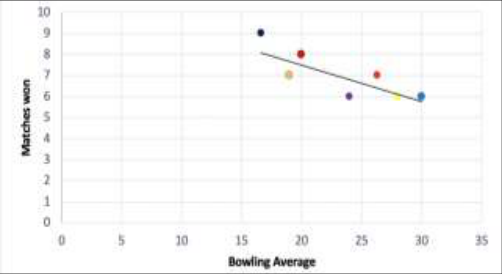 Figure 1
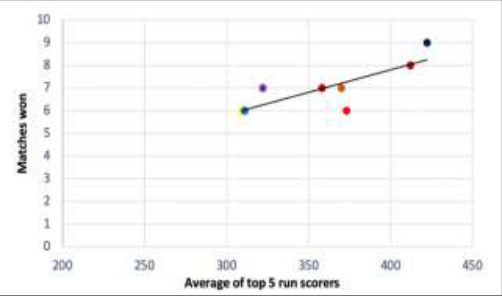 Figure 2
 Table 4
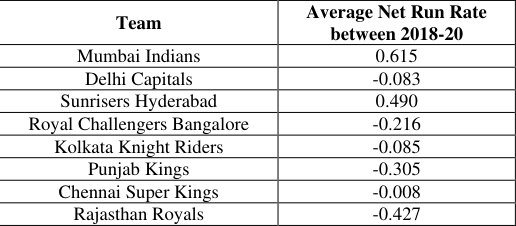 Table 5
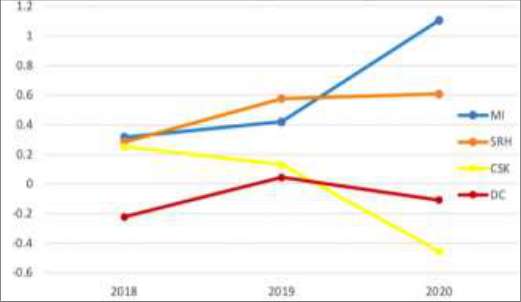 Figure 3
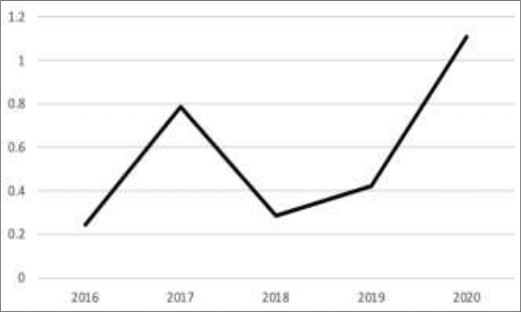 Figure 4
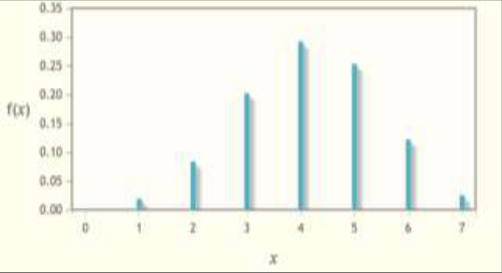 Figure 5
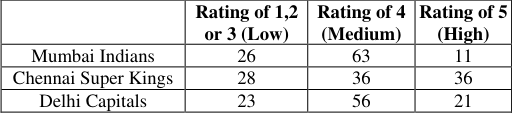 Table 6
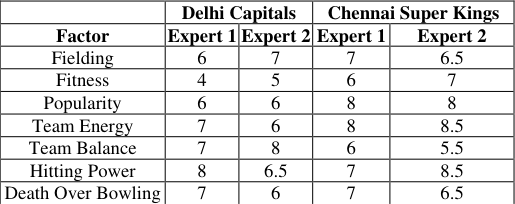 Table 7
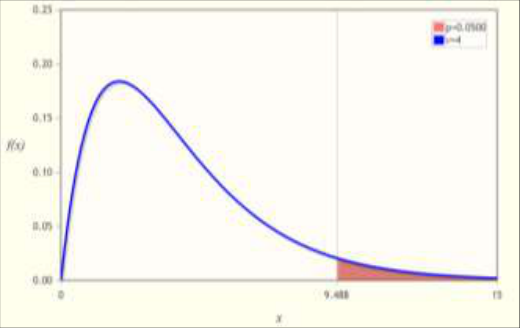 Figure 6
Introduction
Cricket, also known as the Gentleman's Game, is currently the world's second most popular sport and loved by people from all around the globe. The first reference to cricket can be traced back to the early 1600s in England when it was played in grammar schools, villages, and farm communities. The first official international match was played in 1877 between England and Australia. Test cricket is the traditional form of the game which has been played since then. It comprises of two innings each and is played over five days. It is known as the pinnacle form because it tests teams over a long duration. Almost a decade later, in the 1980s, One Day Internationals (ODIs) gained popularity. This is a quicker format of the game with 50 overs played each side and comprises of one innings each. The well-known International Cricket Council (ICC) Cricket World Cup is contested every four years in this format. Twenty20 cricket, the newest and modern format, revolutionized the game when it was introduced in 2003. It brought with it, rule changes and less overs that saw the beginning of power hitting and a whole new audience. It triggered the adoption of new skill sets and innovations in both batsmen and bowlers. A typical T20 match takes three hours to complete and includes creative batting, skillful bowling, and brilliant fielding. Other than the ICC Cricket Twenty20 championship, many T20 tournaments have emerged over the years including the Big Bash League, Caribbean Premiere League, Super Smash and of course the Indian Premiere League. The Indian Premiere League (IPL) was founded by the Board of Control for Cricket in India in 2007. The league is contested by eight teams based out of eight different Indian cities-Each team is formed with the help of shuffling to arrive at four foreign players and seven Indian players. This shuffling process is achieved through an auction which takes place every year before the start of IPL. The IPL is the most-attended cricket league in the world and was ranked sixth by average attendance among all sports leagues.
Aim
To determine the most effective quantitative factors that have played a role in winning matches in the last three seasons of the Indian Premiere League and further analyze qualitative factors of teams.
To make predictions about the qualifiers and winner of the 2021 season using various statistical tools and probability distributions.
Data Collection (IPL 2020)
Data Collection (IPL 2020)
Karl Pearson's Coefficient of Correlation
The Pearson Product Moment Correlation shows the linear relationship between an independent variable and dependent variable . It is used to find the association between the two variables.
Here, (i) n is the sample size of the dataset and equals 8 (ii) x is the data set of the quantitative values of the factor being analyzed (independent variables) (iii) y is the data-set of the number of matches won (dependent variables) Note: The data from the IPL 2020 season has been analyzed.
First, the factor of the mean of the bowling average of the top 2 opening pacers from each team has been taken. A player's bowling average is the number of runs they have conceded per wicket taken. Hence, the lower this value is for a bowler, the better it is considered. The correlation coefficient between the bowling average of top 2 opening pacers from each team and the matches won by that team in that season has been calculated: Thus, the correlation between the two variables is a high and inverse relationship. Since a lower bowling average is better for a bowler, that is why a negative association can be seen.
As the coefficient of correlation is high (lower than -0.75), it can be assumed that it is a contributing factor in winning matches in the Indian Premiere League. The same formula has been applied to a number of possible factors and the coefficient of correlation between them has been obtained.
T-test
The widely used t-test is be used next to establish whether this correlation is true for the population data which includes all T20 cricket matches and other Twenty20 Leagues. The t-test value is calculated using the following formula:
After putting the respective for and , a t-test value of 3.959 for the relationship between matches won and batsmen in each team with strike rate greater than 140 was obtained. Our significance level has been taken as . Null Hypothesis (Ho): The correlation between matches won and batsmen with strike rate greater than 140 is significant in the population data as well. Alternate Hypothesis (Ha): The correlation between matches won and batsmen with strike rate greater than 140 is not significant in the population data. Degree of Freedom-The formula for obtaining the value of the degrees of freedom is . A value of 6 as n=8 is obtained and finally a critical t-test value of 2.447 is obtained. Hence, as the value of 3.959 exceeds the critical value, the null hypothesis is accepted, establishing the correlation observed in the sample data to be statistically significant for the population data as well. The same was observed for the rest of the factors as well after repeating the same procedure. Thus, it can be proven that for all other twenty20 leagues, the same factors will contribute in winning. This can even be generalised to everyday gully cricket T-20 tournaments!
Regression Analysis
A linear regression model is one that assesses the relationship between a dependent variable and an independent variable. Next, the regression analysis is used to predict the matches won by a team with respect to the independent variable such as the total number of wickets taken by a team per match. The following equation is used in order to calculate the regression coefficient for the linear regression graph of y against x:
A value of 1.789 for is used using which the linear regression model expression using the following equation is calculated:
Finally, the equation can be re-arranged to form a simplified equation for y:
Over here: (i) , having a value of 7, represents the mean value of (number of matches won) and (ii) , having a value of 5.23, represents the mean value of (number of wickets taken per match) Similarly, the regression equations were found for the other three factors as well:
Average runs scored by top 5 run scorers from each team: Batsmen in each team with a strike rate greater than 140: Bowling Average of top 2 opening pacers from each team:
Multi-Variable Correlation
The relationship between two variables has been determined using correlation and used regression as a prediction tool to predict matches won in a season depending on certain factors.
Multi-variable correlation is a measure of how well a given variable (in this case it is the matches won by a team in a season of the IPL) can be predicted using a linear function of a set of other variables. It was decided that multi variable statistics will be used and the multi-variable correlation of total number of wickets taken per match will be measured. In addition, the bowling average of the top two opening pacers with matches won by a team will be calculated, which is given by the equation:
Where = Correlation between matches won and total wickets taken per match. = Correlation between total wickets taken per match and bowling average of top 2 opening pacers from each team. = Correlation between matches won and bowling average of top 2 opening pacers from team.
The values of the Pearson's Co-efficient of Correlation have been tabulated in the table below.
Net Run Rate
Teams that have a higher overall net run rate in the season tend to be the teams that end up qualifying for the playoffs and the winning teams usually have one of the highest net run rates in the season. So, what is net run rate? One hears of this terminology many times when it comes down to choosing between two teams that have won the same number of games.
The team with a higher net run rate is always ranked higher than a team that has a lower net run rate given that the matches won by both teams are same. Net run rate is a statistic used in cricket used to put runs scored and conceded in comparison with the number of overs faced and bowled.
Net Run Rate=
Now, a table with the average net run rate over 3 years has been calculated and shown below: Observing the last three seasons, a team that wins 7 or more matches (given a high net run rate), makes it to the playoffs. In most cases, a team that wins more than 8 matches, goes on to make it to the finals. Now we can calculate the following probabilities for each team using the binomial distribution:
Mumbai Indians Games left=7 Games required to win to reach playoffs= 3 or more Games required to win to play the final= more than 4
Calculating, Probability (Mumbai Indians will reach the playoffs):
P (Winning 3 matches) + P (Winning 4 matches) + P (Winning 5 matches) + P (Winning 6 matches) + P (Winning 7 matches) = 7 C 3 ´ (0.591) 3 ´ (0.409) 4 + 7 C 4 ´ (0.591) 4 ´ (0.409) 3 + 7 C 5 ´ (0.591) 5 ´ (0.409) 2 + 7 C 6 ´ (0.591) 6 ´ (0.409) 1 + 7 C 7 ´ (0.591) 7 ´ (0.409) 0 = 0.89477 = 89.477%
Using the same procedure, Probability (Mumbai Indians will reach the final) =0.4004= 40.04%
Chennai Super Kings Games left=7
Games required to win to reach playoffs= 2 or more Games required to win to play the final= more than 3
Calculating, Probability (Chennai Super Kings will reach the playoffs) =0.97275= 97.275% Probability (Chennai Super Kings reach the final) =0.65427= 65.427%
Delhi Capitals Games left=6
Games required to win to reach playoffs= 1 or more Games required to win to play the final= more than 2
Calculating, Probability (Delhi Capitals will reach the playoffs) =0.98833=98.83%
Probability (Delhi Capitals make the final) =0.6997=69.97% It can be observed that it is very likely that all three of these teams will make the playoffs. The teams that are most likely to win 9 or more matches and reach the finals are Delhi Capitals with a chance of 69.97% and Chennai Super Kings with 65.427%. Thus, it can be predicted that Delhi Capitals or Chennai Super Kings have the highest chance of reaching the final in IPL 2021 currently. fielding, fitness, team motivation, home ground advantage and many more.
Qualitative Factor Analysis using
To investigate whether teams rank differently based on the qualitative factors, it was decided to use a chi-square test. A questionnaire was sent out to a random sample of 100 cricket enthusiasts who had been following the IPL 2021. They were asked to rate teams on a scale of 1 to 5(5 being best) keeping in mind their overall fielding, fitness, and team spirit.
The three teams we will apply the test on are Mumbai Indians, Delhi Capitals and Chennai Super Kings. Below shows the responses to the fielding rating of the three teams.
Conclusion
Since the calculated c 2 value is more than the critical value; we can reject the null hypothesis proving that the rating of teams is dependent on fielding performance. The same procedure was carried out for overall fitness and team spirit. The results obtained were the same and there was statistically significant evidence that the rating of teams is dependent on the qualitative factors.
Spearman's Rank Correlation Coefficient
It was decided to finally use Spearman's Rank correlation to investigate 6 qualitative factors for the two predicted finalists-Delhi Capitals and Chennai Super Kings. In order to carry out the most effective research, two senior cricket experts and analysts Mr. Gaurav Kalra (Senior Editor at ESPN) and S. Ganesh (Sports consultant and ex-manager of Punjab Kings) graciously provided us with their opinionated scores based on these factors out of 10. The six factors included Fielding, Fitness, Popularity, Team Energy, Team Balance, Hitting Power, and Death-Over Bowling.
The formula for Spearman's Rank Correlation is
As ranks are repeated, the rank correlation formula with the repeated ranks is as follows
Where D the rank difference and n is is the total number of samples. After the total calculation using the formula, the rank correlation between ratings given by both experts is 0.712 for Chennai Super Kings and 0.411 for Delhi Capitals. These values indicate that both the senior analysts have moderately similar views regarding the qualitative aspects of both the teams, justifying their ratings. It was also observed that Chennai Super Kings was rated higher than Delhi Capitals by the two experts for most of the qualitative factors for the year 2021.
Table of Ranks for Both Teams
Based on the overall analysis, it can be predicted that Chennai Super Kings has the highest chance of winning the IPL 2021, having a high probability of winning more than 8 matches along with high ratings in their qualitative aspects-fielding, fitness, death-over bowling etc.
Conclusion
In accordance with the aim, the quantitative factors that have played a role in winning matches in the last three seasons have been obtained. These include total number of wickets taken per match, average of the top two opening bowlers (bowling average), top five run scorers average and number of batsmen with a strike rate of greater than 140 in each team.
The qualifiers and finalists of the IPL 2021 have been predicted using the binomial distribution. The study predicts that three teams-Mumbai Indians, Chennai Super Kings, and Delhi Capitals have the highest probability (more than 90%) of making it to the qualifiers. Delhi Capitals and Chennai Super Kings are the two predicted finalists. Using the Chisquare test and Rank Correlation, a qualitative factor analysis was successfully carried out. This gave us the result that the ratings of IPL teams are dependent on qualitative factors. The Rank Correlation showed a moderate positive correlation between the ratings given to both the teams by both the experts. Since Chennai Super Kings was rated higher than Delhi Capitals by both the experts in their qualitative aspect, they have been predicted as the winners of the IPL 2021.
It must be noted that cricket has numerous limitations. Probability and data analysis can only make predictions about the game. The fact that we cannot fully predict anything in the game of cricket till the match is over is what makes it so exciting.
Figures and tables from the paper
| S. No. | Factors | Coefficient of Correlation | Remark |
|---|---|---|---|
| 1. | Average runs scored by top 5 run scorers from each team | +0.8073 | Strong Correlation |
| 2. | Average of Top 3 Strike Rates from each team | +0.2887 | Weak Correlation |
| 3. | Average number of 6s hit per match | +0.4174 | Weak Correlation |
| 4. | Average number of 4s hit per match | +0.6405 | Moderate Correlation |
| 5. | Total number of 50s scored by each team | +0.6188 | Moderate Correlation |
| 6. | Batsmen in each team with a strike rate greater than 140 | +0.8504 | Strong Correlation |
Table text extracted from the original PDF; superscript letters are shown inline. The original table image is below.
View original table image
| Factors | Pearson’s Co-efficient of Correlation |
|---|---|
| Matches won and Total wickets taken per match ( ) | +0.826 |
| Matches won and Bowling average of top 2 opening pacers from team ( ) | -0.786 |
| Total wickets taken per match and Bowling average of top 2 opening pacers from each team ( ) | -0.802 |
Table text extracted from the original PDF; superscript letters are shown inline. The original table image is below.
View original table image
| Team | Average Net Run Rate between 2018-20 |
|---|---|
| Mumbai Indians | 0.615 |
| Delhi Capitals | -0.083 |
| Sunrisers Hyderabad | 0.490 |
| Royal Challengers Bangalore | -0.216 |
| Kolkata Knight Riders | -0.085 |
| Punjab Kings | -0.305 |
| Chennai Super Kings | -0.008 |
| Rajasthan Royals | -0.427 |
Table text extracted from the original PDF; superscript letters are shown inline. The original table image is below.
View original table image
| — | Delhi Capitals | — | Chennai Super Kings | — |
|---|---|---|---|---|
| Factor | Expert 1 | Expert 2 | Expert 1 | Expert 2 |
| Fielding | 6 | 7 | 7 | 6.5 |
| Fitness | 4 | 5 | 6 | 7 |
| Popularity | 6 | 6 | 8 | 8 |
| Team Energy | 7 | 6 | 8 | 8.5 |
| Team Balance | 7 | 8 | 6 | 5.5 |
| Hitting Power | 8 | 6.5 | 7 | 8.5 |
| Death Over Bowling | 7 | 6 | 7 | 6.5 |
Table text extracted from the original PDF; superscript letters are shown inline. The original table image is below.
View original table image
References
9 in the original paper- Britannica. (n.d.). Indian Premier. Retrieved April 03, 2021. From https://www.britannica.com/topic/IndianPremier-League
- International Cricket Council. (n.d.) History of cricket. Retrieved April 03, 2021. From https://www.icccricket.com/about/cricket/history-of-cricket/early-cricket
- Indian Premier League. (n.d.). By season stats. Retrieved April 03, 2021. From https://www.iplt20.com/stats/
- Miller N. A very brief history of cricket. The Telegraph. Retrieved April 2016-2021. From https://www.telegraph.co.uk/only-in-britain/odicricket/very-brief-history-of-cricket/
- ESPN. (n.d). Net run rate explained. Retrieved April 03, 2021. From https://www.espncricinfo.com/ci/content/page/429305.ht ml
- Douglas CC. Some Interpretations of the Multiple Correlation Coefficient. The American Statistician 1972;26(2):31-33. Taylor and Francis Ltd. Retrieved April 08, 2021, from https://www.jstor.org/stable/2683460
- Huhn C. Correlation Revelation: The Search for Meaning in Pearson's Coefficient. The Mathematics Teacher 2016;110(2):98-103. National Council of Teachers of Mathematics. Retrieved April 09, 2021, from https://www.jstor.org/stable/10.5951/mathteacher.110.2.0 098
- Indo-Asian News Service (IANS). IPL has changed the dynamics of cricket, says BCCI boss Anurag Thakur: Cricket, News. India Today. Retrieved 17 April 2021. https://www.indiatoday.in/sports/cricket/story/bccipresident-anurag-thakur-on-indian-premier-league345331-2016-10-06
- Illowsky B, Dean S. Linear Regression and Correlation. Introductory Statistics (Open Stax). The Libre Texts Libraries. The UC Davis Library, the California State University Affordable Learning Solutions Program. Retrieved 07 April, 2021. From https://stats.libretexts.org/Bookshelves/Introductory_Stati stics/Book%3A_Introductory_Statistics_(OpenStax)/12% 3A_Linear_Regression_and_Correlation/12.05%3A_Test ing_the_Significance_of_the_Correlation_Coefficient 10. Indian Premier League. (n.d). IPL. Retrieved April 06, 2021. From http://iplfixture.com
Cited by 1
From OpenAlex, OpenCitations and reference lists read by Scinovex
- A Structured Analysis on IPL 2022 matches by approaching various Data Visualization and Analytics ↗
S. Selva Birunda, P. Nagaraj, B. Jency A Jebamani, B Revathi, V. Muneeswaran · International Conference on Computer Communication and Informatics (ICCCI) · 2023
The main purpose of making this report is to give the information to the franchise to make their decision on buying the players by bidding in the auction based on their performances. There are many models of reports which describe the IPL seasons. This report’s purpose is to give a brief analysis of the IPL 202215th league. In this report,…
❝ 5