
Research article · 2021 · Full text
International Journal of Advanced Biochemistry ResearchCorrelations between dyslipidemia and cardiovascular disease in patients of type 2 diabetes mellitus
Volume 5(1) · Pages 20–23 · DOI: 10.33545/26174693.2021.v5.i1a.60 ↗
Research areasDiabetes, Cardiovascular Risks, and LipoproteinsLiver Disease Diagnosis and TreatmentLipoproteins and Cardiovascular Health
Abstract
Author-writtenHyperlipidemia in association with insulin resistance is common in patients with type 2 diabetes mellitus. Insulin resistance and the ensuing hyperinsulinemia are associated with hypertriglyceridemia and low serum high-density lipoprotein (HDL) cholesterol concentrations. The lipoprotein abnormalities are related to the severity of the insulin resistance. The venous blood was collected for both fasting and post prandial for blood sugar estimation. The fasting blood samples were collected for the estimation of serum Total cholesterol, serum Triglycerides and serum HDL cholesterol estimation. In this study it was found that though the patients were on oral hypoglycaemic drugs and some patients were on Insulin the fasting blood sugar and post prandial blood sugar are significantly high in study groups when compared to control groups (P< 0.001).
Summary
Source-checkedPlain-language reading of the full paper, prepared with AI and checked against the text. Each point links to the authors' own words.
Why it matters
- Diabetes is a significant independent risk factor for cardiovascular disease (CVD), which is up to four times more common in diabetic patients, with half showing evidence of CVD upon diagnosis. View evidence ↗
- Macrovascular complications, primarily cardiovascular, cerebrovascular, and peripheral vascular diseases, are estimated to cause 75% to 80% of deaths related to diabetes. View evidence ↗
- Atherogenic dyslipidemia is characterized by abnormal lipid concentrations, specifically increased plasma triglycerides, reduced HDL cholesterol, and the presence of small, dense LDL particles. View evidence ↗
The question
- The study aims to investigate the correlations between dyslipidemia and cardiovascular disease in patients with type 2 diabetes mellitus. View evidence ↗
What they did
- Researchers collected venous blood for fasting and postprandial blood sugar, as well as fasting samples to estimate serum total cholesterol, triglycerides, and HDL cholesterol. View evidence ↗
- For patients with myocardial infarction, random blood samples were collected between 6 to 12 hours to measure serum CK-MB, SGOT, and lactate dehydrogenase. View evidence ↗
What they found
- The study group had significantly higher mean fasting blood sugar (164.0667 mg/dl vs 103.0333 mg/dl) and postprandial blood sugar (212.0000 mg/dl vs 118.0333 mg/dl) than the control group (p < 0.001). View evidence ↗
- Total cholesterol (230.7333 mg/dl vs 185.1000 mg/dl) and triglycerides (228.3667 mg/dl vs 156.0000 mg/dl) were significantly higher in the study group compared to the control group (p < 0.001). View evidence ↗
- The study group exhibited significantly lower mean HDL cholesterol levels (29.4000 mg/dl) compared to the control group (38.9333 mg/dl) (p < 0.001). View evidence ↗
- LDL cholesterol (154.7000 mg/dl vs 114.6333 mg/dl) and VLDL cholesterol (46.6333 mg/dl vs 31.5333 mg/dl) were significantly elevated in the study group (p < 0.001). View evidence ↗
- Serum CK-MB levels were significantly higher in the study group (147.5000 IU/L) compared to the control group (19.8667 IU/L) (p < 0.001). View evidence ↗
- The study group showed significantly higher levels of SGOT (118.3333 IU/L vs 27.8000 IU/L) and LDH (617.1667 IU/L vs 360.1667 IU/L) than the control group (p < 0.001). View evidence ↗
What it means
- The authors conclude that CK-MB levels are significantly elevated in type 2 diabetic patients with myocardial infarction, and higher values correlate with cardiovascular complications and mortality. View evidence ↗
- The authors state that SGOT levels were elevated in the diabetic study group relative to the control group. View evidence ↗
Visual summary
3 visualsIllustrations explain the paper; charts are replotted from the paper's own table values.
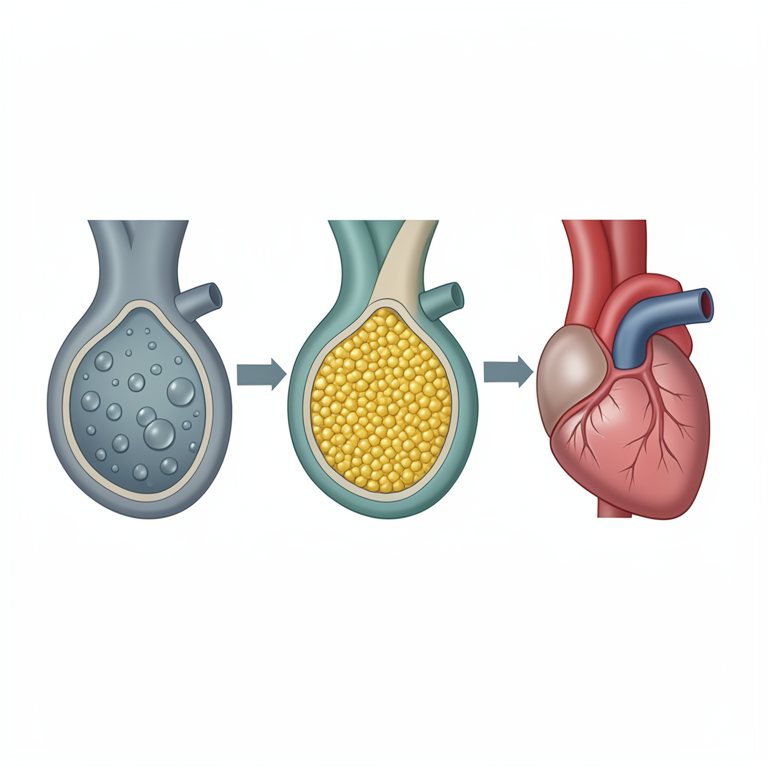
Pathways of Diabetic Cardiovascular Risk
AI-generated conceptual illustration (human cardiovascular system and blood vessels). It explains the idea and does not show study data.
View source evidence ↗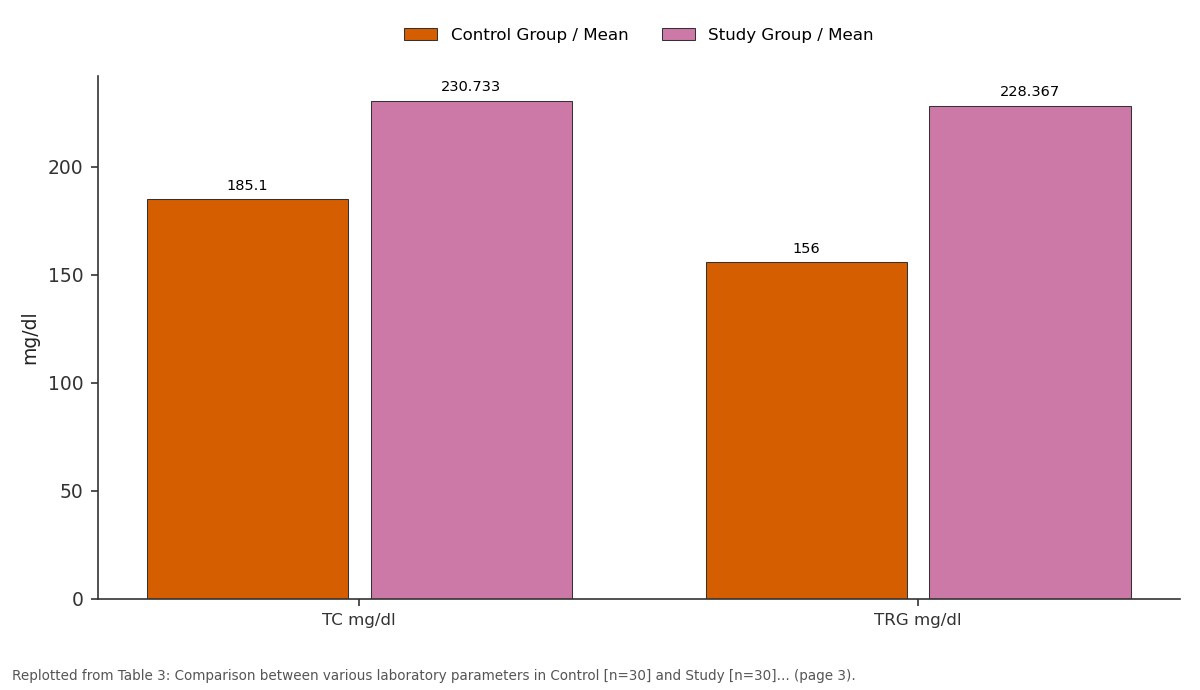
Control Group / Mean and Study Group / Mean: TC mg/dl vs TRG mg/dl
Replotted from Table 3 (page 3) of the original paper. Every bar is the paper's own table value.
View source evidence ↗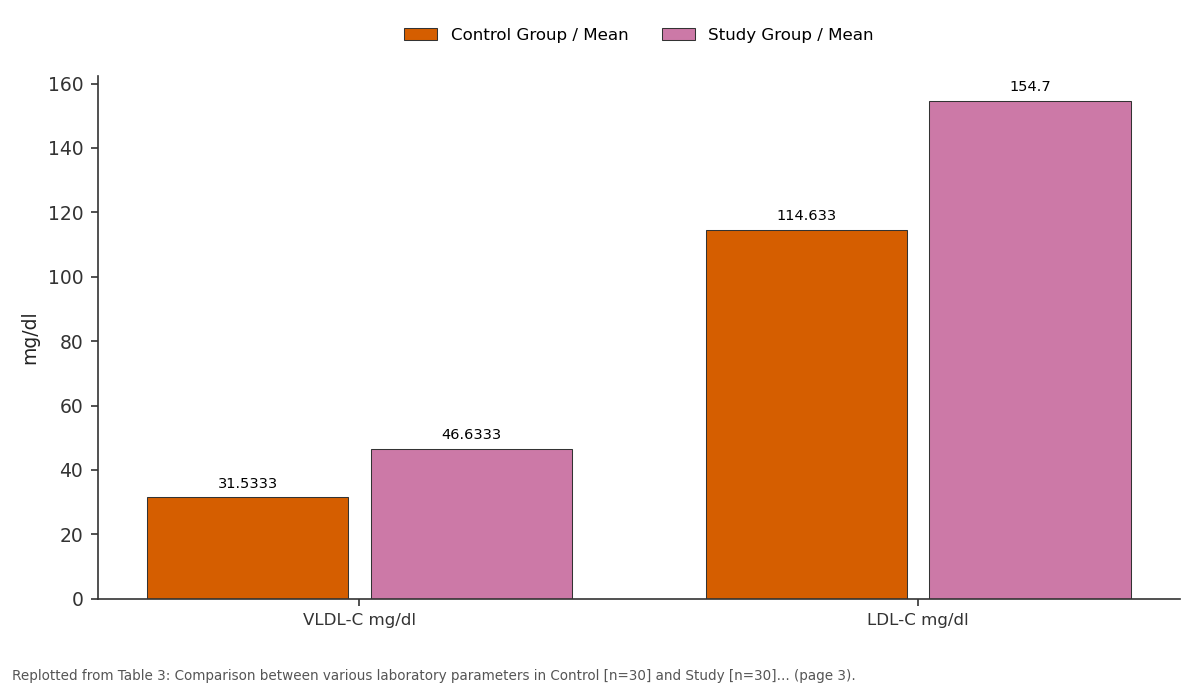
Control Group / Mean and Study Group / Mean: VLDL-C mg/dl vs LDL-C mg/dl
Replotted from Table 3 (page 3) of the original paper. Every bar is the paper's own table value.
View source evidence ↗Figures & tables
From the original paper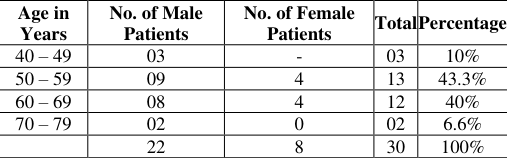 Table 1
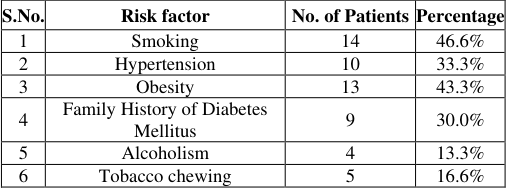 Table 2
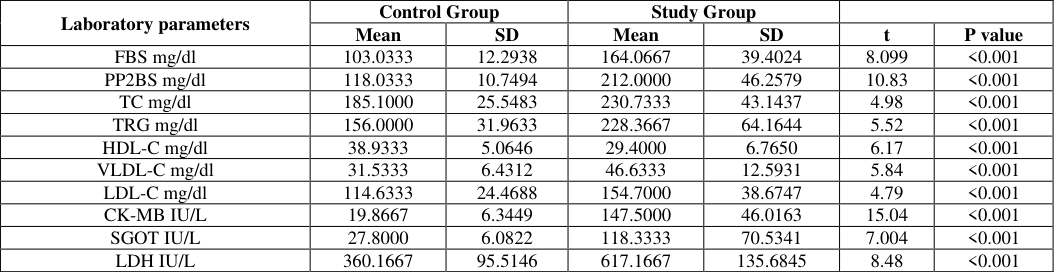 Table 3
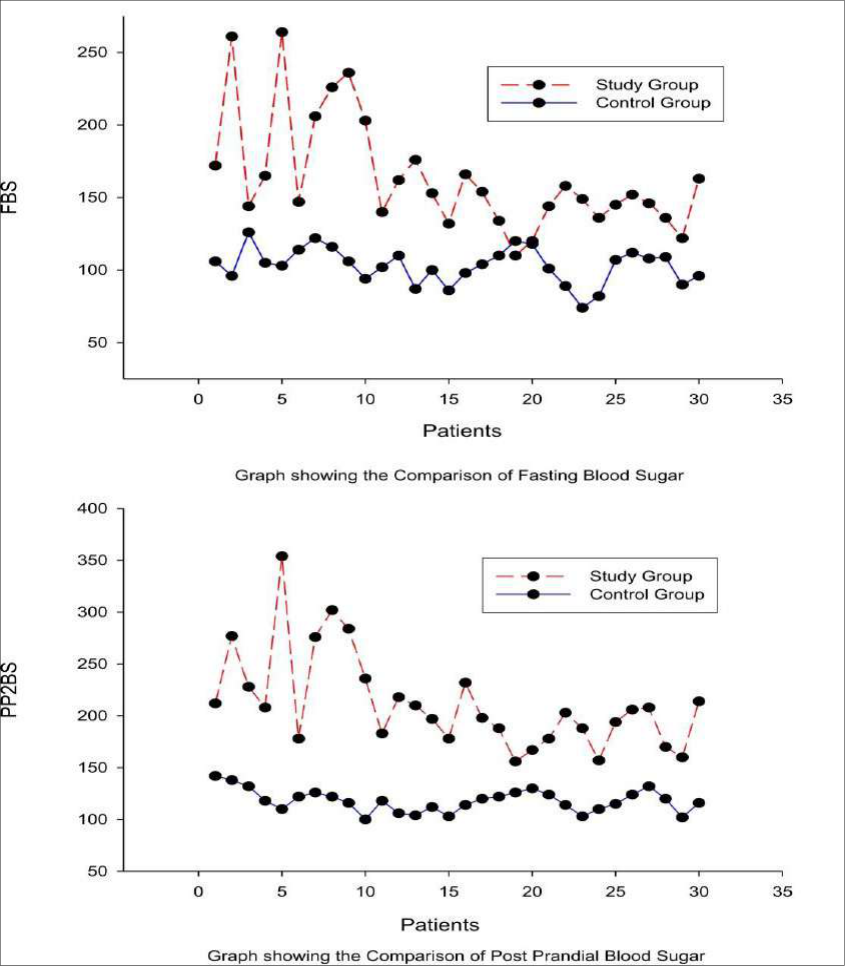 Figure 1
Introduction
Diabetes is well recognized as an independent risk factor for cardiovascular disease (CVD) in men and women. CVD is up to four times more common in people with diabetes than in those without, and 50% of diabetic people have evidence of CVD at the time of diagnosis [1] . Post-infarction mortality is significantly higher in people with diabetes than in those without. It is estimated that 75 to 80% of diabetes related deaths are attributable to the macro vascular complications of the disease primarily cardiovascular disease, cerebrovascular disease, and peripheral vascular disease. Atherosclerotic macrovascular complications occur at an earlier age and with greater severity in people with diabetes, and its pathogenesis is directly influenced by the diabetic state. Long term exposure to elevated glucose levels can contribute to the endothelial dysfunction observed in diabetes. Increasing evidence suggests that endothelial dysfunction may play a central role in the development of atherosclerosis. Endothelial dysfunction is characterized by inhibited vasodilatation, increased proliferation of vascular smooth muscle, increased thrombogenesis, and proatherogenic cellular processes [2] . Accelerated atherosclerosis, endothelial dysfunction have been linked with increased thrombosis, hypertension, and dyslipidemia, all of which contribute to the pathogenesis of vascular disease in diabetes. The dyslipidaemia is a condition marked by an abnormal concentration of lipids or lipoproteins in the blood, the typical atherogenic dyslipidemia includes increased plasma triglyceride levels as well as reduced HDL Cholesterol concentration and the presence of small, dense LDL cholesterol particles. The prevalence of dyslipidemia varies with the population being studied. The incidence is highest in patients with premature coronary heart disease (CHD), which can be defined as occurring before 55 to 60 years of age in men and before 65 years in women. In this setting, the prevalence of dyslipidemia is as high as 75 to 85% compared to approximately 40 to 48% in age-matched controls without CHD [3] . Hyperlipidemia in association with insulin resistance is common in patients with type 2 diabetes mellitus. Insulin resistance and the ensuing hyperinsulinemia are associated with hypertriglyceridemia and low serum high-density lipoprotein (HDL) cholesterol concentrations.
The lipoprotein abnormalities are related to the severity of the insulin resistance. A study that measured insulin sensitivity using a euglycemic clamp in patients with and without type 2 diabetes mellitus found that greater insulin resistance was associated with large, very low density lipoprotein (VLDL) particle size, small low density lipoprotein (LDL) particle size, and small HDL particle size. Additionally, the number of VLDL, intermediate density lipoprotein (IDL), and LDL particles increased with increasing insulin resistance. Hypertriglyceridemia results both from increased substrate availability (glucose and free fatty acids) and from decreased lipolysis of VLDL triglyceride. According to the centers for disease control and prevention (CDC), 97% of adults with diabetes have one or more lipid abnormalities. The central characteristic of dyslipidemia in type 2 diabetes is an elevated triglyceride level, particularly triglyceride-rich VLDL levels and decreased HDL cholesterol levels. The concentration of LDL cholesterol is usually not significantly different from that seen in nondiabetic individuals [4,5] . Type 2 diabetes typically has a preponderance of small, dense, oxidized LDL particles, which may increase atherogenicity, even if the absolute concentration of LDL cholesterol is not elevated [6] .
Methodology
The patients in this study were selected according to the following criteria.
Inclusion criteria
Inclusion criteria
Specimen collection
The venous blood was collected for both fasting and postprandial for blood sugar estimation. The method used for Estimation of Blood sugar levels Glucose Oxidase and Peroxidase Method
Principle
The substrate β D-Glucose is oxidized by Glucose oxidase to form gluconic acid and hydrogen peroxide. The hydrogen peroxide, so generated, oxidizes the chromogen system consisting of 4-amino antipyrine and phenolic compounds to a red Quinoneimine dye. The intensity of the colour produced is proportional to the glucose concentration and is measured colourimetrically at 505 nm (490-530) or with a green filter.
Results
Table In this study, it was found that although the patients were on oral hypoglycaemic drugs and some patients were on insulin the fasting blood sugar and postprandial blood sugar are significantly higher in study groups when compared to control groups (P<0.001). This suggests that in diabetic subjects at hyperglycemia, there is both a decrease in responsiveness and a decrease in sensitivity to insulin. It is well established that in type 2 diabetes exhibits peripheral insulin resistance in target tissues.
In the hyperinsulinemic euglycemic clamp technique, a research method for measuring peripheral insulin resistance shows that the glucose disposal rate is reduced by at least 50% in subjects with type 2 diabetes [7] .
Discussion
Distribution according to sex showed 73.3% were males and 26.6% were females. There were no female patients below the age of 50 years. Myocardial infarction can occur at any age and sex, but generally, it is a disease in middle age and older individuals: Minitz-Katzs [8] reported an incidence 66.3% in the age group of 50-59 years. Julien et al. [9] In their prospective study of 100 unselected patients reported a maximum incidence of 62.0% in the age group of 50-59 years.
In the present study, the maximum incidence of acute myocardial infarction was in the age range of 52-60 years (53.3). Men are frequently the victims of acute myocardial infarction. This has probably to do with the stressful life and the high incidence of smoking. Probably females are protected during their reproductive period by sex hormones.
In the present study male to female ratio is (2:1). The ratio further decreased with the advancement of age. Men also developed infarction at an earlier age than females.
In the present study, the average age of presentation was 60.3 years. There were no female patients below the age of 50 years.
The data of the present study regarding age and sex match with the data published by Mintz-Katz [8] and Julien et al. [9] . This is considered one of the prime risk factors for CHD.
The earlier the age of detection, the greater the risk of CHD. Elevated serum cholesterol is associated with the risk of CAD. Specifically, a 10% increase in serum cholesterol is associated with a 20 -30% increase in the risk of CAD [10] .
In men it has been found that 41% of variants in CAD mortality were related to variation in serum cholesterol, 32% were related to variation in HDL-C and 55% of the variation in the ratio of total cholesterol to HDL cholesterol. Hypertension is a well-established risk factor for CAD. Both elevated systolic and diastolic blood pressures are clearly associated with an increased risk of CAD. A 7 mm Hg increase in diastolic blood pressure over any baseline reading was associated with a 27% increase in CAD risk and a 42% increase in stroke risk [11] . Obesity appears to have an independent risk for CAD, even after controlling the other risk factors. A higher BMI is associated with an increase in all the risk factors of CAD.
The distribution of body fat may also play a role in the development of CAD, with abdominal adiposity above the umbilicus posing a substantially greater risk in both men and women. A waist circumference of 35 inches in women and 40 inches in men is an easily measured marker of coronary artery disease risk [12] .
Conclusion
Serum levels of CK-MB were found significantly elevated in Myocardial Infarction patients with type 2 diabetic individuals when compared to controls. Higher values were obtained in patients who suffered cardiovascular complications and mortality. SGOT levels were elevated in the diabetic study group compared to controls.
Figures and tables from the paper
| S.No. | Risk factor | No. of Patients | Percentage |
|---|---|---|---|
| 1 | Smoking | 14 | 46.6% |
| 2 | Hypertension | 10 | 33.3% |
| 3 | Obesity | 13 | 43.3% |
| 4 | Family History of Diabetes Mellitus | 9 | 30.0% |
| 5 | Alcoholism | 4 | 13.3% |
| 6 | Tobacco chewing | 5 | 16.6% |
Table text extracted from the original PDF; superscript letters are shown inline. The original table image is below.
View original table image
| Laboratory parameters | Control Group | — | Study Group | — | — | — |
|---|---|---|---|---|---|---|
| Mean | SD | Mean | SD | t | P value | |
| FBS mg/dl | 103.0333 | 12.2938 | 164.0667 | 39.4024 | 8.099 | <0.001 |
| PP2BS mg/dl | 118.0333 | 10.7494 | 212.0000 | 46.2579 | 10.83 | <0.001 |
| TC mg/dl | 185.1000 | 25.5483 | 230.7333 | 43.1437 | 4.98 | <0.001 |
| TRG mg/dl | 156.0000 | 31.9633 | 228.3667 | 64.1644 | 5.52 | <0.001 |
| HDL-C mg/dl | 38.9333 | 5.0646 | 29.4000 | 6.7650 | 6.17 | <0.001 |
| VLDL-C mg/dl | 31.5333 | 6.4312 | 46.6333 | 12.5931 | 5.84 | <0.001 |
| LDL-C mg/dl | 114.6333 | 24.4688 | 154.7000 | 38.6747 | 4.79 | <0.001 |
| CK-MB IU/L | 19.8667 | 6.3449 | 147.5000 | 46.0163 | 15.04 | <0.001 |
| SGOT IU/L | 27.8000 | 6.0822 | 118.3333 | 70.5341 | 7.004 | <0.001 |
| LDH IU/L | 360.1667 | 95.5146 | 617.1667 | 135.6845 | 8.48 | <0.001 |
Table text extracted from the original PDF; superscript letters are shown inline. The original table image is below.
View original table image
References
11 in the original paper- Roberts R. The two out of three criteria for the diagnosis of infarction: Is it passé? Chest. 1984;86(4):511-513.
- Multiple Risk Factor interventional trial (MRIFT) circulation. 1987;75(2):6-8.
- Robert R, MD. Preventing Cardiovascular Complications of Type 2 Diabetes: Focus on Lipid management. Clinical diabetes. 2001;19(3):113-20.
- Durrington P. Dyslipidaemia. University Department of Medicine, Manchester Royal Infirmary, Oxford Road, M13 9WL, Manchester, UK. Lancet. 2003;362(9385):717-31.
- Genest JJ Jr, et al. Familial lipoprotein disorders in patients with premature coronary artery disease. Circulation. 1992;85(6):2025-33.
- Roncaglioni MC, et al. Role of family history in patients with myocardial infarction. An Italian casecontrol study. GISSI-EFRIM Investigators. Circulation. 1992;85(6):2065-72.
- Kwon S, et al. Effects of insulin resistance and type 2 diabetes on lipoprotein subclass particle size and concentration determined by nuclear magnetic resonance. Diabetes. 2003;52(2):453-62.
- Mintz-Katz. Recent MI Analysis of 570 cases Arch. Intein. Med. 1947;80:205.
- Sima JS, La-Due JS, Worblewski F. Significance of SGOT activity following acute myocardial infaction circulation. 1955;11:871.
- Wilson P, Agostino WD, Levy RB, et al. Predictors of coronary heart disease using risk factor categories. Circulation. 1998;97:1837-1847.
- Rimm E. Stampfer A, et al. Body size and fat distribution as predictors of CAD. Am. Jr. Epidemiology. 1995;141(12):1117-1127.