
Research article · 2021 · Full text
International Journal of Advanced Biochemistry ResearchComparative study of HBA1C & superoxide dismutase in type II diabetes mellitus in Jalgaon district
Volume 5(1) · Pages 39–41 · DOI: 10.33545/26174693.2021.v5.i1a.64 ↗
Research areasNatural Antidiabetic Agents StudiesArtificial Intelligence in HealthcareAdipokines, Inflammation, and Metabolic Diseases
Abstract
Author-writtenType II diabetes formerly known as adult-onset diabetes, is a type of diabetes that is characterized by high blood sugar, insulin resistance, and relative lack of insulin due to obesity, lack of exercise or genetically determined. HbA1c in diabetic patients provides valuable information about the changes occurring in the blood glucose level over last three months. SOD is considered as a first line Defense against ROS, as it is present in almost all cells and it deals with the most hazardous radicals i.e. Superoxide (O2-). Oxidative stress is in the foreground of diabetes which increases with increase in severity of diabetes, keeping these facts in mind the present study was designed to compare SOD level in type II D.M in Jalgaon district. In the present study, we got inverse correlation (non-significant correlation) in these two parameter. As the levels of HbA1c increases there is decrease in SOD levels which indicates that as the severity of diabetes increases the levels of SOD decreases.
Summary
Source-checkedPlain-language reading of the full paper, prepared with AI and checked against the text. Each point links to the authors' own words.
Why it matters
- Type II diabetes is characterized by insulin resistance, high blood sugar, and a relative lack of insulin, which can be caused by genetics, lack of exercise, or obesity. View evidence ↗
- HbA1c is a useful marker for monitoring blood glucose changes over a three-month period in diabetic patients. View evidence ↗
- Superoxide dismutase (SOD) acts as a primary defense against reactive oxygen species (ROS), specifically targeting hazardous superoxide radicals. View evidence ↗
The question
- The study aimed to compare HbA1c and SOD levels in patients with type II diabetes mellitus and determine if a correlation exists between them. View evidence ↗
What they did
- The study included 110 healthy controls and 110 diabetic patients with blood glucose levels exceeding 180 mg/dl, matched for age and sex. View evidence ↗
- The research took place in Jalgaon between September 2018 and May 2020. View evidence ↗
- HbA1c was measured using the Ion Exchange Resin method, and RBC SOD activity was measured using the Kajari Das method. View evidence ↗
- Numerical variables were compared using a Student unpaired 't' test, and the correlation between HbA1c and SOD was analyzed using Karl Pearson's Coefficient. View evidence ↗
What they found
- The mean HbA1c was significantly higher in type II diabetic patients (9.03 ± 0.57%) compared to healthy controls (4.96 ± 0.60%), with p < 0.001. View evidence ↗
- SOD activity was significantly lower in type II diabetic patients (3.00 ± 0.44 U/gm. of HB) than in healthy controls (5.25 ± 0.49 U/gm. of HB), with p < 0.001. View evidence ↗
- A non-significant inverse correlation (r = -0.28) was found between HbA1c and SOD, meaning SOD levels tended to decrease as HbA1c levels increased. View evidence ↗
What it means
- The authors conclude that increasing diabetes severity reduces SOD activity, leading to oxidative stress, and suggest that maintaining good glycemic control may reduce this stress. View evidence ↗
Visual summary
2 visualsIllustrations explain the paper; charts are replotted from the paper's own table values.
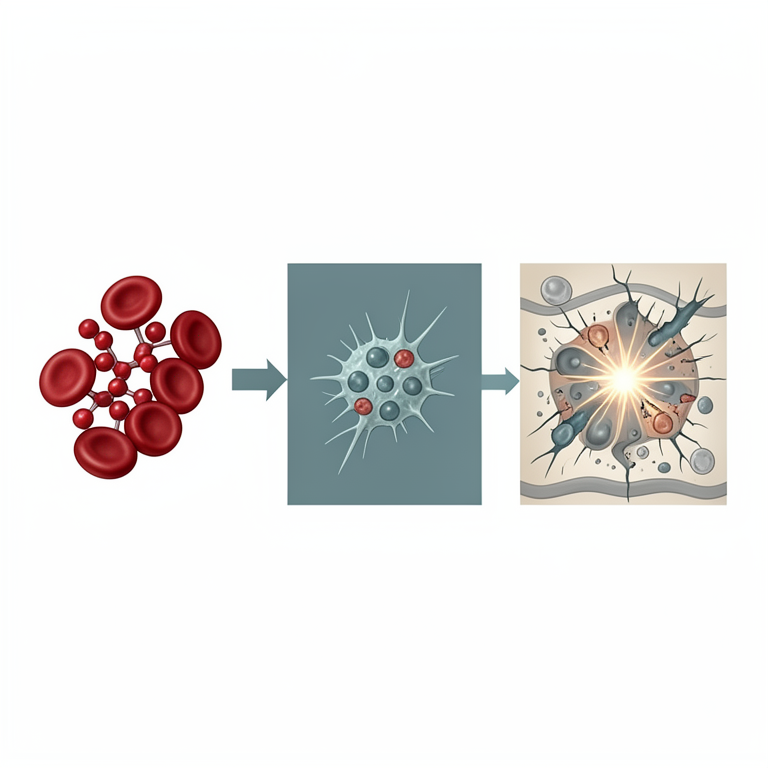
Relationship between Glycemic Control and Antioxidant Defense
AI-generated conceptual illustration (human blood cells and enzymes). It explains the idea and does not show study data.
View source evidence ↗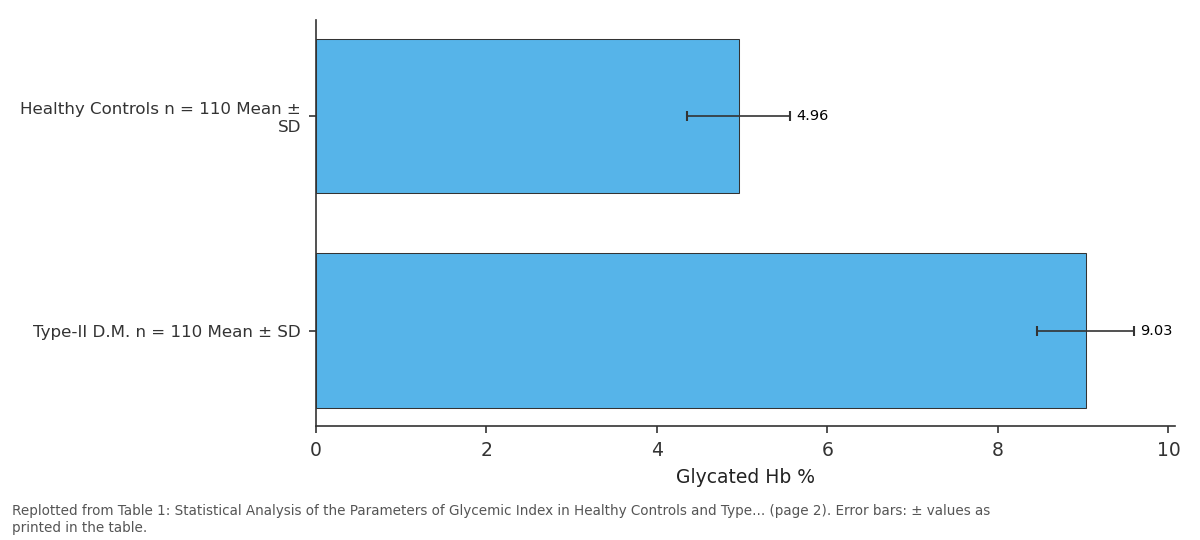
Glycated Hb %: Healthy Controls n =... vs Type-II D.M. n = 110...
Replotted from Table 1 (page 2) of the original paper. Every bar is the paper's own table value.
View source evidence ↗Figures & tables
From the original paper Table 1
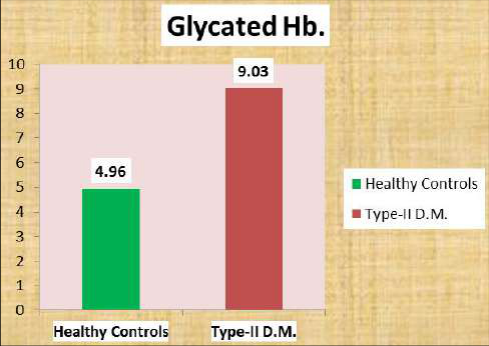 Figure 1
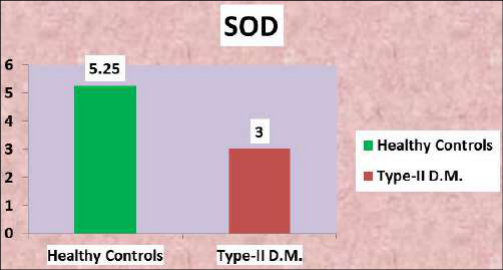 Figure 2
Introduction
The glucose molecule in the blood normally binds to the haemoglobin molecule -known as glycated haemoglobin (HbA1c) or glycation. Its level is increased in diabetes mellitus and thus monitoring the levels of HbA1c in diabetic patients provides valuable information about the changes occurring in the blood glucose level over the period of three months. Diabetes is a metabolic disorder and is generally accompanied by increased levels of free radicals and decreased activity of antioxidants and various studies suggest that increased oxidative stress in diabetes mellitus may be due to increased formation of glycated haemoglobin (HbA1c). This increased glycation is thus involved in the progression of diabetes and its complications.
[ Yau JWY, et al., 2012 & the int. expert committee, 2009] [10,2] . Oxidative stress produced is characterized by the production of different free radicals. One of this free radical is superoxide (O 2 -) which causes cellular damage. SODs are a ubiquitous family of enzymes that function to efficiently catalyze the disputation of superoxide anion. In the body there is a defense system which is actively engaged in destroying free radicals, e.g. Vitamins such as vitamin E, and vitamin C, enzymes such as catalase, superoxide dismutase, reduced Glutathione [Stitt A.W, 2009] [8] . SOD is considered a first-line defence against ROS, as it is present in almost all cells and it deals with the most hazardous radicals i.e. Superoxide (O 2 -). [Maxwell S.R, et al, 2003] [5] Oxidative stress is in the foreground of diabetes. It increases with an increase in severity of diabetes, keeping these facts in mind the present study was designed to compare the levels of HbA1c and SOD in type II D.M. and to see whether there is any correlation between these parameters.
Aims and Objectives
The aim of the present study was to 1. Determine the activity of superoxide dismutase in erythrocyte (RBC-SOD). 2. To determine the levels of glycated haemoglobin (HbA1c) in type II D.M. patients (without any complications). 3. To evaluate the correlation between the above parameters in the patients having type II D.M.
Materials and Methods
Materials and Methods
Statistical Analysis
All the biochemical parameters measured in study group subjects were statistically compared with those estimated in controls. Results were presented as mean ± SD. Student unpaired 't' test used for statistical analysis between controls and cases for numerical variables.
The correlation between HbA1c and SOD was found out by using Karl Pearson's Coefficient.
Results and Observation
Results and Observation
Discussion
Oxidative stress is one of the important factors playing pathological role in diabetic complications and is a status in which disturbance in the balance between oxidants and natural antioxidants is seen. There are many possible explanations for increased oxidative stress observed in patients with D.M., one of them could be higher rates of glycation. Proposals have been made suggesting that increased glycation itself can lead to the production of free radicals [Palanduz S, et al, 2001] [7] . HbA1c can provide an accurate and reliable method to assess routinely the relative level of glycemic control. In the present study, table no. 1 and figure 1 and2 shows levels of glycated hemoglobin and SOD in healthy controls and type II diabetic patients. In diabetic patients, the mean HbA1C was increased as compared to control, this difference was statistically significant (p<0.001) when compared between study cases and healthy control subjects. Superoxide Dismutase (SOD) is one of the defenses against oxidative stress. It catalyzes the dismutation of superoxide radicals to oxygen and hydrogen peroxide (H 2 O 2 ). SOD is thought to be one of the major enzymes that protect cells from ROS. In the present study, figure no. 2 shows that erythrocyte SOD activity was significantly decreased in type 2 diabetic patients (without any complications) as compared to healthy controls (P<0.001). Hyperglycemia seen in diabetes activates many reactions such as glucose autoxidation, non-enzymatic glycation of proteins, and activation of protein Kinase C. This results in the overproduction of Superoxide, Hydroxyl radicals and Hydrogen peroxide. So there is every possibility that while quenching superoxide, SOD may be utilized or SOD is inhibited by these oxidants and this causes a reduction in the SOD activity. Palanduz S et al. [7] observed that the SOD activity significantly decreased in diabetes mellitus. They suggested that there seems to be an imbalance between plasma oxidant and antioxidant systems in patients with type II diabetes. [Palanduz S, et al, 2001] [7] . Abdol Ijalal Marjani et al. also found decreased erythrocyte SOD enzyme activity with type II diabetes as compared to controls. These results led us to think if there is a relation between HbA1c level and SOD. This is the reason; we have correlated these two parameters by using Karl Pearson's Coefficient. In the present study, we observed a non-significant inverse correlation ('r' value = -0.28). As the levels of HbA1c increase, there is a decrease in SOD levels. It indicates that there is an influence of glycemic control on antioxidant levels in diabetic subjects.
Conclusion
From the present study, it is concluded that oxidative stress is in the foreground of diabetes. HbA1c the marker of glycemic control was compared with the oxidative stress marker SOD. There is an inverse correlation observed between these two markers. This indicates that as the degree of severity of diabetes increases, there is a decrease in SOD activity which leads to oxidative stress. It suggests that good glycemic control can reduce oxidative stress in diabetes mellitus.
Figures and tables from the paper
| Parameters | Healthy Controls n = 110 Mean ± SD | Type-II D.M. n = 110 Mean ± SD | ‘t’ value | p-value | ‘r’ value |
|---|---|---|---|---|---|
| Glycated Hb % | 4.96 ± 0.60 | 9.03 ± 0.57 | 4.99 | <0.001 | -0.28 |
| SOD (U/gm. of HB) | 5.25 ± 0.49 | 3.00 ± 0. 44 | 25.83 | <0.001 |
Table text extracted from the original PDF; superscript letters are shown inline. The original table image is below.
View original table image
References
10 in the original paper- Abdol Jalal Marjani. Plasma lipid peroxidation zinc and erythrocyte Cu -Zn superoxide dismutase enzyme activity in patients with type 2 diabetes mellitus in Gorgan city (south east of the Caspian Sea). The Internet Journal of Endocrinology. 2007;7(4):585-90. DOI: 10.5580/126b.
- The International Expert Committee. International Expert Committee report on the role of the A1C assay in the diagnosis of diabetes. Diabetes Care. 2009;32(7):1327-34.
- Irshad M, Choudhari PS. Oxidant and antioxidant system: role and significance in human body. Indian J Exp Biol. 2002;40:1233-9.
- Kajari-Das, Luna Samanta, Chainy GBN. A modified spectrometric assay of superoxide dismutase using nitrite, Formation by superoxide radicals. Indian Journal of Biochemistry and Biophysics. 2000;37:201204.
- Maxwell SR, Thomason H, Sandler D, Le Guen C, Baxter MA, Thorpe GH, et al. Poor glycaemic control is associated with reduced serum free radical scavenging (antioxidant) activity in non-insulindependent diabetes mellitus. Ann Clin. Biochem. 1997;34(6):638-644.
- Misra H, Fridovich I. Estimation of superoxide dismutase. J Biochem. 1972;247:3170-3178.
- Palanduz S, Ademoglu E, Gokkusu C, Tamer S. Res Commun Molpatholpharmocol. 2001;109(56):309-318.
- Stitt AW. The role of advanced glycation in the pathogenesis of diabetic retinopathy. Exp Mol Pathol 2003;75(1):95-108. [PubMed]
- Trivelli LA, Ranney PH, Lai HT. Estimation of Glycated Haemoglobin by Resin Binding Method. New Eng. J. Med. 1971;197(284):353.
- Yau JWY, Rogers SL, Kawasaki R. Global prevalence and major risk factors of diabetic retinopathy. Diabetes Care. 2012;35(3):556-64. [PubMed].
Cited by 1
From OpenAlex, OpenCitations and reference lists read by Scinovex
- Separate and Combined Effects of Resistance Training and Cucumber (Cucumis sativus) Juice Consumption on the Diabetic Indicators and Lipid Profile in Women with Type 2 Diabetes ↗
Maryam Lotfi, Naser Behpoor, Mehrali Rahimi, Afshar Jafari · Journal of Kermanshah University of Medical Sciences · 2023
Background: Type 2 diabetes is a metabolic disease with many consequences. Objectives: This study aimed to evaluate the separate and combined effects of resistance training and cucumber (Cucumis sativus) juice consumption on diabetic indicators and lipid profiles in women with type 2 diabetes. Methods: Women with type 2 diabetes (n = 40) were assessed in a randomized, double-blind study and…
❝ 4PDF