
Research article · 2020 · Full text
International Journal of Agriculture Extension and Social DevelopmentIndicators of crop diversification
Volume 3(2) · Pages 65–67 · DOI: 10.33545/26180723.2020.v3.i2b.56 ↗
Research areasAgricultural Economics and Practices
Abstract
Author-writtenThis paper analyzes the indicators of crop diversification in Tirunelveli district of Tamil Nadu. Crop diversification is nothing more than a change in crop trends, moving from traditionally grown crops with fewer benefits to more benefit crops to improve income and sustainability in agriculture. Crop diversification can be used as a better strategy to cope with the risk that arises due to mono cropping. The State economy of Tamil Nadu is dependent on agriculture. It was found that, over the years the proportion of significant cereal crops such as paddy, groundnut and cholam has decreased.We studied about the indicators of crop diversification in Tirunelveli district of Tamil Nadu using the primary data. Non – Experimental Research design was used for this study purpose. A sample size of 120 respondents was fixed for the study using proportionate random sampling technique. It was found that out of twenty two variables selected for the study, the variable family size had contributed positively to crop diversification and significant at one per cent level of probability. Scientific orientation and Credit orientation had contributed positively to crop diversification and significant at five per cent level of probability.
Summary
Source-checkedPlain-language reading of the full paper, prepared with AI and checked against the text. Each point links to the authors' own words.
Why it matters
- Crop diversification involves shifting from traditional crops with low benefits to more beneficial ones to enhance agricultural sustainability and income. View evidence ↗
- Diversifying crops serves as a strategy to mitigate the risks associated with mono-cropping. View evidence ↗
- Many countries adopt crop diversification because mono-cropping degrades soil fertility. View evidence ↗
The question
- The study aimed to identify the indicators of crop diversification within the Tirunelveli district of Tamil Nadu. View evidence ↗
What they did
- The researchers used a non-experimental research design with a sample of 120 respondents selected via proportionate random sampling. View evidence ↗
- The study evaluated 22 independent variables as potential indicators of crop diversification. View evidence ↗
What they found
- Several variables, including age and farm size, were found to be non-significant (NS) indicators of crop diversification. View evidence ↗
What it means
- The authors conclude that larger family sizes encourage crop diversification because they reduce the external labor force required for production. View evidence ↗
- The authors state that the timely availability of credit is a key factor that helps farmers adopt new techniques and move toward crop diversification. View evidence ↗
Figures & tables
From the original paper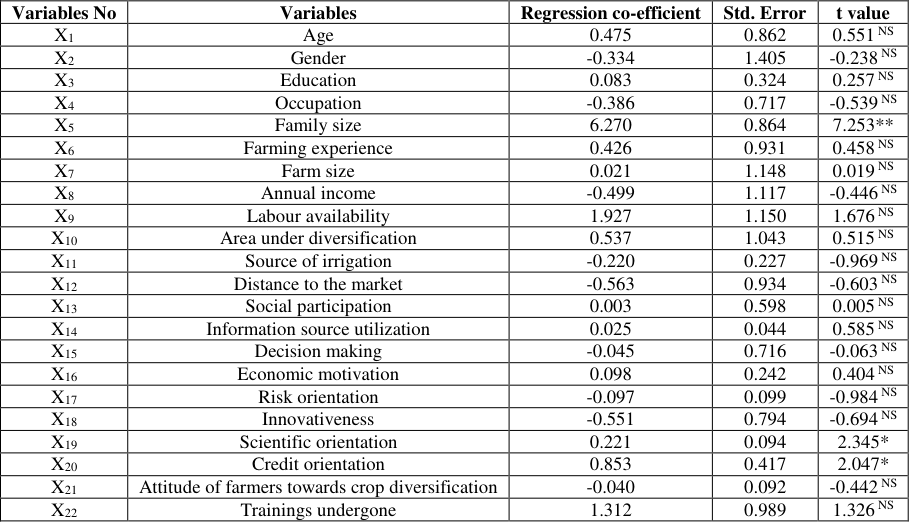 Table 1
Introduction
In India, agriculture is characterized by the small farm sizes. The average farm size is approximately 1.57 ha. Approximately 93 percent of farmers have a smaller farm size than 4 ha. They contribute about 55 per cent of the total land available for cultivation. Only 1.6 percent of farmers with a farm size of more than 10 ha contribute approximately 17.4 percent of the total cultivable land. There is continuous rush for diversified crop-related agriculture after the Green revolution. Indian agriculture switched to non-cereal crops to improve revenue and sustainability in agriculture. Crop diversification is one of the best ways to increase farmers income and also contributes to food, nutritional and environmental protection. By offering job opportunities, it helps in eradicating poverty. As the mono crop weakens soil fertility, many countries have moved towards crop diversification to increase soil fertility as well as sustainability in agriculture. In Sub Sahara Africa, crop diversification is used as an important strategy for increasing income, reducing risk, and growing a wide range of crops in a particular area. In 2004, several cycles of droughts severely affected Zambia. Zambia's government has promoted crop diversification with the goal of increasing farm household food security and nutrition status. Hazra (2001) studied change in cropping pattern at the triennial ending (TE) of the years 1966-67, 1976-77, 1986-87 and 1996-1997. The first one is pre-Green revolution period and the other three are post-Green revolution periods. It was found that production of wheat was concerned more in the period of pre-Green revolution (1966-1967). In the second TE, (1976-77) new technologies were introduced, irrigation facilities were made available to small farms and production of rice was concerned more. The third period (1986-87 to 1996-97) number of policies were launched including, Technology Mission on Oilseeds (TMO) as well as price support and stabilization policies for oilseed crops. In this paper an attempt was made to study the indicators of crop diversification in Tirunelveli district of Tamil Nadu.
Objective To study the indicators of crop diversification among the selected respondents.
Review of literature
Sichoongwe et al. (2014) [1] found that farm size and market distance were significant and had a positive effect on crop diversification, while farmers' age was not significant and had a negative impact on crop diversification, respectively. Kankwamba et al. (2012) [2] reported that farmers' level of gender and education had a negative effect on crop diversification whereas farmers' family size had a positive effect on crop diversification. Benin et al. (2004) [3] found that education level of farmers had negative effect on crop diversification respectively. Mithiya et al. (2018) [4] found that farm size and farmers' per capita income were positive for crop diversification while access to irrigation had a negative impact on crop www.extensionjournal.com diversification. Basavaraj et al. (2016) [5] revealed that farm size, irrigation, house hold income and access to market were the variables found to be determinants of crop diversification. Cho et al. (2016) [6] found that farming experience, farm size, access to irrigation and market distance were the variables found to have positive and significant effects on crop diversification, while household age was found to be significant but had negative effects on crop diversification, respectively. Lawin et al. (2017) [7] found that that the variables found to be significant and had a positive effect on crop diversification were farmers' age, farmers' education level and distance to market, while family size was found to be significant but had a negative effect on crop diversification. Aneani et al. (2011) [8] reported that family size, farming experience and farm size of the farmers had negative effect on crop diversification.
Materials and Methods
The study was based on the primary data collected among the selected respondents. A sample size of 120 farmers was fixed as respondents. The 120 respondents were identified from the selected six villages from three blocks by applying proportionate random sampling method. A list of 22 independent variables that could possibly the indicators of crop diversification were prepared. The variables were Age (X1), Gender (X2), Educational status (X3), Occupational status (X4), Family size (X5), Farming experience (X6), Farm size (X7), Annual income (X8), Labour availability (X9), Area under diversification (X10), Source of irrigation (X11), Distance to the market (X12), Social participation (X13), Information source utilization (X14), Decision making (X15), Economic motivation (X16), Risk orientation (X17), Innovativeness (X18), Scientific orientation (X19), Credit orientation (X20), Attitude of farmers towards crop diversification (X21) and Trainings undergone (X22). To find out the functional relationship between dependent and the independent variables, multiple regressions analysis was used.
Results and Discussion
In order to find out the relative contribution of each variable with crop diversification, multiple regression analysis was performed and the results are presented in the table 1. It could be seen from the equation that out of twenty two variables selected for the study, the variable family size (X5) had contributed positively to crop diversification and significant at one per cent level of probability. Scientific orientation (X19) and credit orientation (X20) had contributed positively to crop diversification and significant at five per cent level of probability. This indicates that an unit increase in family size (X5), scientific orientation (X19) and credit orientation (X20) would result in increase of 6.270, 0.221 and 0.853 units respectively.
| Variables No | Variables | Regression co-efficient | Std. Error | t value |
|---|---|---|---|---|
| X1 | Age | 0.475 | 0.862 | 0.551 NS |
| X2 | Gender | -0.334 | 1.405 | -0.238 NS |
| X3 | Education | 0.083 | 0.324 | 0.257 NS |
| X4 | Occupation | -0.386 | 0.717 | -0.539 NS |
| X5 | Family size | 6.270 | 0.864 | 7.253** |
| X6 | Farming experience | 0.426 | 0.931 | 0.458 NS |
| X7 | Farm size | 0.021 | 1.148 | 0.019 NS |
| X8 | Annual income | -0.499 | 1.117 | -0.446 NS |
| X9 | Labour availability | 1.927 | 1.150 | 1.676 NS |
| X10 | Area under diversification | 0.537 | 1.043 | 0.515 NS |
| X11 | Source of irrigation | -0.220 | 0.227 | -0.969 NS |
| X12 | Distance to the market | -0.563 | 0.934 | -0.603 NS |
| X13 | Social participation | 0.003 | 0.598 | 0.005 NS |
| X14 | Information source utilization | 0.025 | 0.044 | 0.585 NS |
| X15 | Decision making | -0.045 | 0.716 | -0.063 NS |
| X16 | Economic motivation | 0.098 | 0.242 | 0.404 NS |
| X17 | Risk orientation | -0.097 | 0.099 | -0.984 NS |
| X18 | Innovativeness | -0.551 | 0.794 | -0.694 NS |
| X19 | Scientific orientation | 0.221 | 0.094 | 2.345* |
| X20 | Credit orientation | 0.853 | 0.417 | 2.047* |
| X21 | Attitude of farmers towards crop diversification | -0.040 | 0.092 | -0.442 NS |
| X22 | Trainings undergone | 1.312 | 0.989 | 1.326 NS |
Table text extracted from the original PDF; superscript letters are shown inline. The original table image is below.
View original table image
Conclusion
The overall assessment showed that out of twenty two variables selected for the study, the variable family size had contributed positively to crop diversification and significant at one per cent level of probability. Scientific orientation and credit orientation had contributed positively to crop diversification and significant at five per cent level of probability. It was evident that the farmer having more family size would tend to move towards crop diversification because it reduces the labour force involved in crop production strategies. Thus it showed positive effect on crop diversification and found to be significant. It could be seen from the result that the farmers using scientific methods would tend to diversify more crops. Hence the variable scientific orientation showed positive effect on crop diversification and found to be significant. Credit was considered as an important factor for the farmers to adopt new techniques in the field. Timely availability of credit would help the farmers to move towards crop diversification. Thus the variable, credit orientation had positive effect on crop diversification and found to be significant.
References
2 in the original paper- Sichoongwe K, Mapemba L, Ng'ong'ola D, Tembo G. The determinants and extent of crop diversification among smallholder farmers: A case study of Southern Province, Zambia. Intl Food Policy Res Inst. 2014, 5.
- Kankwamba H, Mapila MATJ, Pauw K. Determinants and spatiotemporal dimensions of crop diversification in Malawi. Project Report produced under a cofinanced research agreement between Irish Aid, USAID and IFPRI, Paper, 2012, (3).