
Research article · 2018 · Full text
International Journal of Agriculture Extension and Social DevelopmentAdoption monitoring study of sustainable intensification agricultural technologies in southern Ethiopia
Volume 1(2) · Pages 47–53 · DOI: 10.33545/26180723.2018.v1.i2a.89 ↗
Research areasAgricultural Innovations and Practices
Abstract
Author-writtenConducting adoption monitoring study of SIMLESA technologies used by farmers in the intervention areas used as a framework to identify the strength and weaknesses of the current systems and led to recommendations to improve their wider coverage and usage. Structured interviews were used to collect data from a randomly selected one hundred households of Hawassa Zuria, Misrak Badwacho and Meskan Districts the Sidama, Hadiya and Gurage zones of SNNPRs. The data analysis was performed using SPSS. This signifies that the respondents incorporated in this study had a close contact and knowledge of the project in each intervention woredas. Based on this study, majority of the farmers who were aware of maize bean intercropping, Hawassa dume and BH-543 were adopted the technology and in 2013 the number of farmers practicing the technology were increased apart from the previous years. However, the farmers who were aware of maize bean rotation and minimum tillage were adopted the technology and in 2013 the number of farmers practicing the technology were decreased as compared to the previous years. According to table 19 above, among the five SIMLESA technologies, Maize bean intercropping, Minimum tillage, Hawassa dume, BH-543 and Maize bean rotation ranked from first to least as the most liked technologies respectively. The finding of this research revealed that the stakeholders should design the possible way of expanding the best bet technologies the adjacent farming systems and able to validate and refine the technologies and the extension system to come up with wider impact in order to play a critical role in agricultural development.
Summary
Source-checkedPlain-language reading of the full paper, prepared with AI and checked against the text. Each point links to the authors' own words.
Why it matters
- Agriculture is the primary economic driver and the main source of livelihood for most people in Ethiopia. View evidence ↗
- The decline of soil fertility is a primary obstacle to food security and agricultural productivity within Ethiopian farming systems. View evidence ↗
- Sustainable intensification, specifically maize and legume intercropping combined with conservation agriculture, is proposed to solve soil moisture and fertility issues. View evidence ↗
The question
- The study aims to monitor the adoption status of SIMLESA technologies among users in intervention areas to validate the inventions and improve dissemination. View evidence ↗
What they did
- The survey was conducted in 2014 across three woredas (Meskan, Hawassa Zuria, and East Badwacho) in the Southern Nations, Nationalities, and Peoples' Regional State of Ethiopia. View evidence ↗
- The study monitored five specific SIMLESA technologies: maize bean intercropping, maize bean rotation, minimum/zero tillage, BH-543 maize, and Hawassa Dume bean. View evidence ↗
- Data were collected via structured, pre-tested questionnaires and analyzed using a statistical package. View evidence ↗
What they found
- Awareness of maize bean intercropping was high, with 94% (141 households) of respondents being aware of the technology. View evidence ↗
- Maize bean intercropping resulted in an average yield increase of 52.31%. View evidence ↗
- The use of minimum/zero tillage technology led to an average yield increment of 58.08%. View evidence ↗
- The Hawassa Dume bean technology produced an average yield change of 55.49%. View evidence ↗
- The BH-543 maize variety resulted in an average yield change of 54.36%. View evidence ↗
- Maize bean intercropping was the most liked technology, while maize bean rotation was the least liked among the five SIMLESA options. View evidence ↗
- While many farmers adopted maize bean rotation, the number of practitioners decreased in 2013 compared to previous years. View evidence ↗
What it means
- The authors conclude that the SIMLESA technologies were successful in enhancing sustainable productivity and conserving the environment in the intervention areas. View evidence ↗
- The authors recommend enhancing the seed supply systems specifically for the BH-543 and Hawassa Dume varieties. View evidence ↗
Visual summary
1 visualsIllustrations explain the paper; they do not show study data.
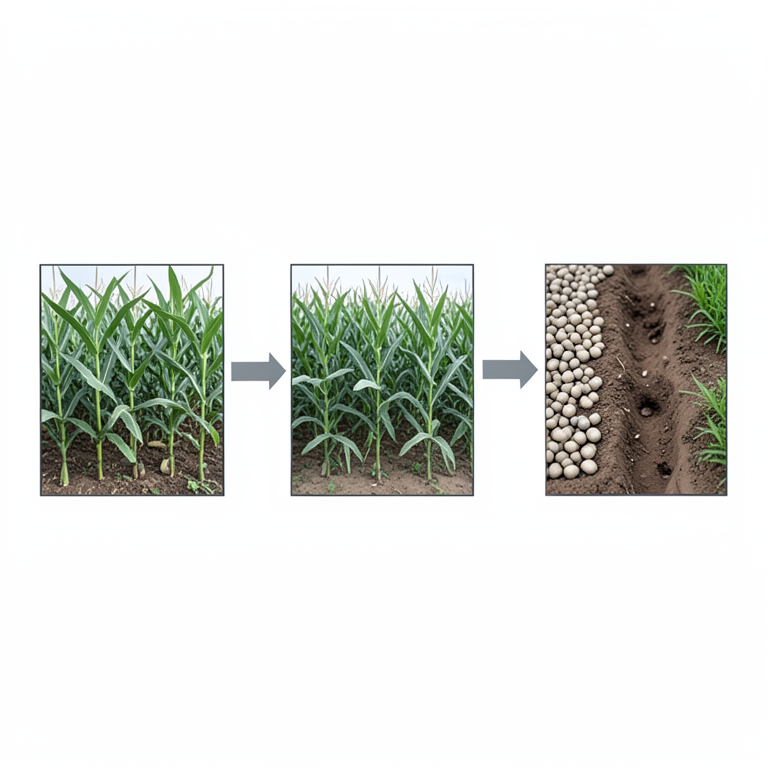
SIMLESA Technology Hierarchy
AI-generated conceptual illustration (Maize and bean crops in southern Ethiopian farmland). It explains the idea and does not show study data.
View source evidence ↗Figures & tables
From the original paper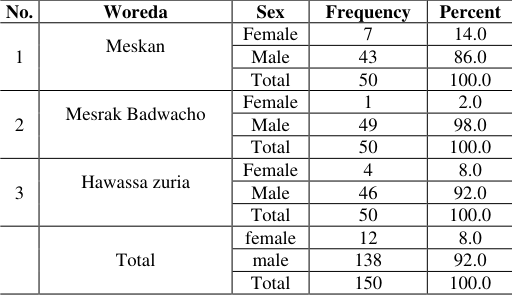 Table 1
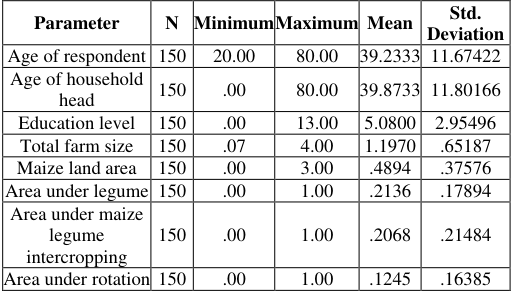 Table 2
 Table 3
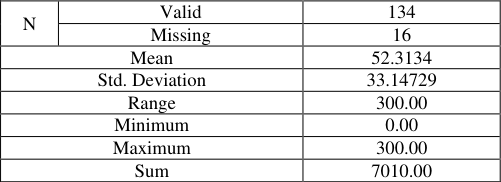 Table 5
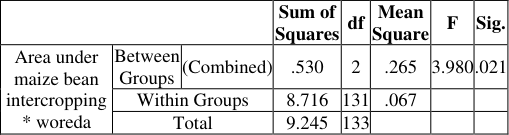 Table 4
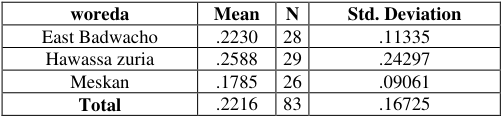 Table 6
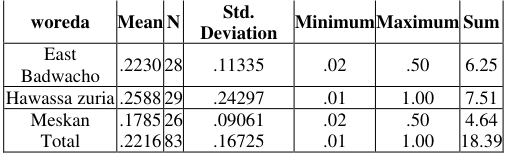 Table 9
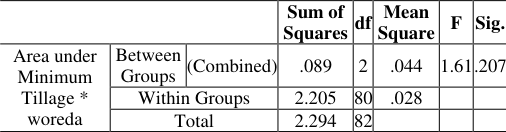 Table 10
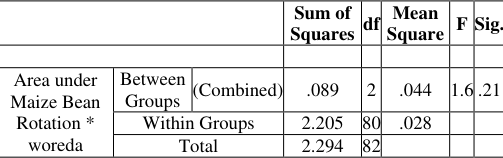 Table 7
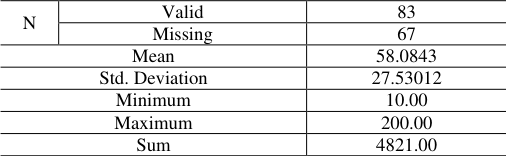 Table 11
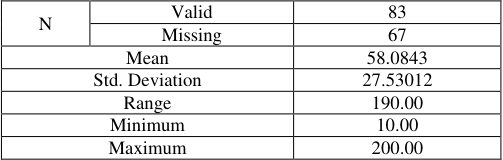 Table 8
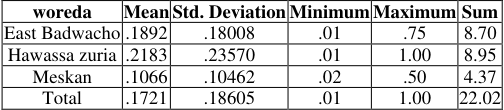 Table 12
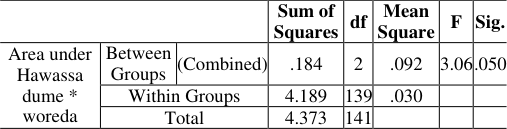 Table 16
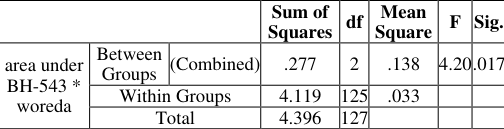 Table 13
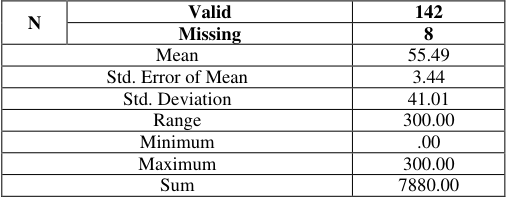 Table 17
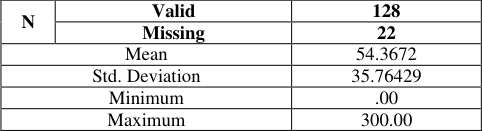 Table 14
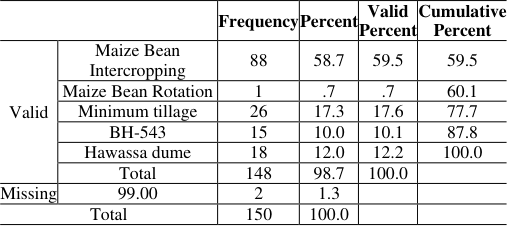 Table 18
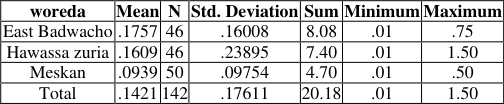 Table 15
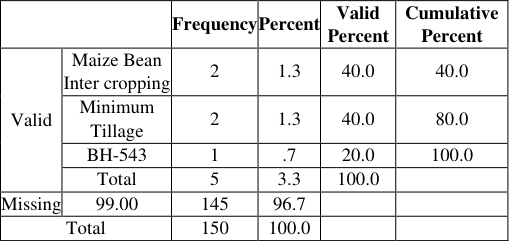 Table 19
Introduction
Soil is one of the important resources. Healthy soil is key component to the efficient utilization of soil nutrients in the production of food in sustainable manner. Soil properties vary within the farmland or at the landscape scale (F. Laekemariam, et al., 2018 [4] and B. Iticha and C. Takele, 2019) [2] . The causes for spatial variation are both inherent soil-landscape and human-induced across farms differing in resources and practices (R. Panday, et al., 2019 and P. Tittonell, et al., 2013) [9,7] . Information on spatial heterogeneity of soil properties within farmland/landscape scale is crucial in determining production constraints and taking appropriate management practices (R. Panday et al., 2019) [9] . In Ethiopia, agriculture is the mainstay of the majority of the population and major driver of the national economy. Agricultural production has been highly dependent on natural resources for centuries (Amsalu et al., 2007) [1] . However, increased human population and other factors have degraded the natural resources in the country thus seriously threatening sustainable agriculture and food security (Tsegaye et al., 2010 and Zeleke et al., 2000) [12,14] . Moreover, decline in soil fertility is the major constraint to agricultural production and food security in Ethiopian farming systems. Farmers have very limited capacity to invest in fertilizers or soil conservation measures. As a result, yields are low and many farmers are forced to put fallow and marginal lands into production to meet their food needs (Tilahun, 2004) [10] . Consequently, in order to reverse soil fertility problem, integrated soil fertility management (ISFM) is taken as a key approach to solve the soil fertility problem. But to make a best out of ISFM approach, there is need to include improved germplasm and adapt the system to local condition Accordingly, ISMF is defined as "Soil fertility management practice which necessarily include the use of fertilizer, organic input and improved germplasm, combined with knowledge on how to adapt these practices to local conditions, aiming at maximizing agronomic use efficiency of applied nutrients and improving crop productivity" (Vanlauwe, 2010) [13] . In an effort to curb soil erosion and nutrient depletion, government of Ethiopia (GoE) in collaboration with local community and several donors have been implemented large national soil and water conservation (SWC) program since the 1970s (MOARD 2005) [5] . Moreover, in southern Ethiopia, various attempts have been made for about four decades to restore the fertility of degraded arable lands since the early 1970s. The aim of these efforts was to improve the crop and livestock productivity and to increase the production of raw materials www.extensionjournal.com for domestic use and for export. Greater emphasis was given to the promotion the use of modern inputs such as improved seeds and mineral fertilizer. Facilitating the provision of fertilizer and promoting soil fertility replenishing technologies received continuous attention in all past extension programs. Soil fertility is declining most rapidly and resulted in low crop yields and livestock numbers that led to reduced food security and increased poverty in the highlands of Southern Ethiopia, which are characterized by high population, high rainfall and sloppy lands (Tilahun Amede et al., 2006) [11] . To address low soil fertility and soil moisture retention problems, maize and legume intercropping under conservation agricultural practices (i.e. minimum soil disturbance, crop rotation and crop residue retention) has been proposed as a sustainable intensification of food crop production which aims to increase resilience of maize-based farming systems to progressive climate change. The "Sustainable Intensification of maize-legume Farming Systems for Food Security in Eastern and Southern Africa (SIMLESA)" is an example of the pioneer effort led by The International Maize and Wheat Improvement Center (CIMMYT) and its partners in Eastern and Southern Africa with support from the Australian Centre for International Agricultural Research (ACIAR). The project is currently ongoing in Kenya, Tanzania, Ethiopia, Malawi and Mozambique and targeting maize and five main legumes grown in the region (Beans, Pigeon pea, Groundnut, Cowpea and Soybean). In doing so, Sustainable Intensification of Maize Legume Cropping System in Eastern and South Africa (SIMLESA) project is working in the rift valley farming system of Ethiopia. The Hawassa researchers team have been tried to induce and work for the wider coverage of SIMLESA project research technologies in to the project intervention areas of Hawassa Zuria, Meskan and East Badwacho Woredas of Southern Nations nationalities and People's Regional State as of the inception workshop which has been held at Addis Ababa in 2010 by devising innovation plat forms in different hierarchical stages. Therefore, it is important to study the status of SIMLESA technologies which was tested and takeover by the respective users in the intervention areas in order to enhance and validate the inventions and dissemination path ways.
Objectives
To monitor the adoption of SIMLESA technologies by the respective users. To identify the challenges faced in disseminating the agriculture technologies and To forward the possible recommendations that enhances the wider coverage of the proven technologies.
Methodology 3.1 Study area, Sampling Technique and Size
This survey was conducted in three woredas of Sidama, Hadiya and Gurage zones of Southern Nation Nationalities and Peoples Regional State namely Meskan, Hawassa Zuria and East Badwacho in 2014, which was being working as the project intervention areas. Fifty households were selected from each district from the sampling frame which was listed out prior to the commencement of the survey by random sampling technique. Thus the study sample composed of total 150 households.
Data Type and Analysis
This study was conducted based on primary data. The primary data which was directly obtained through a well structured and pre-tested questionnaires from the households of the study area. Thereafter, data were analyzed, tabulated and interpreted in the light of objective of the study using appropriate statistical package. A result from table two indicates that the age distribution of the respondents ranges between 20 and 80 years. The average age of the respondents was about 39 years with standard deviation of 11.67. They had an average educational level of 5.08 years with standard deviation of 2.95. The minimum education level is zero and the maximum being 13 years. Hence, the respondents of the study area are in a position of average age and education which helps to enhance the technology intake with good farming experience and able to use and understand different methods of technology transfer. As it is depicted in the above table two, the average total land holding of the study area was 1.2 hectare. From the total land holding of the area on the average .48 hectare, 0.21 hectare 0.21 hectare, and 0.012 hectare was a allocated for sole maize, sole legume, maize legume intercropping and for rotation production in 2013 production year. This shows that more land was allotted for sole maize production and the least for the rotation of maize and legume crops.
Results and Discussion
Results and Discussion
SIMLESA Technologies Awareness, Adoption and Dis-adoption Technology Awareness
According to this study, 145 farmers which account 96.7% were aware of activities conducted by SIMLESA project in their village. Based on their reply, 13 farmers were participating as a host farmer for testing and demonstration of the technologies. Also 55.3% of the respondents were member of the innovation platform for the expansion of targeted technologies. The study also revealed that 88.7%, 81.3% and 54% of the respondents were visited demonstrations, attended in field days and participated in exchange visits respectively. This shows that the respondents incorporated in this study had a close contact and knowledge of the project in each intervention areas.
Technologies awareness and adoption
SIMLESA project induced and working for the expansion of compatible technologies for wider coverage and intensity in the three distinct woredas located in southern region of Ethiopia. The technologies are namely maize bean intercropping, maize bean rotation, minimum/ zero tillage, BH-543 (Maize) and Hawassa Dume (bean) with their full packages.
Maize Bean Intercropping
From the interviewed households 141 (94%) of the respondents were aware of maize bean inter cropping. The source of information for technology awareness were accounts 70%, 14.7%, and 10% from SIMLESA demonstration/ host farmer, innovation platform and other fellow farmers respectively. From these households 22.7%, 20%, 10%, and 37.3% have been tried the technology for the first time in 2010, 2011, 2012 and 2013 year in that order. Out of these, 134 (89.3%) were still using the maize bean intercropping technology in their crop production system. However, farmers who were aware and stopped using was due to maize production decreases taken as a main reason, which accounts 1 (.7%). Moreover, the farmers who were aware and never used the technology was due to lack of cash and lack of seed as a main reason, which accounts 2.7% and 0.7 % respectively. This indicates that majority of the farmers who are aware of maize bean intercropping were adopted the technology and in 2013 the number of farmers practicing the technology were increased apart from the previous years. Based on table 4 above, the average area allocated for maize bean intercropping was 0.29 hectare, 0.34 hectare and 0.17 hectare in East badwacho, Hawassa zuria and Meskan Woreda respectively. From this it is clear that East Badwacho and Hawassa Zuria Woreda's allocated land ahead of the average. However, Meskan Woreda land allocated for the technology was beneath the total average of the three project intervention areas. The ANOVA result in table 5 shows that there is a significant difference in area allocation of land for maize bean intercropping at 5% significance level. As table 6 depicted below, the minimum and maximum yield increment due to the technology intervention was 0% and 300% respectively. However, the average yield change by using maize bean intercropping was 52.31% which asserts that the technology has a positive impact in yield increment, food security and income generation as well.
| woreda | Mean | N | Std. Deviation |
|---|---|---|---|
| East Badwacho | .2230 | 28 | .11335 |
| Hawassa zuria | .2588 | 29 | .24297 |
| Meskan | .1785 | 26 | .09061 |
| Total | .2216 | 83 | .16725 |
Table text extracted from the original PDF; superscript letters are shown inline. The original table image is below.
View original table image
| — | — | — | Sum of Squares | df | Mean Square | F | Sig. |
|---|---|---|---|---|---|---|---|
| Area under maize bean intercropping * woreda | Between Groups | (Combined) | .530 | 2 | .265 | 3.980 | .021 |
| Within Groups | 8.716 | 131 | .067 | ||||
| Total | 9.245 | 133 |
Table text extracted from the original PDF; superscript letters are shown inline. The original table image is below.
View original table image
| N | Valid | 134 |
|---|---|---|
| Missing | 16 | |
| Mean | 52.3134 | |
| Std. Deviation | 33.14729 | |
| Range | 300.00 | |
| Minimum | 0.00 | |
| Maximum | 300.00 | |
| Sum | 7010.00 |
Table text extracted from the original PDF; superscript letters are shown inline. The original table image is below.
View original table image
Maize Bean Rotation
Based on the interviewed households of this study, 63.3% of the respondents were aware of maize bean inter cropping. The source of information for technology awareness were accounts 44%, 12%, and 6% from SIMLESA demonstration/ host farmer, innovation platform and other fellow farmers respectively. From these households 24%, 16%, 4%, and 11.3% have been tried the technology for the first time in 2010, 2011, 2012 and 2013 year respectively. Out of these, 55.3% were still using the technology in their crop production scheme. However, that who were aware and stopped using was as due to maize production decreases as a main reason, which accounts 1 (.7%). Moreover, those www.extensionjournal.com farmers aware and never used the technology was due to lack of cash and lack of seed as a main reason, which accounts 4.7% and 3.3% respectively. This shows that most of the farmers who were aware of maize bean rotation were adopted the technology and in 2013 the number of farmers practicing the technology were decreased as compared to the previous years. Based on table 7 above, the average area allocated for maize bean rotation was 0.29 hectare, 0.34hectare and 0.17 hectare in East badwacho, Hawassa zuria and Meskan Woredas respectively. Hence, East Badwacho and Hawassa Zuria Woreda's allocated land above the average land area. Also in Meskan Woreda the land allocated for the technology was below the total average of the three project intervention areas. Based on the ANOVA result in table 8, there is no significant difference in area allocation of land for maize bean rotation. As it is shown in table 9 below, the minimum and maximum yield increment due to the technology utilization was 10% and 200% respectively. It is also noted that the average yield increment using the technology was 58.08% and this means that the technology has encouraging reward for the technology users.
| N | Valid | 83 |
|---|---|---|
| Missing | 67 | |
| Mean | 58.0843 | |
| Std. Deviation | 27.53012 | |
| Range | 190.00 | |
| Minimum | 10.00 | |
| Maximum | 200.00 |
Table text extracted from the original PDF; superscript letters are shown inline. The original table image is below.
View original table image
| — | — | — | Sum of Squares | df | Mean Square | F | Sig. |
|---|---|---|---|---|---|---|---|
| Area under Maize Bean Rotation * woreda | Between ( Groups | Combined) | .089 | 2 | .044 | 1.6 | .21 |
| Within Groups | 2.205 | 80 | .028 | ||||
| Total | 2.294 | 82 |
Table text extracted from the original PDF; superscript letters are shown inline. The original table image is below.
View original table image
| woreda | Mean | N | Std. Deviation | Minimum | Maximum | Sum |
|---|---|---|---|---|---|---|
| East Badwacho | .2230 | 28 | .11335 | .02 | .50 | 6.25 |
| Hawassa zuria | .2588 | 29 | .24297 | .01 | 1.00 | 7.51 |
| Meskan Total | .1785 .2216 | 26 83 | .09061 .16725 | .02 .01 | .50 1.00 | 4.64 18.39 |
Table text extracted from the original PDF; superscript letters are shown inline. The original table image is below.
View original table image
Minimum/ zero tillage
This study revealed that 130 (86.7%) of the respondents were aware about the minimum tillage. The source of information about the technology accounts 44.7%, 12%, and 6% from SIMLESA demonstration/ host farmers, innovation platforms and other fellow farmer respectively. The respondents accounts 24%, 16%, 4%, and 11% for the technology utilization for the first time in 2010, 2011, 2012 and 2013 year respectively. About 55.3% farmers were still using the technology in their crop production practice. However, those who were aware and stopped using was as due to maize production decreases as a main reason accounts 0.7%. Moreover, those farmers aware and never used the technology was due to lack of cash and lack of seed as a main reason accounts 4.7% and 3.3% respectively. Based on table 10 above, the average area allocated for minimum tillage was 0.22 hectare, 0.25hectare and 0.18 hectare in East badwacho, Hawassa zuria and Meskan Woreda respectively. The ANOVA result in table 11 shows that there is no significant difference in area allocation of land for minimum tillage. From table 12 depicted below, the minimum and maximum yield increment due to the technology intervention was 10% and 200% respectively. The average yield change due to maize bean intercropping was 58.08% which is a good indicator for the sustained utilization of the technology.
| woreda | Mean | Std. Deviation | Minimum | Maximum | Sum |
|---|---|---|---|---|---|
| East Badwacho | .1892 | .18008 | .01 | .75 | 8.70 |
| Hawassa zuria | .2183 | .23570 | .01 | 1.00 | 8.95 |
| Meskan | .1066 | .10462 | .02 | .50 | 4.37 |
| Total | .1721 | .18605 | .01 | 1.00 | 22.02 |
Table text extracted from the original PDF; superscript letters are shown inline. The original table image is below.
View original table image
| N | Valid | 83 |
|---|---|---|
| Missing | 67 | |
| Mean | 58.0843 | |
| Std. Deviation | 27.53012 | |
| Minimum | 10.00 | |
| Maximum | 200.00 | |
| Sum | 4821.00 |
Table text extracted from the original PDF; superscript letters are shown inline. The original table image is below.
View original table image
| — | — | — | Sum of Squares | df | Mean Square | F | Sig. |
|---|---|---|---|---|---|---|---|
| Area under Minimum Tillage * woreda | Between Groups | (Combined) | .089 | 2 | .044 | 1.61 | .207 |
| Within Groups | 2.205 | 80 | .028 | ||||
| Total | 2.294 | 82 |
Table text extracted from the original PDF; superscript letters are shown inline. The original table image is below.
View original table image
Mize (Bh-543)
Among the interviewed households of the study, 136 (90.7%) of the respondents were aware of BH_543. Their source of information for technology accounts 62.7%, 15.3%, and 10% from SIMLESA demonstration/ host farmer, innovation platform and other fellow farmer respectively. 23.3%, 20%, 7.3%, and 36% of the respondents have been tried the technology for the first time in 2010, 2011, 2012 and 2013 year respectively. 85.3% of the respondents were still using the technology in maize production. Furthermore, the farmers aware and never used the technology due to lack of cash and seed as a main reason accounts 3.3% and 0.7% respectively. www.extensionjournal.com According to table 13 above, the average the land allocated for BH-543 production was 0.19 hectare, 0.21hectare and 0.10 hectare in East badwacho, Hawassa zuria and Meskan Woreda respectively. Meskan Woreda land allocated for the technology was lower as compared to the total the two project intervention areas. The ANOVA result of the study in table 14 shows that there is a significant difference in area allocation of land for the technology at 5% significance level. The analysis result depicted below in table 15 shows that the minimum and maximum yield increment due to the technology intervention was 0% and 300% respectively. In the mean time, the average yield change by using BH-543 was 54.36% reveals that the technology has a good economic importance for the continuous production in the project intervention areas.
| woreda | Mean | N | Std. Deviation | Sum | Minimum | Maximum |
|---|---|---|---|---|---|---|
| East Badwacho | .1757 | 46 | .16008 | 8.08 | .01 | .75 |
| Hawassa zuria | .1609 | 46 | .23895 | 7.40 | .01 | 1.50 |
| Meskan | .0939 | 50 | .09754 | 4.70 | .01 | .50 |
| Total | .1421 | 142 | .17611 | 20.18 | .01 | 1.50 |
Table text extracted from the original PDF; superscript letters are shown inline. The original table image is below.
View original table image
| N | Valid | 128 |
|---|---|---|
| Missing | 22 | |
| Mean | 54.3672 | |
| Std. Deviation | 35.76429 | |
| Minimum | .00 | |
| Maximum | 300.00 |
Table text extracted from the original PDF; superscript letters are shown inline. The original table image is below.
View original table image
Legume (Hawassa dume)
94.7% of the respondent households were aware of Hawassa dume. Awareness created about the technology was accounts 59.3%, 22%, and 12.7 % from SIMLESA demonstration/ host farmer, innovation platform and other fellow farmer respectively. Also 22.7%, 19.3%, 8%, and 46% have been used the technology for the first time in 2010, 2011, 2012 and 2013 year respectively. It is also known that 94% of the interviewed households were still using the Hawassa dume technology in their production of legumes. This is an implication of that most of the farmers who were aware of Hawassa dume were adopted the technology. Based on table 18 below, the respondents minimum and maximum yield increment due to the technology utilization was 0% and 300% respectively. In addition, the average yield change by using the technology intervention was 55.49%. This shows that the technology had a good return for the respective users in the study area.
| — | — | Frequency | Percent | Valid Percent | Cumulative Percent |
|---|---|---|---|---|---|
| Valid | Maize Bean Intercropping | 88 | 58.7 | 59.5 | 59.5 |
| Maize Bean Rotation | 1 | .7 | .7 | 60.1 | |
| Minimum tillage | 26 | 17.3 | 17.6 | 77.7 | |
| BH-543 | 15 | 10.0 | 10.1 | 87.8 | |
| Hawassa dume | 18 | 12.0 | 12.2 | 100.0 | |
| Total | 148 | 98.7 | 100.0 | ||
| Missing | 99.00 | 2 | 1.3 | ||
| Total | 150 | 100.0 |
Table text extracted from the original PDF; superscript letters are shown inline. The original table image is below.
View original table image
Like-disliked of SIMLESA Technologies Most liked technology
According to table 19 below, among the five SIMLESA technologies, Maize bean intercropping, Minimum tillage, Hawassa dume, BH-543 and Maize bean rotation ranked from first to least respectively. 62% of the respondents is due to yield increment, 10.7%due to it lowers labour number, 5.3% of them is due to it decreases production cost and it maintains soil fertility given as the first reason. Whilst 39.3% is due to it maintains soil fertility, 16.7 due to yield increment and 5.3% due to it makes possible for double cropping. 5.3% is due to yield increment and 4% due to it maintain soil fertility depicted as a third reason.
| — | — | Frequency | Percent | Valid Percent | Cumulative Percent |
|---|---|---|---|---|---|
| Valid | Maize Bean Inter cropping | 2 | 1.3 | 40.0 | 40.0 |
| Minimum Tillage | 2 | 1.3 | 40.0 | 80.0 | |
| BH-543 | 1 | .7 | 20.0 | 100.0 | |
| Total | 5 | 3.3 | 100.0 | ||
| Missing | 99.00 | 145 | 96.7 | ||
| Total | 150 | 100.0 |
Table text extracted from the original PDF; superscript letters are shown inline. The original table image is below.
View original table image
Most Disliked SIMLESA Technology
As it is shown in table 20 above, amongst the five SIMLESA technologies maize bean intercropping, minimum tillage and BH-543 were selected by the respondents as the most dislike technologies respectively as their order of rank respectively. However, when we see the frequency count of these respondents, the data is not as such relevant and it has no significant implication to dislike the mentioned technologies.
Host Farmer's Demonstration Plot Expansion and Knowledge sharing
According to this survey all of the host farmers expand their plot for the induced five technologies beyond SIMLESSA demonstration plot. This survey also identified that all the host farmers shared their knowledge on the technology to the respective followers.
Conclusion and Recommendations
The expansion of cultivated areas to compensate for low yields, exploitation of soils without restoration of soil fertility, changing climatic patterns and the lack of welladapted technologies have been identified as some of the major problems of soil fertility management in SSA. The conservation, recapitalization and maintenance of soil fertility are therefore essential to improve efficiency of input use and increase productivity (FAO, 2001). According to Pound and Ejigu Jonfa (2005) [6] , causes of soil fertility decline are clearing of forests, removal of crop residues from the fields, land fragmentation, overgrazing, low fertilizer inputs, cultivation of slopes not suited to agriculture without adequate soil conservation, cropping of marginal lands, poor soil management, increased pressure on land due to increased population and reduced in livestock numbers (and therefore manure). Continued cultivation of crops with low levels of nutrient inputs being the major cause for the declining in soil fertility (Zingore, 2011) [15] , the washing away of the fertile top soil by water erosion is also decreasing the productivity of arable lands in the highlands. Based on this study, the technologies that have been induced in the project intervention areas intended to conserve the environment and enhance productivity sustainable was successful. It is therefore the study concluded that intensification of crop production systems using SIMLESA technologies is an important lesson in order to increase crop productivity by maintaining the moisture management system and thereby improving soil fertility status in the study area. In light of this, the following recommendations have been forwarded:- Seed supply system should be enhanced for Hawassa dume and BH-543 varieties.
Figures and tables from the paper
| No. | Woreda | Sex | Frequency | Percent |
|---|---|---|---|---|
| 1 | Meskan | Female | 7 | 14.0 |
| Male | 43 | 86.0 | ||
| Total | 50 | 100.0 | ||
| 2 | Mesrak Badwacho | Female | 1 | 2.0 |
| Male | 49 | 98.0 | ||
| Total | 50 | 100.0 | ||
| 3 | Hawassa zuria | Female | 4 | 8.0 |
| Male | 46 | 92.0 | ||
| Total | 50 | 100.0 | ||
| Total | female | 12 | 8.0 | |
| male | 138 | 92.0 | ||
| Total | 150 | 100.0 |
Table text extracted from the original PDF; superscript letters are shown inline. The original table image is below.
View original table image
| Parameter | N | Minimum | Maximum | Mean | Std. Deviation |
|---|---|---|---|---|---|
| Age of respondent | 150 | 20.00 | 80.00 | 39.2333 | 11.67422 |
| Age of household head | 150 | .00 | 80.00 | 39.8733 | 11.80166 |
| Education level | 150 | .00 | 13.00 | 5.0800 | 2.95496 |
| Total farm size | 150 | .07 | 4.00 | 1.1970 | .65187 |
| Maize land area | 150 | .00 | 3.00 | .4894 | .37576 |
| Area under legume | 150 | .00 | 1.00 | .2136 | .17894 |
| Area under maize legume intercropping | 150 | .00 | 1.00 | .2068 | .21484 |
| Area under rotation | 150 | .00 | 1.00 | .1245 | .16385 |
Table text extracted from the original PDF; superscript letters are shown inline. The original table image is below.
View original table image
| Woreda | Mean | Std. Deviation | Minimum | Maximum |
|---|---|---|---|---|
| East Badwacho | .2896 | .22892 | .01 | .75 |
| Hawassa zuria | .3248 | .34180 | .01 | 1.50 |
| Meskan | .1781 | .15819 | .02 | .50 |
| Total | .2656 | .26365 | .01 | 1.50 |
Table text extracted from the original PDF; superscript letters are shown inline. The original table image is below.
View original table image
| N | Valid | 142 |
|---|---|---|
| Missing | 8 | |
| Mean | 55.49 | |
| Std. Error of Mean | 3.44 | |
| Std. Deviation | 41.01 | |
| Range | 300.00 | |
| Minimum | .00 | |
| Maximum | 300.00 | |
| Sum | 7880.00 |
Table text extracted from the original PDF; superscript letters are shown inline. The original table image is below.
View original table image
References
12 in the original paper- Amsalu A, Stroosnijder L, Graaf G. Long-term dynamics in land resource use and the driving forces in the Beressa watershed, highlands of Ethiopia. J Environ Manage 2007;83:448-59.
- Iticha B, Takele C. Digital soil mapping for sitespecific management of soils, Geoderma. 2019;351:859.
- Food and Agriculture Organization. Soil fertility management in support of food security in Sub-Saharan Africa. Rome, Italy 2001.
- Laekemariam F, Kibret K, Mamo T, Shiferaw H. "Accounting spatial variability of soil properties and mapping fertilizer types using geo statistics in southern Ethiopia," Communications in Soil Science and Plant Analysis 2018;49(1):124-13.
- Ministry of Agriculture and Rural Development, 2005. Guide line for integrated watershed management. MoARD, Addis Ababa.
- Pound Barry, Ejigu Jonfa. "Soil Fertility Practices in Wolaita Zone, Southern Ethiopia: Learning from Farmers", Policy and Research series 2, Addis Ababa, Ethiopia 2005.
- Tittonell P, Muriuki A, Klapwijk CJ, Shepherd KD, Coe R, Vanlauwe B. Soil heterogeneity and soil fertility gradients in smallholder farms of the East African highlands, Soil Science Society of America Journal 2013;77(2):525-538.
- Pound Barry, Ejigu Jonfa. Soil Fertility Practices in Wolaita Zone 2005.
- Panday R, Babu Ojha R, Chalise D, Das S, Twanabasu B. "Spatial variability of soil properties under different land use in the Dang district of Nepal, Cogent Food & Agriculture, Article ID 1600460. 2019;5:1.
- Tilahun A. Soil fertility decision guide formulation: Assisting farmers with varying objectives to integrate legume cover crops. Addis Ababa Ethiopia: African Highlands Initiative/Tropical Soils Biology and Fertility Institute of CIAT, 2004.
- Tilahun Amede, Takele Belachew, Endrias Geta. "Reversing degradation of arable lands in Southern Ethiopia. AHI, Kampala, Uganda. AHI/African Highlands Initiative working paper no. 2006, 1.
- Tsegaye G, Bekele W. Farmers' perceptions of land degradation and determinants of food security at Bilate watershed, Southern Ethiopia. Ethio J Appl Sci Technol 2010;1:49-62.