
Research article · 2021 · Full text
International Journal of Statistics and Applied MathematicsA mathematical model for the blood flow in a modeled artery with a stenosis and an aneurysm
Volume 6(2) · Pages 65–71
Research areasCoronary Interventions and DiagnosticsCardiovascular Health and Disease PreventionCardiovascular Function and Risk Factors
Abstract
Author-writtenMathematical modeling of blood flows in the stenosed arteries is a crucial and demanding problem. The pulsatile simulations of blood flow through two three-dimensional models of an arterial stenosis and an aneurysm are investigated in this study. Power Law, Casson, Carreau and the Generalized Power Law, these four non-Newtonian blood models as well as the Newtonian model of blood viscosity are used to investigate the flow effects induced by the different blood constitutive equations. There are three main purpose of this study. First purpose is to investigate the variation in wall shear stress in a stenosed artery or aneurysm at different flow rates and degrees of severity. Second purpose is to compare and quantify the difference of the various blood models and judge their significance and lastly, to determine whether the use of the Newtonian blood model is appropriate over a wide range of shear rates.
Summary
Source-checkedPlain-language reading of the full paper, prepared with AI and checked against the text. Each point links to the authors' own words.
Why it matters
- Stenosis and aneurysms in arteries can significantly change blood flow and flow rates, which may lead to severe medical conditions. View evidence ↗
- Stenosis can result in stroke or cardiac arrest, while the dilation and potential rupture of an aneurysm can cause death or severe disability. View evidence ↗
- Vascular anomalies can create flow disturbances like vortex formation, which are linked to the development of thrombi and atherosclerosis. View evidence ↗
The question
- The study aims to investigate how wall shear stress varies in arteries with stenosis or aneurysms across different flow rates and severity levels. View evidence ↗
- The researchers seek to quantify differences between various blood rheological models and determine if the Newtonian model is suitable across various shear rates. View evidence ↗
What they did
- The study compares five blood viscosity models: the Newtonian model and four non-Newtonian models (Power Law, Casson, Carreau, and Generalized Power Law). View evidence ↗
- The simulations tested three degrees of stenosis (20%, 50%, and 80%) and three aneurysm dilation widths (0.25, 0.4, and 0.55). View evidence ↗
- The governing non-linear equations were solved numerically using the finite element method via COMSOL software. View evidence ↗
What they found
- Most non-Newtonian models produced a higher pressure difference than the Newtonian model, with the Generalized Power Law model causing the highest drop and the Power Law model causing the lowest. View evidence ↗
- Wall shear stress increases as stenosis severity increases; while most models align with the Newtonian model, the Power Law model predicts significantly lower stress at 50% stenosis. View evidence ↗
- Peak shear stress occurs just before the stenosis throat and increases with flow rate, followed by negative values that indicate backflow. View evidence ↗
- In the case of aneurysms, there is less agreement between the blood models, with only the Casson and Carreau models remaining comparable. View evidence ↗
- In stenosed arteries, maximum wall shear stress increases with the shear rate, though the Power Law model deviates significantly from other models. View evidence ↗
- For pulsatile flow in aneurysms, maximum wall shear stress occurs at mid-cycle, coinciding with the peak inflow velocity. View evidence ↗
What it means
- The authors conclude that the Newtonian model works well for mid-to-high shear regions, but the Generalized Power Law model is superior for approximating wall shear stress at low shear. View evidence ↗
- The study is limited by the assumption of rigid arterial walls and zero outlet pressure; future work should incorporate elastic walls and broader circulatory system effects. View evidence ↗
Visual summary
2 visualsIllustrations explain the paper; they do not show study data.
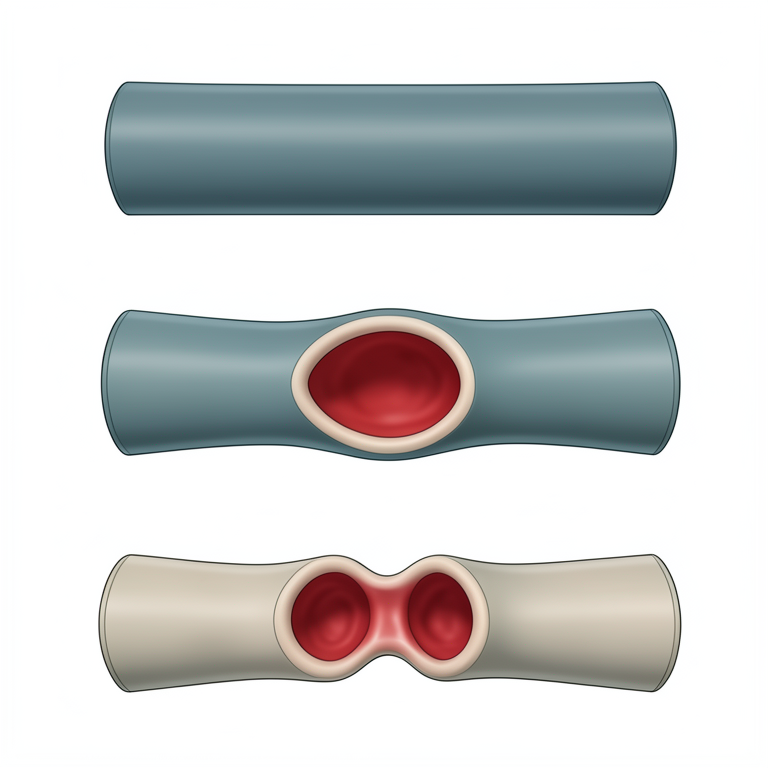
Vascular Anomalies
AI-generated conceptual illustration (human coronary artery). It explains the idea and does not show study data.
View source evidence ↗
Flow Dynamics in Stenosis
AI-generated conceptual illustration (a human coronary artery with a stenosis and an aneurysm). It explains the idea and does not show study data.
View source evidence ↗Figures & tables
From the original paper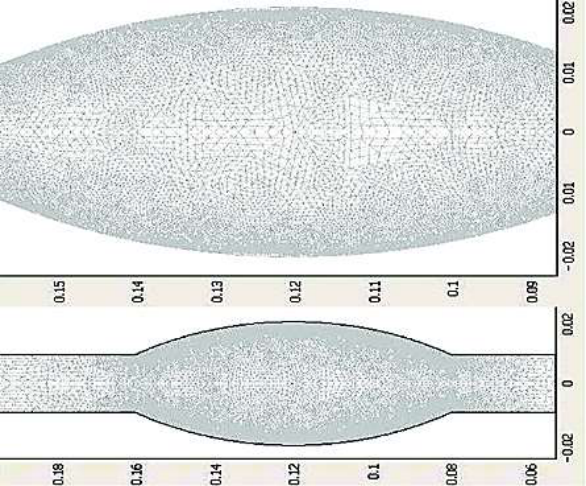 Figure 1
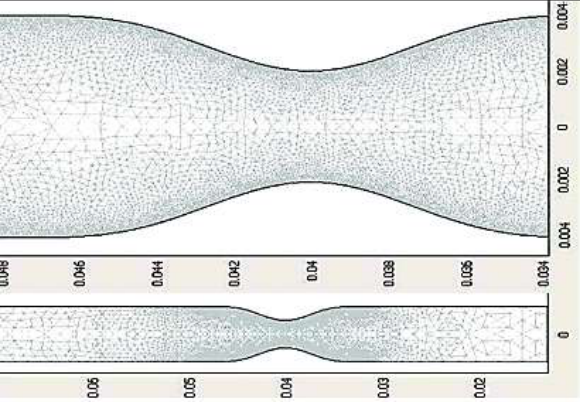 Figure 2
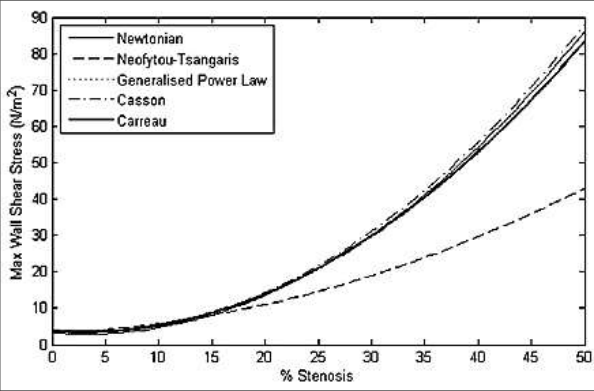 Figure 3
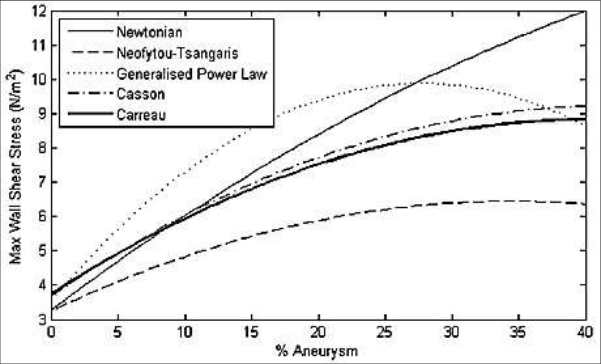 Figure 4
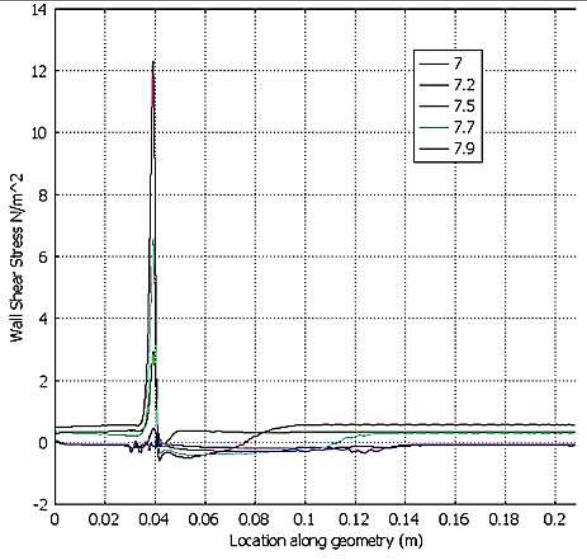 Figure 5
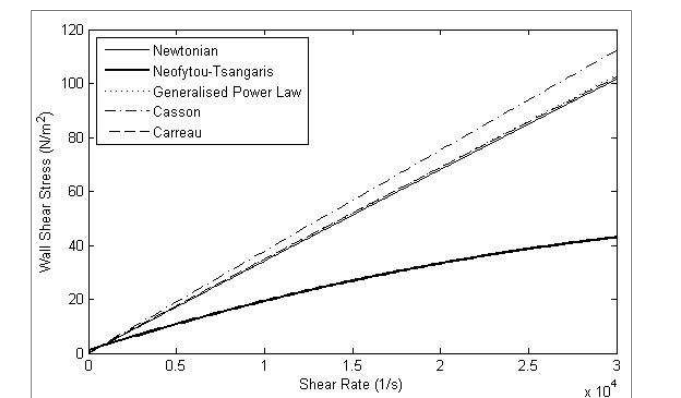 Figure 6
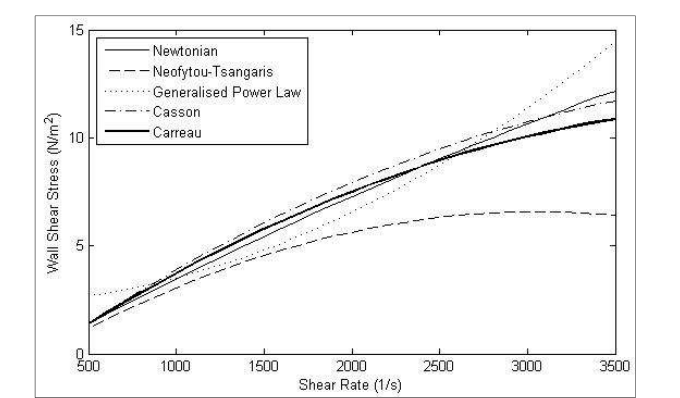 Figure 7
Introduction
The hemodynamics hypotheses of artherosclerosis were first formulated several decades ago, so flow imaging and computing have played an increasingly important role in advancing our understanding of how blood really flows in large arteries prone to atherosclerosis, while lumped parameter and linear and non-linear one-dimensional wave propagation methods received much attention in the 1950s through 1980s, Computational fluid dynamics method based on solving the three dimensional equations of blood flow have a dominant influence on recent research efforts to quantify hemodynamic conditions in arteries. The presence of a stenosis or an aneurysm in an artery may significantly alter the flow field and consequently the flow rate, leading to severe pathological incidences. In the case of a stenosis, the consequences may be cardiac arrest and stroke whereas the development of an aneurysm and its continuous dilation may lead to its rupture causing death or grave disability. Furthermore, the presence of the anomaly itself may produce flow disturbances such as vortex formation, which has been reported as a contributing factor to atherogenesis and thrombogenesis. Chaturani and Samy [1] studied a pulsatile flow of Casson fluid through stenosed arteries with application to blood flow. Chakravarty and Chowdhury [2] observed the response of blood flow through an artery under stenotic conditions. Berger and Jou [3] discussed the flows in stenotic vessels. Johnston [4] worked on non-Newtonian blood flow in human right coronary arteries: steady state Simulations. Neofytou and Tsangaris [5] discussed on the flow effects of blood constitutive equations in 3D models of vascular anomalies. Sankar and Hemalatha [6] observed a non-Newtonian fluid flow model for blood flow through a catheterized artery-steady flow. Nanda and Bose [7] worked on a mathematical model for blood flow through a narrow artery with multiple stenoses. Kumar et al. [8] discussed on a non-Newtonian arterial blood flow model through multiple stenosis. Shah [9] studied the effect of clopidogrel on blood flow through stenosed artery under diseased condition. Shah et al. [10] observed a mathematical modeling and numerical simulation of blood flow through tapered artery. Siddiqui et al. [11] investigated a mathematical modelling on blood flow through stenosed artery under the influence of magnetic field. Shrivastava et al. [12] worked on a non-Newtonian fluid flow model for the slip condition on blood flow through a stenosed artery using power-law fluid. Sriyab [13] studied on the effect of stenotic geometry and non-Newtonian property of blood flow through arterial stenosis. Kumar et al. [14] discussed on comparative study of non-Newtonian physiological blood flow through elastic stenotic artery with rigid body stenotic artery. The purpose of this study are three fold: firstly, to investigate the variation in wall shear stress in an artery with a stenosis or aneurysm at different flow rates and degrees of severity; secondly, to compare the various blood models and quantify the differences between the models and judge their significance and lastly, to determine whether the use of the Newtonian blood model is appropriate over a wide range of shear rates.
Mathematical formulation
The flow geometry comprises a tube of diameter D and can be divided into three regions, the inlet, the deformed and the outlet region. In the case of the stenosis, the lengths of these regions are 4D, 2D and 20D, respectively. For the aneurysm, there are 4D, 4D and 18D, respectively. The radius of the undeformed inlet and outlet is 𝑅 0 = 𝐷/2. In the case of the stenosis, the radius of the constricted region is given by:
Where 𝑅 𝑚𝑖𝑛 is the minimum radius at the centre of the stenosis. In this investigation, three different degrees of stenosis were used, 20%, 50% and 80%. In the case of the aneurysm, the radius of the dilated region is given by b
Where x is measured from the start of the dilated region, a is the maximum width of the dilated segment and
Three different values of a is 0.25, 0.4 and 0.55 were used in this investigation.
Analytical solution of the problem
The blood flow is assumed to be laminar and incompressible and therefore the Navier-Stokes equations for 3D incompressible flow are given by:
Where V is the 3D velocity vector, p pressure, density and the shear stress.
Five different non-Newtonian blood flow models and the simple Newtonian model are considered in this investigation. The effects of these models on the flow field and the wall shear stress in the vicinity of a stenosis or aneurysm are examined. These blood models are given below.
Power law model
Power law model
Generalized power law model
Generalized power law model
Boundary conditions
It is assumed that the arterial walls are rigid and no-slip condition is imposed at the walls. At the outlet, stress-free conditions are applied and the pressure is set to zero. Finally, the velocity profile at the inlet is regarded to be that of fully developed flow in a straight tube and can be derived analytically for both the Newtonian and the Power Law fluids. The forms are
Where u is the velocity component in the x-direction for the Newtonian flow and
For the non-Newtonian flow, in transient flow, the pulsatile flow at the inlet is given by a time varying forcing function given in (7). This forcing function was scaled to yield a maximum inflow velocity of u ̅ with a heart rate of approximately 60 beats per minute.
Solution methodology
The governing equations are highly non-linear and must be solved numerically using techniques of computational fluid dynamics. In this investigation, these equations are solved using the finite element method as implemented by COMSOL. The flow geometries for the stenosis and aneurysm were first created using Matlab. Then a finite element mesh was placed on these geometries. Briefly, an inlet plane of the artery is meshed in 2D using triangles and this mesh is extruded along the centerline of the artery to create a 3D mesh consisting of hexadrel elements. The mesh used for all computations consisted of 9, 708 elements and 15, 048 nodes for the stenosis and 17, 696 elements and 27, 132 nodes for the aneurysm as shown in Figure 1. The governing equations were solved completely using the boundary conditions for fully developed flow (10) and ( 11) at the inlet along with the pulsatile forcing function for the transient case.
Results and Discussion
Transient simulations were performed using all five models given above. Three different degrees of stenosis were used namely 20%, 50% and 80% and maximum dilated widths of 25%, 40% and 55% were examined for the aneurysm in Figure 1. Figure 2 shows that all of the non-Newtonian models considered here except the Power Law model produce a higher pressure difference than the Newtonian model. Specifically, the highest pressure drop is induced by the generalized Power Law model and the lowest by the Power Law model. Similar pattern in pressure differences are obtained at higher flow rates. The distribution of the wall shear stress is one of the most important hemodynamic parameter due to its direct relevance in arthrosclerosis formation. Figure 3 displays the distributions of maximum shear stress for various degrees of severity of the stenosis for all models. It is evident that wall shear stress increases with increasing severity. All models show close agreement with the Newtonian model except for the Power Law model. At 50% stenosis, the wall shear stress predicted by this model is significantly lower than the rest. Figure 4 explains the distribution of wall shear stress along the geometry at various times. Maximum shear stresses are reached just before the throat of the stenosis. The magnitude of this value increases with higher flow rates. This peak is followed by a negative value indicating the presence of backflow. Further downstream, the wall shear stress steadily regains its undisturbed value. The maximum wall shear stress for various degrees of dilation of an aneurysm is displayed for all models. There is less agreement between the models in this case. Only the Casson and the Carreau models are comparable throughout. The power law model gives a much lower max W value because it exhibits a lower viscosity at the throat of the stenosis where the shear stress is high. As the flow rate increases, these wall shear stress differences from various models become more prominent indicating significant differences in model behavior. Figure 5 shows that transient simulations were performed using the Generalized power law model for both the stenosis and aneurysm. Each simulation was from t = 0 to 10.0 secs, yielding a heart rate of approximately 60 beats per minute. 7 displays the maximum wall shear stress for increasing shear rate in an aneurysm. There is less agreement between the models at higher shear rates with the Power law model showing the least agreement. In the case of pulsatile flow through the aneurysm, the simulation was performed for 10 sec using the Generalized Power Law model. As in the case of the stenosis, results in Table 4 show the maximum Wall shear stress values are produced at mid-cycle corresponding to the peak inflow velocity. However, the maximum pressure is attained just before mid-cycle and the minimum pressure towards the end of the cycle. This maximum pressure is excessively high. It is not clear why this is so and further investigation is planned. The streamline patterns at various points of the cardiac cycle are shown in figure 5. The formation and re-formation of the recirculation regions corresponding to the oscillatory nature of the pulsatile flow is evident. The wall shear stress distribution in pulsatile flow shown in figure 6 display a similar pattern in mid-cycle as in the steady state case. The distribution at other times show some marked differences due to the development of backflow regions inside the aneurysm. In all cases, for both the stenosis and the aneurysm, the flow field and the Wall shear stress changed significantly as the degree of abnormality increased. The recirculation regions become larger progressively and the wall shear stress generally increases, especially for the stenosis.
Conclusions
The effects of modeling blood flow through a stenosis and an aneurysm using five different blood rheological models is presented in this investigation. The flow field and wall shear stress distributions produced by each model are investigated for various flow rates and degrees of abnormality. The results show that there are significant differences between simulating blood as a Newtonian or non-Newtonian fluid. It is found that the Newtonian model is a good approximation in regions of mid-range to high shear but the Generalized power law model provides a better approximation of wall shear stress at low shear. These conclusions are presented under the assumption that the arterial walls are rigid and zero pressure is assumed at the outlet. A more realistic simulation would include elastic walls and incorporate the effects of upstream and downstream parts of the circulatory system into the boundary conditions. This is a long term objective of this study.
Figures and tables from the paper
References
14 in the original paper- Chaturani P, Samy RP. Pulsatile flow of Casson fluid through stenosed arteries with application to blood flow, Biorheology 1986;23:499-511.
- Chakravarty S, Chowdhury AG. Response of blood flow through an artery under stenotic conditions, Rheologica Acta 1988;27:418-427.
- Berger SA, Jou LD. Flows in stenotic vessels, Annual Reviews of Fluid Mechanics" 2000;32:347-382.
- Johnston BM. Non-newtonian blood flow in human right coronary arteries: steady state Simulations, J Biomechanics 2004;37:709-720.
- Neofytou P, Tsangaris S. Flow effects of blood constitutive equations in 3D models of vascular anomalies, Int. J Numer. Meth. Fluids 2005;51:489-510.
- Sankar DS, Hemalatha K. A non-Newtonian fluid flow model for blood flow through a catheterized artery-steady flow, Applied Mathematical Modeling 2007;31(9):1847-1864.
- Nanda S, Bose RK. A mathematical model for blood flow through a narrow artery with multiple stenoses, Journal of Applied Mathematics and Fluid Mechanics 2012;4(3):233-242.
- Kumar H, Chandel RS, Kumar S, Kumar S. A non-Newtonian arterial blood flow model through multiple stenosis, International Journal of Latest Research in Science and Technology 2014;3(3):116-121.
- Shah SR. Effect of clopidogrel on blood flow through stenosed artery under diseased condition, International journal of Pharmacy Teaching & Practices 2015;5(1):887-893.
- Shah SR, Siddiqui SU, Singh A. Mathematical modeling and numerical simulation of blood flow through tapered artery, International Journal of Innovative Science, Engineering & Technology 2016;3(2):710-717.
- Siddiqui SU, Awasthi C, Geeta. Mathematical modelling on blood flow through stenosed artery under the influence of magnetic field, International Journal of Mathematics Trends and Technology 2017;49(4):236-242.
- Shrivastava R, Chandel RS, Kumar A, Shrivastava K, Kumar S. A non-Newtonian fluid flow model for the slip condition on blood flow through a stenosed artery using power-law fluid, Journal of Computer and Mathematical Science-An International Research Journal 2018;9(7):871-879.
- Sriyab S. The effect of stenotic geometry and non-Newtonian property of blood flow through arterial stenosis, Cardiovascular & Hematological Disorders-Drug Targets 2020;20:16-30.
- Kumar S, Kumar S, Kumar D. Comparative study of non-Newtonian physiological blood flow through elastic stenotic artery with rigid body stenotic artery, Series on Biomechanics 2020;34(4):26-41.
Cited by 4
From OpenAlex, OpenCitations and reference lists read by Scinovex
- MHD flow of the novel quadruple hybrid nanofluid model in a stenosis artery with porous walls and thermal radiation: A Sisko model‐based analysis ↗
Mohamed Omama, Ayman A. Arafa, A. Elsaid, Waheed K. Zahra · ZAMM ‐ Journal of Applied Mathematics and Mechanics / Zeitschrift für Angewandte Mathematik und Mechanik · 2024
Abstract This study introduces a mathematical model that describes the Magnetohydrodynamics (MHD) flow of blood in a porous stenosis artery, incorporating a new hybrid nanofluid (HNF) model known as ‘Quadruple’ or the tetra‐(HNF) model. An innovative aspect of this study lies in the unexplored combination of tetra‐hybrid nanoparticles with the Sisko rheological model. The conventional Tiwari and Das (HNF) model…
❝ 17 - Analyzing heat transfer and entropy generation in catheterized, stenosed arteries ↗
Arshad Riaz, Muhammad Nadeem, Leonardo P. Chamorro, Taseer Muhammad, Tayyab Nawaz, Sami Ullah Khan · International Communications in Heat and Mass Transfer · 2024
❝ 11 - Computational study of MHD Sisko fluids with tetrahybrid nanoparticles in stenosed arteries: applications of medical engineering by machine learning ↗
Fatima Shafiq Hira, Qammar Rubbab, Irshad Ahmad, Afraz Hussain Majeed, Hamiden Abd El‐Wahed Khalifa · Journal of Thermal Analysis and Calorimetry · 2025
❝ 2 - Wave number and magnetic field effects on the boundary layer flow over an accelerating vertical surface with zero-time periodic boundaries ↗
WIA Okuyade, CO Aminobiren, TM Abbey · International Journal of Physics and Applications · 2023
The problem of the wave number and magnetic field effects on a boundary layer flow over an accelerating vertical surface in the presence of heat generation and reacting species, and zero-time periodic boundaries is examined. We assumed the fluid is Newtonian, chemically reactive and of order one, and magnetically susceptible. The governing non-linear partial differential equations of the Bousinesq form