
Research article · 2020 · Full text
International Journal of Veterinary Sciences and Animal HusbandryA comparative study on muscle and leg properties of male and female stick insects and their impact on the insects behaviour
Volume 5(1) · Pages 72–82
Research areasInsect and Arachnid Ecology and BehaviorEntomopathogenic Microorganisms in Pest ControlInsect-Plant Interactions and Control
Abstract
Author-writtenThe physiological, mechanical and morphological properties of the specialized metathoracic leg and flexor muscle of the male and those homologous but unspecialized ones of the female stick insects, Eurycantha calcarata were examined, to find the correlation between the properties of the muscles and legs with the animal behavior. The intact insects, isotonic and isometric transducer, pen recorder and oscilloscope were used. The initial contraction of the muscle was a rapid contraction with the duration of 70 to 130 msec. Its delayed contraction was much longer remaining in contraction, more than 30 sec. The muscle of the male was much more developed, faster, produced more force and did more initial and delayed work than the muscle of the female. Also the produced power output and work output by the muscle of the male were higher than those of the female, due to its greater size. The muscle produced the highest tension at the femur-tibia joint angle of 1.22 rad. The muscles, as compared with other insect muscles, produced relatively high power and were considered to be relatively fast.
Summary
Source-checkedPlain-language reading of the full paper, prepared with AI and checked against the text. Each point links to the authors' own words.
Why it matters
- In male Eurycantha stick insects, the metathoracic legs are specialized for defensive counter-attacks against predators. View evidence ↗
- Female stick insects have thinner metathoracic legs with less developed spines, resulting in weaker grasping movements compared to males. View evidence ↗
The question
- The study aimed to compare the physiological and mechanical properties of the metathoracic flexor tibialis muscle and legs between adult male and female E. calcarata to understand their role in defensive behavior. View evidence ↗
What they did
- The experiment used 10 adult E. calcarata (5 males and 5 females), with males averaging 11.17±0.2 cm and 14.42±0.32 g, and females averaging 13.2±0.31 cm and 23.71±0.42 g. View evidence ↗
- To elicit maximal responses without injuring the animals, the insects were stimulated with single 50 V pulses. View evidence ↗
- Isometric tension was measured using a Washington pen recorder and an isometric transducer at femur-tibia joint angles from full extension to full flexion in 0.175 rad intervals. View evidence ↗
What they found
- The male flexor tibialis muscle is larger than the female's, weighing 0.47±0.02 g with a cross-sectional area of 1.81±0.07 cm², compared to 0.25±0.02 g and 1.07±0.08 cm² in females. View evidence ↗
- The muscle of the male exhibited significantly higher contraction velocity (P < 0.01) and sustained much higher force than the muscle of the female. View evidence ↗
- The absolute maximum force sustained by any male muscle was 19.18 N, while the maximum for any female muscle was 13.70 N. View evidence ↗
- Peak initial contraction work was significantly higher in males (6.78±0.87 mJ at 9.59 N) than in females (3.76±0.55 mJ at 4.11 N). View evidence ↗
- Delayed contraction work peaked at 18.70±6.61 mJ for males (at 16.44 N) and 7.16±4.55 mJ for females (at 8.22 N). View evidence ↗
- The peak force produced during initial contraction was 152.42±35.06 mN for males (at 16.44 N) and 30.11±13.39 mN for females (at 5.48 N). View evidence ↗
- The highest isometric tension in the male muscle occurred at a femur-tibia joint angle of 1.22 rad, which is near the normal standing position. View evidence ↗
- During a defensive strike, the tibial angular velocity ranged from a minimum of 9.35±0.43 rad/s at 1.4 rad to a maximum of 175±5.55 rad/s near full flexion. View evidence ↗
What it means
- The authors conclude that the superior speed and force of the male's muscle are adaptations that allow them to better catch and inflict damage on predators, reflecting different behavioral roles between sexes. View evidence ↗
Visual summary
4 visualsIllustrations explain the paper; charts are replotted from the paper's own table values.
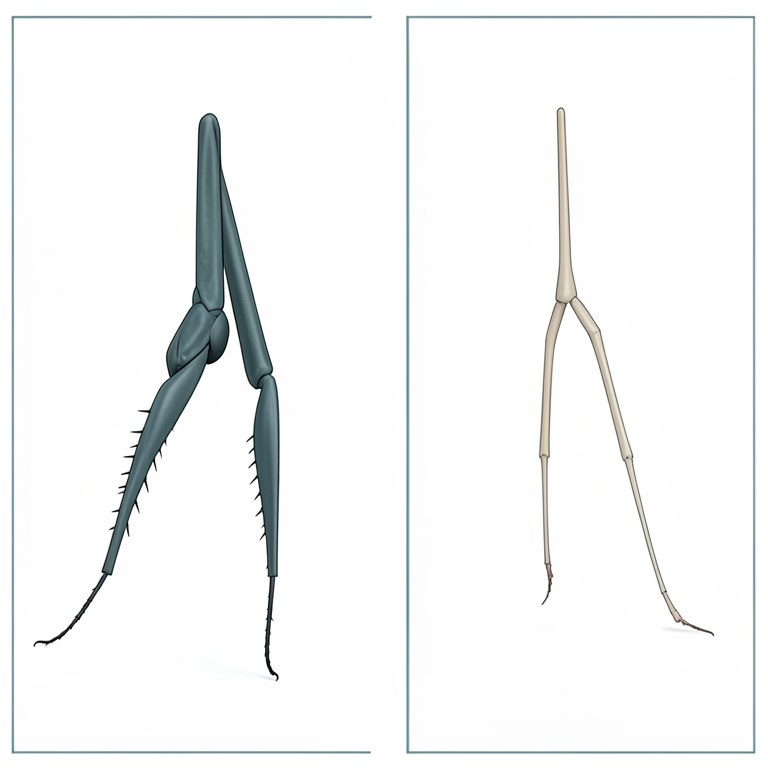
Morphological Comparison
AI-generated conceptual illustration (male and female stick insects (Phasmatodea)). It explains the idea and does not show study data.
View source evidence ↗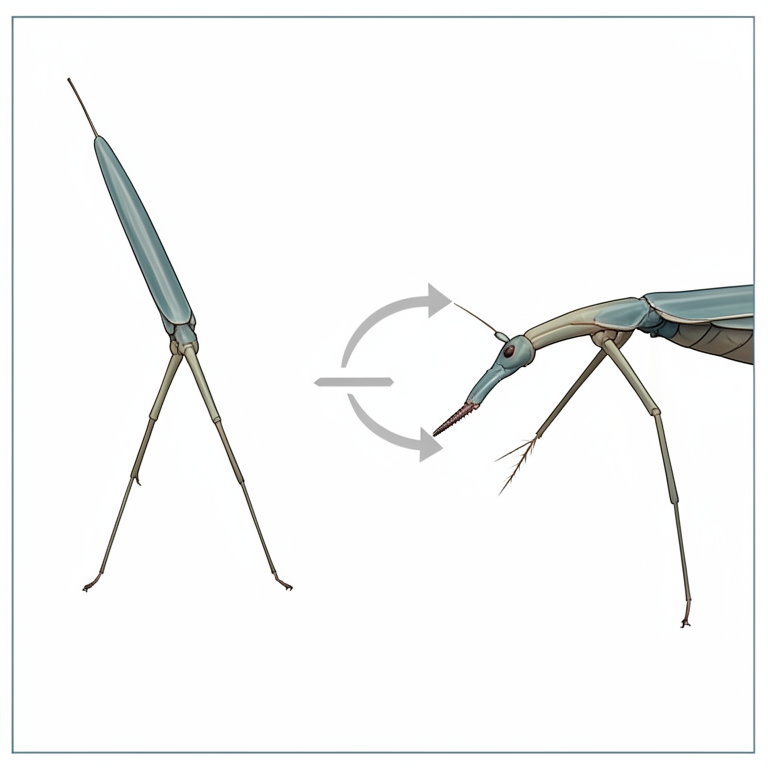
Defensive Strike Mechanism
AI-generated conceptual illustration (male and female stick insects). It explains the idea and does not show study data.
View source evidence ↗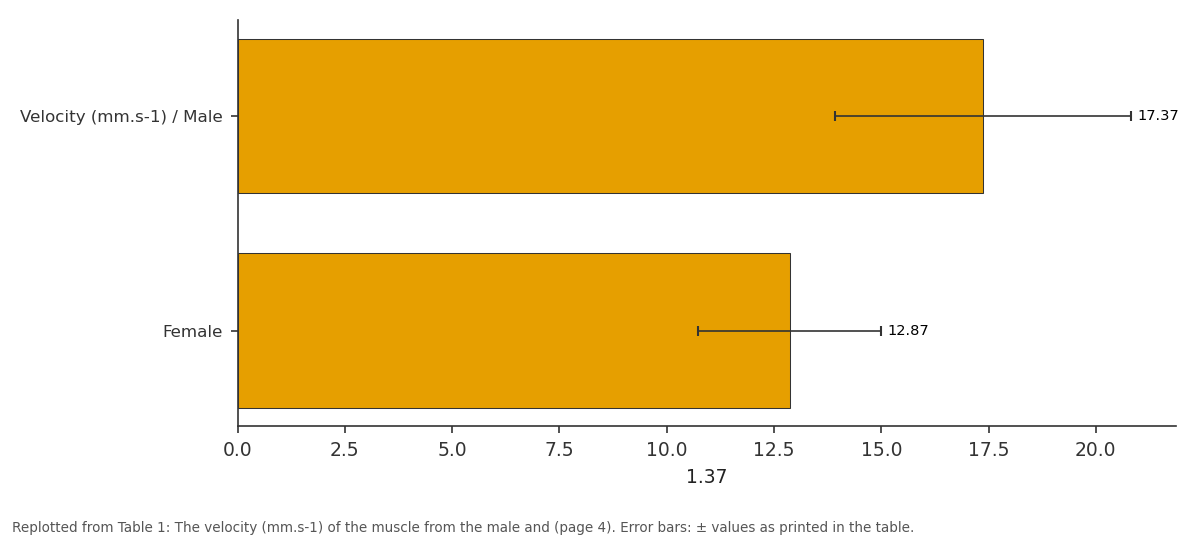
1.37: Velocity (mm.s-1) / Male vs Female
Replotted from Table 1 (page 4) of the original paper. Every bar is the paper's own table value.
View source evidence ↗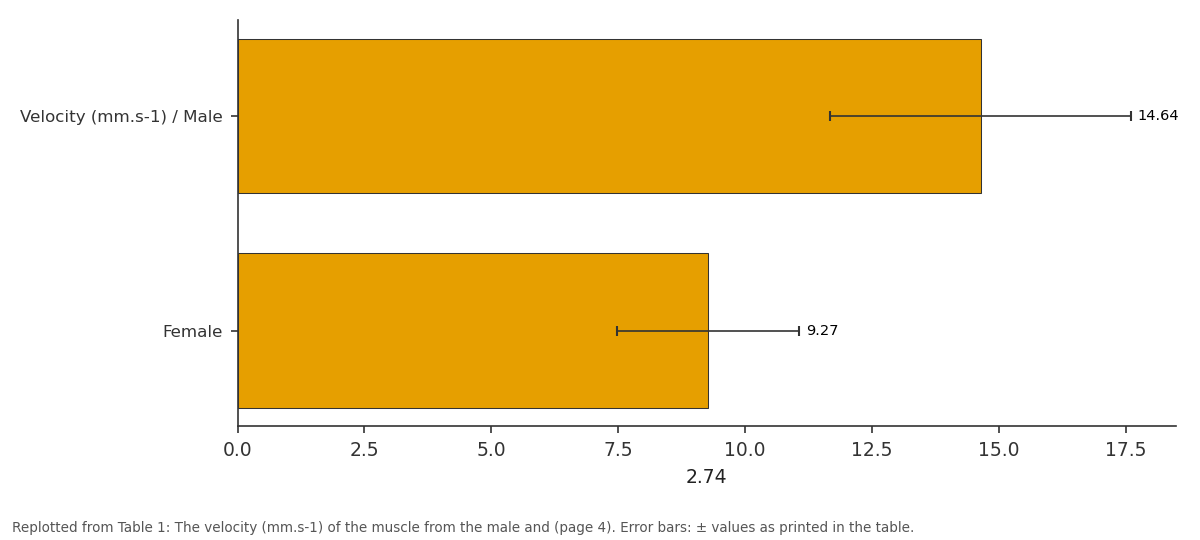
2.74: Velocity (mm.s-1) / Male vs Female
Replotted from Table 1 (page 4) of the original paper. Every bar is the paper's own table value.
View source evidence ↗Figures & tables
From the original paper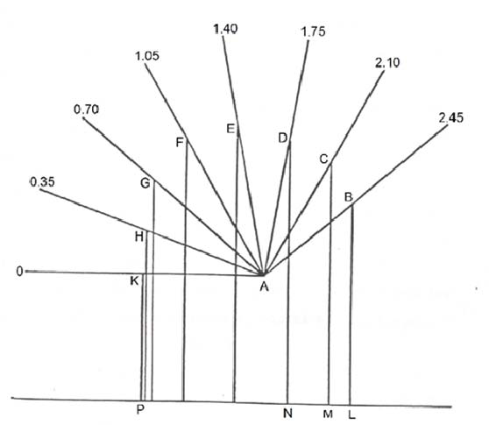 Figure 1
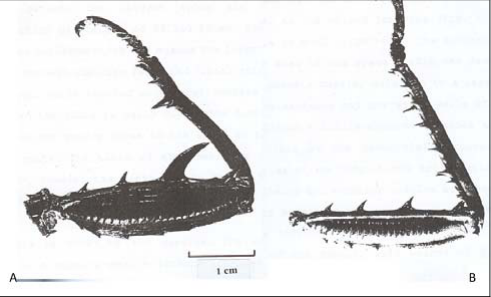 Figure 2
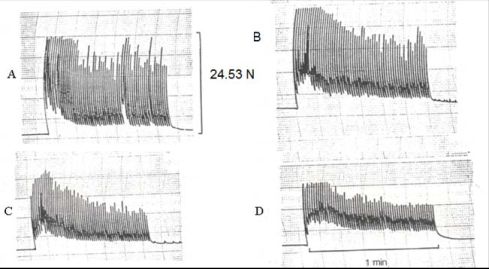 Figure 3
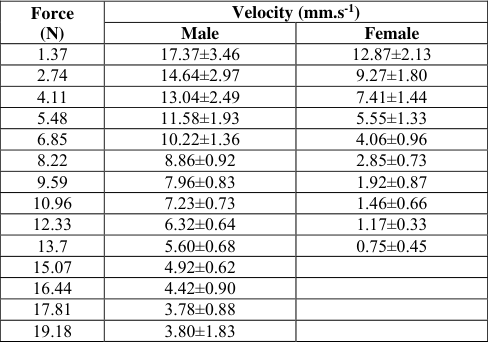 Table 1
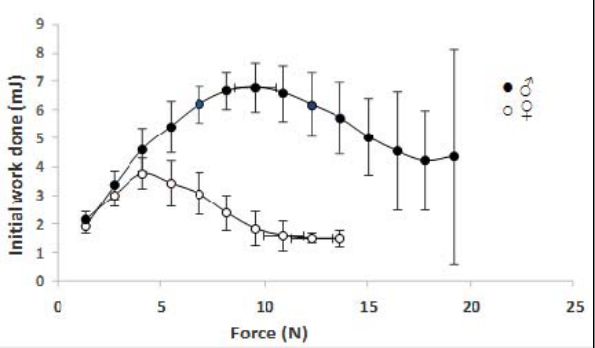 Figure 5
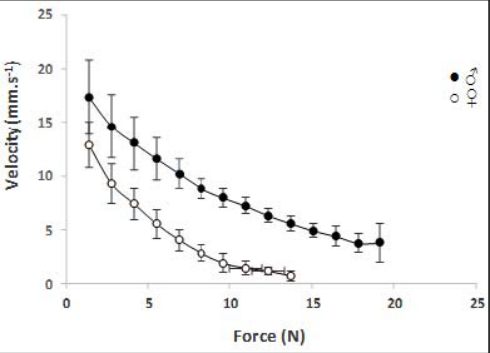 Figure 4
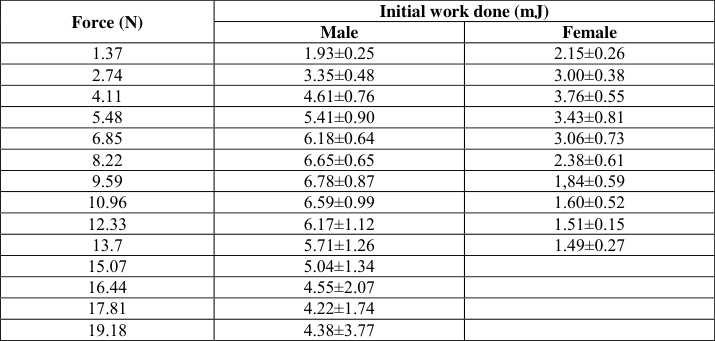 Table 2
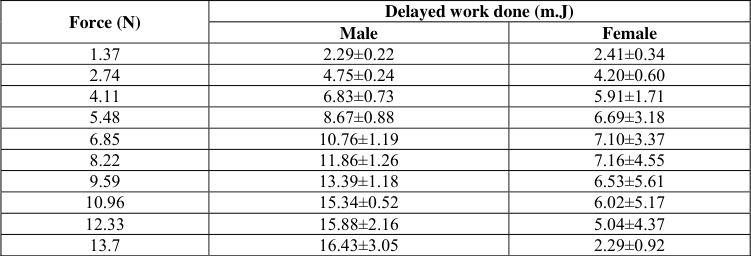 Table 3
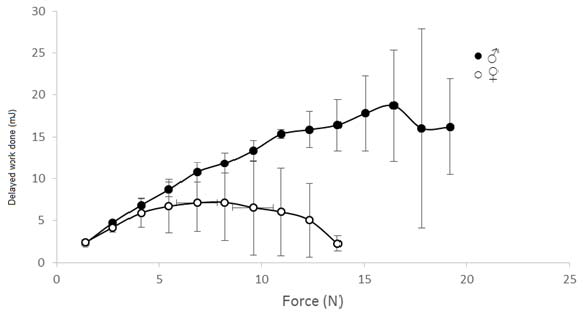 Figure 6
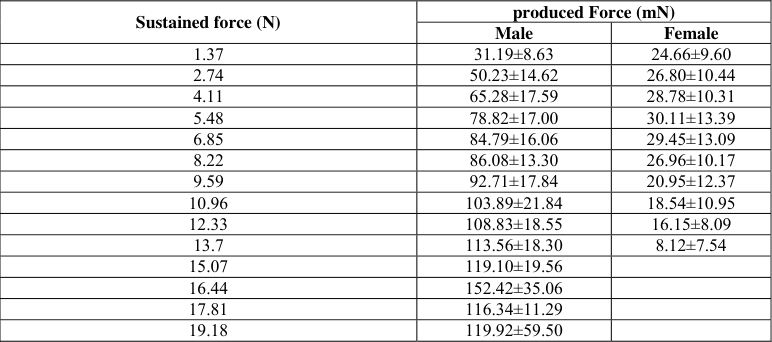 Table 4
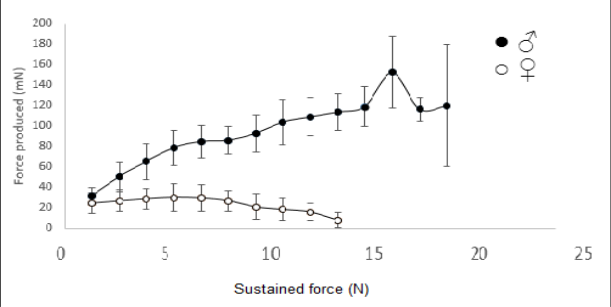 Figure 7
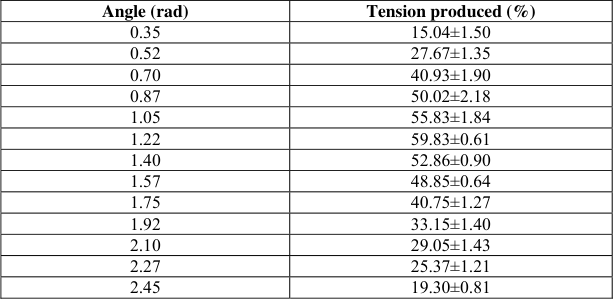 Table 5
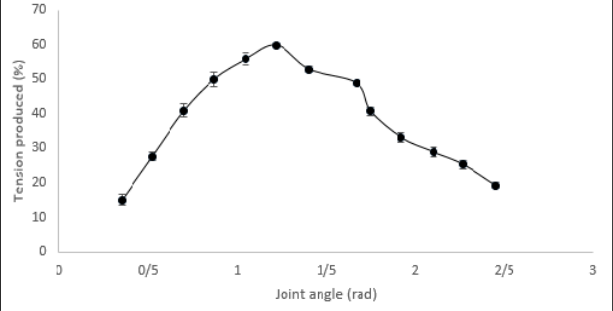 Figure 8
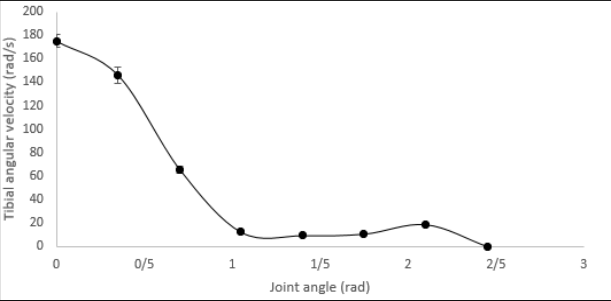 Figure 9
Introduction
Using legs in defensive behavior is not common in stick insects, but in the male Eurycantha and relative genera, the metathoracic legs play an important defensive role i.e. counter-attack against predators. Also the enlarged legs of the male, with their large spines, presumably are used for defending the colony [1] . Hsiung (1987) has observed, that the males E. calcarata, particularly when they are mixed with the females, fight with each other [2] . The insect defense adaptations could be divided into; Primary defense systems which consist primarily of cryptic behaviors and Secondary defense systems e.g. defensive chemical secretion and defensive leg movements [3] . The grasping movements of the females are much weaker as their metathoracic legs are thinner and have less developed spines. If the exhibition and use of the femur with large spines and strong cuticle are purely defensive or perhaps aggressive actions, we need to explain why they are developed more highly in the males. The correlation between mechanical properties of insect's legs, their muscles and the behavioral function, has been shown [4] . Leg movements of an insect are determined by the structure of the legs themselves and specially the nature of the articulation. Understanding how animals adapt their motor behavior to changing environmental conditions requires measuring limb kinematics and muscle activity in different behaviors [5] . When jumping, the larger legs provide greater leverage, leading to faster take-off velocity [6] . The hind legs of locusts represent an extreme specialization for the production of the rapid and powerful movements needed in kicking and in lifting a heavy body off the ground in jumping [7] . The control of locomotion requires the ability to adapt movement sequences to the behavioral context of the animal [8] . The behavioral functions of some insects or crustaceans are performed by fast movements of their limbs and the others by slow ones, for example, the fast extension and flexion of the prothoracic leg of praying mantid [9] , the fast extension of metathoracic legs of the locust [10,11] , the slow responses of stick insect muscles to neural input and hence the importance of direct measurement of muscle activation in describing how neural activity generates behavior in this system [12,13] .
The extensor tibialis muscle in the E. calcarata produces the pre-strike extension and the flexor one the strike. The metathoracic flexor tibialis muscle of the E. calcarata is the principal muscle and the behavioral function, defensive strike, of the male is dependent on the properties of this muscle. The physiological properties of a muscle can determine by isotonical and isometrical examinations [14] . The examination of muscle isotonically is more significant to predict behavior of animals [15] . Medler (2002) stated, skeletal muscles are with specific contractile features being matched to special function [16] . There are many studies on the isometric contraction of insect muscles [17,11] , some studies on isotonic contraction in vertebrate muscles [18,19] , and many studies on the tension produced by the whole muscle or muscle fibers at fixed length. I am not aware of any study on the muscles of intact insects, other than flight muscle, which showed the external work done when muscle sustained a force, and influence of properties of leg and muscle on the insects behavior. Thus, the best way to better understand the effect of the muscles on the animal behavior is to examine the physiological and mechanical properties of the muscles themselves. The correlation between the femur-tibia joint angle and physiological properties of the muscle which moves the tibia around the articulation has been observed. The spike-tomovement transfer function is based on joint angle [20] . The force generated by the metathoracic extensor muscle of locust is greatest at the extension angle of 0.52 rad and falls to zero at the angle of about 2.62 rad [10] . Although the most ultrastructural criteria such as the muscle fibers diameter and thick filaments density suggest that the differences between the male and female E. calcarata are highly significant [21] , it is necessary to examine the muscle physiology in the intact animal so that the performance of the muscle can be analyzed in the context of the behavior. Thus, in this study the physiological and mechanical properties of the specialized metathoracic flexor tibialis muscle and the legs of the adult male E. calcarata which are used for defensive strike behavior in addition to locomotion, were compared with those of the homologous but unspecialized ones from the female which are much less developed and have a primary locomotory function.
Materials and Methods
Experiments were carried out on 10 adult, 5 males and 5 females, stick insects of the Eurycantha calcarata with average body length and weight of; 11.17±0.2 cm and 14.42±0.32 g for the male and 13.2±0.31 cm and 23.71±0.42 g for the female. All experiments were performed under daylight conditions and at room temperature, 21°c -23°c. In order to calculate the contraction velocity in mm.s -1 , initial and delayed work done in mJ and the force produced by the flexor tibialis muscle in mN, with increasing sustained force, moving from femur -tibia joint angle of 1.57 rad to full flexion by the muscle; the animal was fixed ventral side up on a platform so that the tibia was vertical to the platform surface, one side of the isotonic transducer lever was attached just distal to the main tibial spine and the other side to a force. The force was increased in stages. The traces from the Washington pen recorder and the displayed traces on an oscilloscope screen, were used. The conditions of all experiments, for the male and female, were constant; the femur-tibia joint angle was set at 1.57 rad and the animals were stimulated with single 50 V pulses, so that this voltage was strong enough to produce a maximal response while the single stimulus did not injure the animal.
For all tests (N=25), 5 tests on an individual animal.
Mechanical properties of the leg and the muscle
The isometric tension produced by the muscle at each femurtibia joint angle from totally extended to full flexion, in 0.175 rad intervals, of the tibia (N=30) and the tension produced in response to repeated stimulation by the muscle of male were measured, using the Washington pen recorder and an isometric transducer. The patterns from the male and female would be similar, however the muscle of male is stronger with important role for defensive strike. Arc-sin transformation was performed on the data to allow the calculation of mean percentage tension. The tension produced per cm 2 and per gram weight of the muscle, when the muscle sustained maximum force, was measured in Newton. The minimum and maximum work output in J.Kg -1 , and power output in W.Kg -1 of the muscle weight were calculated. To relate the movement of the tibia to the physiological properties of the muscle e.g. the muscle velocity; the moment arm of the tibia and the flexor muscle which was measured directly to an accuracy of 0.01 mm (Fig. 1), the traces of tibial movement with time displayed on an oscilloscope and tibial lever factor of 6.96 for male and 10.18 for the female, were used. Correlation and regression analysis were carried out to compute the muscle movements from the movements of the tibia. A is the femur-tibia articulation. AB is the muscle moment arm of the totally extended tibia at 2.45 rad, Ac is the moment arm at the flexion angle of 2.10 rad and so on. LM is the shortening distance of the muscle when the tibia moves 0.35 rad, from 2.45 to 2.10 rad and the LP is the shortening distance when the tibia moves from full extension to al flexion.
The dimensions of the legs of the male and the female were measured from the photographs of 20 totally extended legs. The weights of the isolated legs were also measured. To measure the muscle mass in grams the muscle was dissected out whole with apodeme, dried and weighted. Then the apodeme weight was deducted from the total weight of the muscle and apodeme. To calculate the cross-sectional area of the muscle; the equation am= mm/lm×d from Grey and Mill (1983) was used [9] .
To measure the angular velocity of the tibial movement at each flexion angle, the distance of muscle shortening for each angular movement of the tibia was calculated, using the scale diagram shown in figure 1. Knowing the distance of shortening of the muscle for each angular movement of the tibia and the maximum muscle velocity, assuming that the muscle velocity is constant through the tibial movement, the time of angular movement of the tibia for each displacement was calculated. The angular velocity of the tibia at each flexion angle was estimated (N=30) from a plot of the angular displacement (rad) of the tibia against time (s) during the strike. To calculate the angular velocity at each point of tibial movement, the slopes before and after each point were measured and the mean slope was calculated. All measurements were statistically tested by Levene's Test for Equality of Variances and t-test. P-values lower than 0.01 were considered as statistically significant.
Results
To determine the effect of the metathoracic leg and flexor tibialis muscle properties from the male and the female of the Eurycantha calcarata on their functions and animal behavior, the morphological, physiological and mechanical characteristics of the leg and the muscle were studied. The most remarkable morphological difference between the male and the female is between their metathoaracic legs (Fig. 2). The leg of the male E. calcarata, with its large femur; length 32.7±0.45 mm, width 8.3 ±0.20 mm and depth 9.4±0.27 mm, is highly specialized to its behavioral function, the defensive strike. The femur is armed with 4 spines of which the third one from the proximal end is very large, 7.9±0.11 mm. However the femur of the female is much smaller, length 27.98±0.40 mm, width 4.84 ±012 and depth 6.11±0.19 mm with a much smaller main spine, 2.14±0.06 mm (Fig. 2). The wall of the femur is made of thick cuticle which is not easily broken when the insect catches a strong object. The long tibia of the male, 27.2±0.31 mm, bears several spines. The proximal tibia is curved outwards which may enable the insect to grasp larger objects between the main femur and tibial spines. The tibia of the female is slightly longer, 28.35 mm and thinner. The flexor tibialis muscle of E. calcarata is the principal and most forceful muscle. The muscle of the male which is used for defensive strike, with the weight of 0.47±0.02 g and the cross sectional area of 1.81±0.07 cm 2 , is much larger than that of the female with the weight of 0.25±0.02 g and the cross sectional area of 1.07±0.08 cm 2 .
The contraction of the muscle was divided into 2 phases: The initial twitch phase was a rapid reflex contraction of constant amplitude with a duration from 70 to 130 msec. This was followed by a much longer lasting, stronger and more variable delayed contraction; the muscle may remain in contraction for more than 30 sec and generate much more power output than the initial one. The amplitude of the delayed contraction was higher than that of the initial one for all forces sustained by the muscle i.e. the muscle did more work, produced higher tension and did not fatigue rapidly. At a low force of 2.74 N the-initial contraction was very high, but it decreased to almost zero with a high force of 20.48 N; whereas the delayed contraction at 20.48 N force decreased only about 50% and did not decreased to zero before 30 sec.
When the male was stimulated repeatedly, at 1 Hz for 1 min every 6 min, the muscle produced a series of initial isometric contractions, twitches, with a maximum tension of 24.53 N.
The tension produced within the first burst diminished about 34% of the maximum tension to 16.19 N, after 18 sec. (Fig. 3). From the 3 rd burst the tension diminished gradually throughout each burst and more strongly than in the first two bursts e.g. by 44% of the maximum tension, to 13.73 N, within the 3 rd burst and by 51% of the maximum tension to 12.02 N, within the 10 th burst (Fig. 3).
Fig 3:
The isometric tension produced by the metathoracic flexor muscle in an intact male E. calcarata, in response to electrical stimulation at 1 Hz for 1 min repeated every 6 min. The pattern of tension produced within the 1st burst (A); within the 3rd burst, after 18 min (B); within the 7th burst (C); and within 10th burst, after 60 min (D).
The changes between the bursts showed that the initial tension of each burst was similar for the 1 st to the 3 rd burst (Fig. 3).
The initial tension diminished from the 4 th burst onwards, after 22 min continued stimulation e.g. the tension diminished for the 10 th burst by 44% to 13.73 N of the maximum tension.
The terminal produced tension diminished in subsequent bursts, while it became greater than that of the initial tension of the bursts. The tension at the end of the 3 rd burst diminished by 47% to 13 N, and at the end of the 10 th burst by 73% of the maximum tension to 6.62 N. This suggests that the muscle fatigues quite slowly over an extended period. This also suggests that the muscle contains a range of physiological fiber types i.e. the fibers which contract rapidly and fatigue quickly and the fibers which contract less rapidly but exhibit greater fatigue resistance.
Velocity of the initial contraction
As the force sustained by muscle of the male increased, the contraction velocity of the muscle decreased (Fig. 4). The maximum and minimum velocity measured for the muscle of the male was 17.37±3.46 mm.s -1 , with a force of 1.37 N, and 4.42±0.9 mm.s -1 , at the maximum force that most muscles sustained, 16.44 N, respectively (Table 1). The maximum force sustained by any muscles was 19.18 N. The estimated maximum velocity of the no force muscle of the male was about 22.5 mm.s -1 and the velocity reached zero at a maximum force of 29.43 N.
| Force (N) | Velocity (mm.s-1) | — |
|---|---|---|
| Male | Female | |
| 1.37 | 17.37±3.46 | 12.87±2.13 |
| 2.74 | 14.64±2.97 | 9.27±1.80 |
| 4.11 | 13.04±2.49 | 7.41±1.44 |
| 5.48 | 11.58±1.93 | 5.55±1.33 |
| 6.85 | 10.22±1.36 | 4.06±0.96 |
| 8.22 | 8.86±0.92 | 2.85±0.73 |
| 9.59 | 7.96±0.83 | 1.92±0.87 |
| 10.96 | 7.23±0.73 | 1.46±0.66 |
| 12.33 | 6.32±0.64 | 1.17±0.33 |
| 13.7 | 5.60±0.68 | 0.75±0.45 |
| 15.07 | 4.92±0.62 | |
| 16.44 | 4.42±0.90 | |
| 17.81 | 3.78±0.88 | |
| 19.18 | 3.80±1.83 |
Table text extracted from the original PDF; superscript letters are shown inline. The original table image is below.
View original table image
Fig 4:
The correlation between the contraction velocity (mean±STD) and increased sustained force by the muscles of the male and female.
The correlation between the contraction velocity of the muscle from the female and the force sustained by the muscle (Fig. 4) was similar to that of the male. The maximum and minimum velocity measured for the muscle of the female was 12.87±2.13 mm.s -1 , with a force of 1.37 N and 1.46±0.66 mm.s -1 , at the maximum force sustained by most muscles, 10.96 N, respectively (Table 1). The maximum force sustained by any muscles was 13.70 N. The estimated maximum velocity of the no force muscle of the female was about 18 mm.s -1 and the velocity reached to zero at the maximum sustained force of 14.72 N.
The velocity of the male muscle was significantly higher (P < 0.01) and the muscle sustained much higher force than the female (Tables 1, Fig. 4).
Work done during the initial contraction
As the sustained force by the muscle of the male increased, the work done by the muscle during the initial contraction, increased until it reached a peak of 6.78±0.87 mJ, when the muscle sustained a force of 9.59 N (Table 2), then the work done decreased (Fig. 5). The work done at the maximum force sustained by most males, 16.44 N, was 4.55±2.07 mJ. The initial work done by the male reached zero at a maximum muscle force of 29.43 N, estimated by the extrapolation of the force-work done curve. The measured minimum work done during the initial contraction was 1.93±0.25 mJ, when the muscle force was 1.37 N (Table 2, Fig. 5). The correlation between the sustained force and the work done during the initial contraction by the muscle of the female was similar to that of the male. However, the work done by the female reached a peak of 3.76±0.55 mJ, when the force sustained by the muscle was 4.11 N (Table 2) i.e. much earlier than that of the male (Fig. 5). The initial work done by the muscle of the female reached zero at a maximum force of 14.72 N, estimated by extrapolation of the force-work done curve. The minimum measured initial work done by the female was 1.51±0.15 mJ, at the force sustained by most muscles, 12.33 N (Table 2, Fig. 5).
| Force (N) | Initial work done (mJ) | — |
|---|---|---|
| Male | Female | |
| 1.37 | 1.93±0.25 | 2.15±0.26 |
| 2.74 | 3.35±0.48 | 3.00±0.38 |
| 4.11 | 4.61±0.76 | 3.76±0.55 |
| 5.48 | 5.41±0.90 | 3.43±0.81 |
| 6.85 | 6.18±0.64 | 3.06±0.73 |
| 8.22 | 6.65±0.65 | 2.38±0.61 |
| 9.59 | 6.78±0.87 | 1,84±0.59 |
| 10.96 | 6.59±0.99 | 1.60±0.52 |
| 12.33 | 6.17±1.12 | 1.51±0.15 |
| 13.7 | 5.71±1.26 | 1.49±0.27 |
| 15.07 | 5.04±1.34 | |
| 16.44 | 4.55±2.07 | |
| 17.81 | 4.22±1.74 | |
| 19.18 | 4.38±3.77 |
Table text extracted from the original PDF; superscript letters are shown inline. The original table image is below.
View original table image
The peak work done during the initial contraction by the male was significantly greater than that of the female (P < 0.001) as the male sustained much higher force. The variation in the initial work done from the male was greater than that of the female (Tables 2, Fig. 5).
Work done during the delayed contraction
As the force sustained by the muscle of the male increased, the work done during the delayed contraction by the muscle increased until it reached a peak of 18.70±6.61 mJ, at the maximum sustained force by the muscle of most males, 16.44 N (Table 3, Fig. 6), then the work done decreased. The minimum measured delayed work done was 2.29±0.22 mJ, when the muscle force was 1.37 N (Table 3, Fig. 6). The work done during the delayed contraction by the muscle from the female increased as the force sustained by the muscle increased until it reached a peak of 7.16±4.55 mJ at the force of 8.22 N (Table 3, Fig. 6), then the work done decreased. The minimum measured delayed work done by the muscle was 2.41±0.34 mJ, at the sustained force of 1.37 N (Table 3, Fig. 6). The work done by the muscles at maximum force sustained by the most muscles, 10.96 N, was 6.02±5.17 mJ.
| Force (N) | Delayed work done (m.J) | — |
|---|---|---|
| Male | Female | |
| 1.37 | 2.29±0.22 | 2.41±0.34 |
| 2.74 | 4.75±0.24 | 4.20±0.60 |
| 4.11 | 6.83±0.73 | 5.91±1.71 |
| 5.48 | 8.67±0.88 | 6.69±3.18 |
| 6.85 | 10.76±1.19 | 7.10±3.37 |
| 8.22 | 11.86±1.26 | 7.16±4.55 |
| 9.59 | 13.39±1.18 | 6.53±5.61 |
| 10.96 | 15.34±0.52 | 6.02±5.17 |
| 12.33 | 15.88±2.16 | 5.04±4.37 |
| 13.7 | 16.43±3.05 | 2.29±0.92 |
Table text extracted from the original PDF; superscript letters are shown inline. The original table image is below.
View original table image
The peak work done during delayed contraction by the muscle of the male was significantly greater than that of the female (P<0.001) as the muscle from the male sustained much higher force (Table 3, Fig. 6).
The measured power output and work output
The maximum and minimum measured power output produced by the muscle of the male were 41.17±14.13 W.Kg -1 when the muscle sustained a force of 5.48 N and 19.68±10.21 W.Kg -1 when the force was 16.44 N, respectively. However, the ones produced by the muscle of the female were 52.01±26.85 W.Kg -1 when the muscle force was 2.74 N and 6.50±6.39 W.Kg -1 when the force was 10.96 N, respectively. The maximum and minimum measured work outputs of the muscle for the male were 3.4±0.97 J.Kg -1 when the muscle sustained a force of 5.48 N and 1.64±0.63 J.Kg -1 when the force was 16.44 N, respectively. Similarly, those produced by the muscle of the female were 4.33±0.97 J.Kg -1 when the muscle force was 2.74 N and 0.60±0.48 J.Kg -1 when the force was 10.96 N, respectively.
Tension produced at maximum sustained force by the muscles
The calculated tensions produced at the maximum sustained force by the muscles of the male and female were 40.81 N.g -1 and 54.80 N.g -1 and the tensions produced relative to the cross sectional area of the muscles were 10.60 N.cm -2 and 12.80 N.cm -2 , respectively.
Force produced during the initial contraction
As the force sustained by the muscle of the male increased, the force produced by the muscle increased until it reached a peak of 152.42±35.06 mN at the highest force sustained by most muscles, 16.44 N (Table 4, Fig. 7) and then it fell. The minimum measured force produced by the male was 31.19±8.63 mN at the sustained force of 1.37 N. As the force sustained by the muscle of the female increased, the force produced by the muscle increased until it reached a peak of 30.11±13.39 mN, at the sustained force of 5.48 N, after that the produced force fell (Table 4, Fig. 7). At the highest force sustained by most muscles of the females, 10.96 N, the measured produced force was 18.54±10.95 mN. The muscle of the male produced greater force (P < 0.001) and the variation in the force was usually greater than that of the females (Tables 4, Fig. 7). The measured maximum forces produced per gram weight and per cross sectional area of the muscles were 324.3 mN.g -1 and 84.2 mN.cm -2 for the male and 120.44 mN.g -1 and 28.14 mN.cm -2 for the female, respectively.
| Sustained force (N) | produced Force (mN) | — |
|---|---|---|
| Male | Female | |
| 1.37 | 31.19±8.63 | 24.66±9.60 |
| 2.74 | 50.23±14.62 | 26.80±10.44 |
| 4.11 | 65.28±17.59 | 28.78±10.31 |
| 5.48 | 78.82±17.00 | 30.11±13.39 |
| 6.85 | 84.79±16.06 | 29.45±13.09 |
| 8.22 | 86.08±13.30 | 26.96±10.17 |
| 9.59 | 92.71±17.84 | 20.95±12.37 |
| 10.96 | 103.89±21.84 | 18.54±10.95 |
| 12.33 | 108.83±18.55 | 16.15±8.09 |
| 13.7 | 113.56±18.30 | 8.12±7.54 |
| 15.07 | 119.10±19.56 | |
| 16.44 | 152.42±35.06 | |
| 17.81 | 116.34±11.29 | |
| 19.18 | 119.92±59.50 |
Table text extracted from the original PDF; superscript letters are shown inline. The original table image is below.
View original table image
Tension produced at different tibial flexion angle
As the femur-tibia joint angle decreased, from 2.45 rad, the isometric tension produced by flexor muscle increased until reached a peak, 59.83±0.61%, produced by all tests (N=30). Then as the angle decreased, the tension also decreased (Table 5; Fig. 8). The peak tension occurred at the joint angle of 1.22 rad i.e. the angle close to the angle of the normal standing position.
| Angle (rad) | Tension produced (%) |
|---|---|
| 0.35 | 15.04±1.50 |
| 0.52 | 27.67±1.35 |
| 0.70 | 40.93±1.90 |
| 0.87 | 50.02±2.18 |
| 1.05 | 55.83±1.84 |
| 1.22 | 59.83±0.61 |
| 1.40 | 52.86±0.90 |
| 1.57 | 48.85±0.64 |
| 1.75 | 40.75±1.27 |
| 1.92 | 33.15±1.40 |
| 2.10 | 29.05±1.43 |
| 2.27 | 25.37±1.21 |
| 2.45 | 19.30±0.81 |
Table text extracted from the original PDF; superscript letters are shown inline. The original table image is below.
View original table image
The tibial angular velocity
During flexion of tibia from full extension of 2.45 rad, the tibial angular velocity initially showed a little change, however, from 1.0 rad it increased rapidly (Fig. 9). The relationship between the muscle shortening and angular movement of the tibia was not linear. The minimum calculated the angular velocity of 9.35±0.43 rad.s -1 would occur at an angle of 1.4 rad. The maximum velocity of 175±5.55 rad.s -1 would occur at the end of the strike, an angle close to full flexion The kinetic energy of the tibia will increase through the defensive strike, proportional to the square of the angular velocity, given in erg by Ek= ½ I.w 2 [22] . The calculated torque, according to Γ = I.α [22] , acting about the femur-tibia articulation, applied by the flexor muscle of the male in moving the tibia, to give the measured maximum tibial acceleration of 20661 rad.s -1 at joint angle of 0.35 rad, was 9711 dyne.cm.rad -1 . The maximum extension of the tibia of E. calcarata was 2.45 rad and the largest estimated joint angle at which the insect could hold a cylindrical object between the femur and tibial spines was 1.8 rad i.e. the measured distance between the spines of 13 mm. However, the insect may catch and hold a soft object with slightly larger, by driving the main tibial and femoral spines into the restrained object.
Discussion
The physiological, mechanical and morphological properties of the specialized metathoracic flexor tibialis muscle and the leg from the male, and those of homologous but unspecialized ones in the female stick insects, Eurycantha calcarata were examined in order to find the correlation between the properties of the muscle, of the leg and the animal behavior.
Physiological Properties of the Flexor Tibialis Muscle
It is essential to describe the dynamic properties of a muscle, to recognize its biological functions and predict the muscle models, and loaded-release experiments are especially helpful for measuring this-dynamic features [12] . The most significant functional capacity of the muscle is its capability to shorten against a force and thus to do work [15] . There is an inverse relationship between the force on a muscle and the shortening velocity [23,24,25] . The velocity of the muscles decreases quicker during initial increase force on a muscle than with increasing relatively higher forces [26,27] . When the male E. calcarata muscle force increased from 1.37 N to 2.74 N, the velocity decreased up to 15.7%; however, when the force increased from 15.07 N to 16.44 N, the velocity decreased only 2.9% of the maximum measured velocity. Therefore, the force-velocity curve is nonlinear and similar to previous observations. The percentage decrease in the muscle velocity of the female is much greater, for any increase in force, than that of the male, i.e. the male can sustain much higher forces and shorten with higher velocity than the female.
The flexor tibialis muscle of E. calcarata, especially of the male, is relatively fast. The maximum velocity at zero sustained force for the male is about 22.5 mm.s -1 and that for the female is 18.0 mm.s -1 . The muscle velocity of the male reaches zero at a maximum force on the muscle of 29.43 N and that of the female at maximum force of 14.72 N. The flexor tibialis muscles of the male and female are faster than flight muscle of the locust Schistocerca gregaria, with maximum velocity of 10 mm.s -1 [28] , and slower than the metathoracic tergocoxal muscles of two tettigoniid insects Neoconocephalus robustus and N. triops which are comparable to very fast muscles such as the extensor digitorum longus of mouse [24] . The performance of muscles may be influenced by limb dimensions [29,12] . The length of the flexor and extensor muscles of all legs from Carausius morosus may be regarded as proportional to femur length and the contraction velocity is influenced directly by muscle length [12] . The slowness of the prothoracic flexor tibialis muscle of Carausius morosus compared with metathoracic extensor tibialis muscle of locusta migratoria migratorioides, may depend on the narrowness of the leg and the small inter fibers spaces in the muscle [30] . The male E. calcarata is much faster than the female, possibly because of the enlarged metathoracic femur and flexor muscle from the male. The correlation between force on the muscles and initial work done by the muscles studied here is similar to previous observations [15,14] . The work done by the male reaches a peak of 6.78 mJ at an intermediate force of 9.59 N and by the female reaches a peak of 3.76 mJ at force of 4.11 N, the female reaches the peak earlier than the male. At both ends, zero force and maximum force, 29.43 N for the male and 14.72 N for the female, the initial work done is zero. The work done by muscles increases quicker during the initial increase in force and decreases slower with increasing relatively higher force. The power of the locust flight muscle is optimum from 0.3 to 0.4 of maximum force [28] . Also the maximum work done by the muscle of the male and female E. calcarata occurs at 32.5% and 28% of the maximum force respectively.
The delayed work done during delayed contraction by the male reaches the peak of 18.70 mJ at a force of 16.44 N, however, by the female reaches the peak of 7.16 mJ at force of 8.22 N, much earlier than the male. The delayed work done by the male and female were much greater than some insect flight muscles [28,15] . The maximum initial and delayed work done by the muscle of the male was greater than those of the female. The differences between the male and female could be related to the different behavioral function of the metathoracic legs.
The relationship between the work done and the velocity of the flexor tibialis muscle was similar to previous findings [26,31] . At very low or very high muscles velocity the work done fell strongly towards zero. The force at which maximum work was done corresponded to a velocity of 0.35 times of the maximum velocity at zero force for the male and 0.41 times of the maximum velocity for the female. The maximum work done by the locust flight muscle occurs at about 0.40 times of maximum velocity at zero force [28] . The maximum measured power output produced by the muscles, 41.17 W.Kg -1 from the male and 52.01 W.Kg -1 from the female, and the maximum measured work output, 3.4 J.Kg -1 for the male and 4.33 J.Kg -1 for the female, were greater than those of some insect muscles [9,15] and similar to others [28] . The average work output during isotonic twitches of the metathoracic, flight muscle, of tettigoniid is 1.3 J.Kg -1 [15] . The maximum power output during the mantid strike from the extensor and flexor tibialis muscles of the prothoracic leg of the praying mantid Hierodula membranacea are 6 W.Kg -1 and 27 W.Kg -1 , respectively [9] . The muscles of E. calcarata sustained much higher force and produced more tension, 10.60 N.cm -2 and 40.81 N.g -1 for the male; 12.80 N.cm -2 and 54.80 N.g -1 for the female, than other insects [24] . The extensor tibialis muscle of the locust produces the maximum tensions of 9.81 N.cm -2 and 24.53 N.g -1 which is more than the tension produced by corresponding muscle of the frog, 9.81 N.g -1 [32] . Thus, the muscles studied here are relatively very powerful and have a high efficiency to do work.
The velocity of muscles, their power and efficiency may be indirectly correlated, e. g. the muscle of the male E. calcarata produces less power output than the anterior parts of the extensor iliotibialis of the salamander, Ambystoma tigrinum nebulosum [26] , but the velocity of the male at zero force is higher than that of salamander. Moreover, the muscles of the male and the female are slower but more powerful than the flexor and extensor tibialis muscle of the prothoracic leg of the praying mantis [9] . Fast muscles may develop less tension than slow ones [24,14] . The velocity of muscle from the male and the female are lower than the metathoracic and mesothoracic muscles of both N. triops and N. robustus [24] , but produce higher tension than these muscles, which is similar to the range of the tension produced by most striated muscles [33] . Thus the muscle of E. calcarata is relatively fast and produces much more power output than some very fast insect muscles. The force produced by the muscles, 152.42 mN for the male and 30.6 mN for the female, is much higher than the force exerted by the flexor and extensor tibialis muscles of the legs from the stick insect, Cuniculina impigra [34,35] and also is higher than the force produced by the flight muscle of the locust [28] . So the flexor tibialis of E. calcarata is a relatively powerful muscle. The greater force produced by the male, as compared with the female, can be related to the different evoked behavioral functions of the male and the female.
The force produced by and velocity of locomotory muscles are significantly correlated, faster muscles produce higher forces [27,36] . The maximum velocity of soleus and anterior tibialis muscles of albino rat is 54 mm.s -1 and 144 mm.s -1 respectively and the force exerted by faster anterior tibialis is about 5 times of the force exerted by the soleus muscle [37] .
The muscle of the male E. calcarata is much faster and generates more force than that of the female. The male requires to be fast and has to produce more force in order to impact the predator to the main femur spine and inflict maximum damage.
The relationship between the femur-tibia Joint angle and tension produced, during tibial flexion, by the muscle of E. calcarata, is similar to previous findings [12,25] . The produced tension reaches a peak at the Joint angle of 1.22 rads, close to the angle of the normal standing position and declines in both larger and smaller angles. Maximal tension for the majority of striated muscles occurs at near the normal resting length in the body [38,14] . The force in the extensor muscle fibers of Carausius morosus has a plateau at medium fiber lengths [12] . The histochemical and ultrastructural results also predict that the muscles are a mixture of physiological fiber types with predominantly fast fibers and that the muscle of the male contains more fast fibers than the female [21] . The physiological results show that; the muscles contract relatively fast during the initial contraction, can remain in contraction for quite long time during the delayed contraction and the muscle of the male is faster and generates more force than the female. The higher speed of the male gives the insect greater ability to catch an attacking predator and the greater produced force gives the male greater ability to inflict damage on the predator. Therefore, the mixed properties of the muscle presage that the muscle fibers will be recruited by the nervous system in a pattern suited to the behavior.
Mechanical properties of the leg and the muscle
The structure and mechanical properties of legs, of muscles and behavioral functions of insect and crustacean are correlated. During jumping, the larger legs enable the muscles to contract for longer times, leading to faster take-off velocity [6] . The prothoracic legs of the praying mantis Heirodula membranacea [39] are greatly adapted for predation; being long, massive, heavily armed with spines and the joints are very mobile. Prey is captured rapidly and precisely by the legs and held by the contraction of the large flexor tibialis muscle.
The metathoracic leg articulation of the locust Schistocerca gregaria is specialized for jumping [10] , the leg can extend to a high degree, 2.44-2.61 rad. The defensive strike of E. calcarata is performed by the metathoracic flexor tibialis muscle and correlated with the structure of the legs. Any predator that attacks the insect, if caught, would be grasped by the metathoracic legs and impaled on the main femoral spine by rapid initial contraction of the muscle, then it would be held between the femur and tibial spines for a long time and with high power during delayed contraction. Determining the mechanical output of limb joints is critical for understanding the control of complex motor behaviors such as walking [40] . The femur-tibia joint angle in the jumping leg of the rabbit flea Spilopsyllus cuniculus can extend to 2.27 rad [41] . The joint in the locust allows movement in one plane through approximately 2.79 rad [7] . The degree of the tibial extension of E. calcarata, 2.45 rad, enables the insect to catch a relatively large object. The largest object which the insect can impale on top of the main femoral spine and hold between the main femur and tibial spine, during the defensive strike, is about 13 mm in diameter at flexion angle of 1.8 rad, which is large enough to be the beak of a bird, the head of a lizard or the mouth of a small mammal.
As the joint angle of the E-calcarata decreased from full extention, the angular velocity of tibia initially showed a little change, however, from 1 rad it increases rapidly. Also at the start of tibial extension of locus, the tibia extends slowly and when the tibia has extended by about 1 rad approaches to its maximum velocity [7] . Many insects are powerful jumpers with the best able to reach take off velocities as high as 5 m.s - 1 in acceleration times less than 1 ms [42] . When a locust kicks the tibia reaches peak extension velocities of typically 802.84 rad.s -1 [43] . Mantid shrimps strike at prey or predators with the rapid extension, lasting only 4-5 ms under water [7] . In these animals, high speed is more important than high power for their behavioral function. The high speed would be produced by rapid release of stored energy or fast twitch of muscle fibers. However, in animals where power is more important and the greater control of movement is required, the rapid release of stored energy is not necessary. The Stick insect (Crausius morosus) leg muscles contract and relax slowly. Control of stick insect leg posture and movement could therefore differ from that in animals with faster muscles [13] . The fiber arrangement in pinnate pattern, markedly increases maximum muscle force but decreases maximum contraction velocity [12. 44] . There is no evidence that the E. calcarata uses stored energy for its behavioral function. The strike by the metathoracic leg of the male, with a duration of about 150 msec, from full extension to full flexion, and the maximum angular velocity of tibia of 175 rad.s -1 at angle close to full tibial flexion, is slower than some very fast insects e.g. it is much slower than the strike by prothoracic leg of the praying mantis, with a range of 520 -1222 rad.s -1 , which is very fast [45, 9] and also slower than tibial extension of the locust hind legs [7] . This lower velocity may result from the compromise of obtaining high velocity from a muscle which must retain a capability for prolonged powerful contraction. The maximum generated force, of 152.4 mN, by the muscle of male E. calcarata, transfers through the tibia flexion to the main femur spine with top area of about 0.2 mm 2 , thus the insect would inflict an object on the main femur spine with pressure of 7.6×10 5 N.m -2 which is high enough to penetrate the femoral cuticle of another male. The maximum calculated power output of the flexor muscle is much higher than that of the faster flexor and extensor tibialis muscles of the praying mantis which is in the range of other insects [9] . The maximum measured torque acting about the femur-tibia articulation of the metathoracic leg from the male E. calcarata, 9711 dyne.cm.rad -1 , at femur-tibia joint angle of 0.35 rad, is much higher than that of the prothoracic legs of the mantis, about 220 dyne.cm.rad -1 [9] . The force, the power produced by the flexor tibialis muscle and the torque acting about the articulation of the E. calcarata during defensive strike is relatively higher than other insects, i.e. it will catch and impale the object with relatively high rotational power on the main femur spine during tibial flexion and hold the object between the femur-tibia joint with high power.
The remarkable morphological difference between the male and the female E. calcarata is between their metathoracic legs. The most important adaptation of the male to its defensive strike is the large and well developed metathoracic femur armed with 4 spines, one of which is very large, 7.9±0.11 mm. The flexor muscle of the male is also much more developed, faster and produces a greater power output, due to its greater size, which is important for the defensive strike. Also the metathoracic leg and the flexor tibialis muscle of the male might be involved in aggressive actions [2] . Moreover, in their natural habitat the males come out more frequently and are more exposed to predation than the females, suggested idea by Robinson (1968) for the stick insect, Onctophasma martini [46] . Therefore, this might be a matter of selection pressures favoring the evolution of more lines of defense.
In conclusion, the principle behavioral functions of the male E. calcarata are dependent on; the physiological and mechanical properties of the metathoracic flexor tibialis muscle, mechanical properties of the leg and the structure of the femur-tibia articulation. The flexor tibialis muscle is quite fast, does much work and generates high power output. The torque acting about femur-tibia articulation is relatively high. The power of tibial flexion for the defensive strike is more important than the high speed of flexion. Since the insect does not need to catch a predator unless a predator attacks the insect. However, it needs to produce high power output to impale the predator on the main femoral spine. The differences between the male and the female must be related to their different behavioral functions.
Acknowledgement
AcknowledgmentsI would like to thank Dr. Bill Wales lecturer at the Stirling University, Scotland, U.K. for advice and encouragement during my post graduated course. This research has been received an award from Committee of Vice-Chancellors and Principals of the Universities of the United Kingdom, reference ORS/8838003.
References
44 in the original paper- Hsiung CC. Aspects of the biology of the Melanesian stick insect Eurycantha calcarata, Lucas (cheleutoptera: Phasatidea). J. Nat. Hist. 1987; 21(5):1241-1258.
- Robinson MH. The defensive behavior of some orthopteroid insects from Panama. Trans. R. ent. Soc. Lond. 1969; 12:281-303.
- Ache JM, Matheson T. Passive Joint Forces Are Tuned to Limb Use in Insects and Drive Movements without Motor Activity. Curr Biol. 2013; 23(15):1418-1426.
- Rosenbaum P, Wosnitza A, Buschges A, Gruhn M. Activity patterns and timing of muscle activity in the forward walking and backward walking stick insect Carausius morosus. J Neurophysiol. 2010; 104(3):168195.
- Sutton GP, Doroshanko M, Cullen DA, Burrows M. Take -off speed in Jumping mantises depends on body size and a power limited mechanism. J. Exp. Biol. 2016; 219(14):2127-2136
- Burrows M, Morris G. The kinematics and neural control of high-speed kicking movements in the locust. J. Exp. Biol. 2001; 204:3471-3481.
- Durr V, Ebeling W. The behavioural transition from straight to curve walking: kinetics of leg movement parameters and the initiation of turning. J. Exp. Biol. 2005; 208:2237-52.
- Gray PTA, Mill PJ. The mechanics of the predatory strike of the praying mantid Heirodula membranacea. J Exp Biol. 1983; 107:245-275.
- Bennet-Clark HC. The energetic of the jump of the locust Schistocerca gregaria. J Exp. Biol. 1975; 63:53-83.
- Heitler WJ, Braunig P. The role of fast extensor motor activity in the locust kick reconsidered. J Exp Biol. 1988; 136:289-309.
- Guschlbauer C, Scharstein H, Buschges A. The extensor tibiae muscle of the stick insect: biomechanical properties ofan insect walking leg muscle. J. Exp. Biol. 2007; 210:1092-1108.
- Hooper SL, Guschlbauer C, Blumel M, Rosenbaum P, Gruhn M, Akay T et al. Neural Control of Unloaded Leg Posture and of Leg Swing in Stick Insect, Cockroach, and Mouse Differs from That in Larger Animals. J. Neurosci. 2009; 29(13):4109-4119.
- Prosser CL. Comparative animal physiology. W. B. Saunders Company, London. 1973; 719 -788.
- Josephson, R. K. Mechanical power output from striate muscle during cyclic contraction. J. Exp. Biol. 1985; 114:493-512.
- Medler S. Comparative trends in shortening velocity and force production in skeletal muscles. Am. J. Physiol. Regul. Integr. Comp. Physiol. 2002; 283:368-378.
- Full RJ, Ahn AN. Static force and moments generated in the insect leg: comparison of a three-dimensional musculo-skeletal computer model with experimental measurements. J Exp. Biol. 1995; 198:1285-1298.
- Close R, Luff AR. Dynamic properties of inferior rectus muscle of the rat. J Physiol. 1974; 236:259-270.
- Luff AR. Dynamic properties of fast and slow skeletal muscles in the cat and rat Following cross - reinnervation. J Physiol. 1975; 248:83-96.
- Ache JM, Matheson T. Passive resting state and history of antagonist muscle activity shape active extensions in an insect limb. Journal of Neurophysiology. 2012; 107(10): 2756-2768.
- Pilehvarian AA. An Ultrastructural and Histochemical Study of the Flexor Tibialis Muscle Fiber Types in Male and Female Stick Insects (Eurycantha calcarata, L). J. Exp. Zool. 2015; 323(8):527-539.
- Burrows M. The mechanics and neural control of the prey capture strike in the mantid Shrimps squilla and hemisqulla. Z. Verg. Physiol. 1969; 62:361-381.
- Johnston IA, Wokoma A. Effects of temperature and thermal acclimation on contractile properties and metabolism of skeletal muscle in the flounder Platichthys flesus. L. J Exp. Biol. 1986; 120:119-130
- Josephson RK. Contraction dynamics of flight and stridulatory muscles of tettigoniid Insects. J. Exp. Biol. 1984; 108:77-96.
- Josephson RK. Dissecting muscle power output. J. Exp. Biol. 1999; 202:3369-3375.
- Else, P. L. and Bennett, A. F. The thermal dependence of locomotor performance and muscle contractile function in the salamander ambystoma tigrinum nebulosum. J. Exp. Bilo. 1987; 128:219-233.
- Johnston IA, Sidell BD, Driedzic WR. Force-velocity characteristics and metabolism of carp muscle fibers following temperature acclimation. J Exp. Biol. 1985; 119:239-249
- Buchthal F, Weis-Fogh T, Rosenfalck P. Twitch contractions of isolated flight muscle of locusts. Acta Physiol. Scand. 1957; 39:246-276.
- Gabriel, JM. The development of the locust jumping mechanism. Allometric growth and its effect on jumping performance. J. Exp. Biol. 1985; 118:313-326.
- Huddart H, Oates K. Ultrastructural of stick insect and locust skeletal muscle in relation to Excitation - contraction coupling. J insect physiol. 1970; 16:14671483.
- Langfeld KS, Altringham JD, Johnston IA. Temperature and the force-velocity relationship of live muscle fibers from the Teleost Myoxocephalus scorpius. J Exp. Biol. 1989; 144:437-448.
- Hoyle G. Neuromuscular mechanism of a locust skeletal muscle. Proc. Roy. Soc. Ser. B. 1955; 143:343-367.
- Close, R. Dynamic properties of mammalian skeletal muscles. Physiol. Rev. 1972; 52:129-197
- Bassler UA. movement generated in the peripheral nervous system: Rhythmic flexion by autotomized legs of the stick insect Cuniculina impigra. J. Exp. Biol. 1984; 111:191-199.
- Bassler U. Functional principles of pattern generation for walking movements of stick insect forelegs: The role of the femoral chordotonal organ afferences. J. Exp. Biol. 1988; 136:125-147.
- Medler S, Hulme K. Frequency -dependent power output and skeletal muscle design. Comparative Biochemistry and Physiology. Part A. 2009; 152:407-417.
- Wells JB. Comparison of mechanical properties between slow and fast mammalian muscles. J. Physiol. 1965; 178:252-269.
- Huddart H. The comparative structure and function of muscle. Pergamon press, Oxford, 1975.
- Gray PTA, Mill PJ. The musculature of the prothoracic legs and its innervation in Hierodula membranacea (Mantidea). Phil. Trans. R. Soc. Lond. Ser. B. 1985; 309:479-503.
- Dallmann CJ, Durr V, Schmitz J. Joint torques in a freely walking insect reveal distinct functions of leg joints in propulsion and posture control. Proc Biol Sci, 2016; 283(1823).
- Bennet-Clark HC, Lucey ECA. The jump of the flea: A study of the energetic and a model of the mechanism. J. Exp. Biol. 1967; 47:59-76.
- Burrows M. Jumping performance of planthoppers (Hemiptera, Issidae). J Exp. Biol. 2009; 212(17):28442855.
- Bayley TG, Sutton GP, Burrows MA. buckling region in locust hind legs contains resilin and absorbs energy when jumping or kicking goes wrong. J. Exp. Biol. 2012; 215:1151-1161.
- Hildebrand M. Analysis of vertebrate structure. 3 rd Edition. John Wiley & Sons. New York, Toronto, 1988;
- Copeland, J. and Carlson, A. D. Prey capture in mantids: prothoracic tibial flexion reflex. J Insect Physiol. 1977; 23:1151-1156.