
Research article · 2021 · Full text
International Journal of Veterinary Sciences and Animal HusbandryGenetic evaluation of daily milk yield across days in milk of the Sahiwal cattle in Kenya
Volume 6(2) · Pages 31–34 · DOI: 10.22271/veterinary.2021.v6.i2a.341 ↗
Research areasGenetic and phenotypic traits in livestockLivestock Farming and ManagementLivestock Management and Performance Improvement
Abstract
Author-writtenAnimals with the same lactation breeding value can have different shapes of the additive genetic lactation curve, implying differences in persistency of lactation. Since environmental conditions change across lactation, animals can re-rank through the lactation, leading to genotype by environment interaction for daily milk yield. The objectives of this project is to describe the genetic curve pattern of daily estimated breeding values and to assess the extent of sire and cow re-ranking for daily milk yield across lactation in Sahiwal cattle in Kenya. Random regression coefficients for each animal were obtained from random regression test day models using Legendre polynomials. Animals were ranked within day and rank correlations estimated using spearman’s rank correlation. The best cows and sires were those from cluster 1. Based on the results, cluster analysis can be used to pre-select cows and sires before ranking and selection is carried out.
Summary
Source-checkedPlain-language reading of the full paper, prepared with AI and checked against the text. Each point links to the authors' own words.
Why it matters
- Cattle with higher lactation persistency are more economical for producers because they rely more on roughages than on expensive concentrate supplements. View evidence ↗
- Animals can have identical overall lactation breeding values but different genetic lactation curve shapes, meaning they differ in how their milk yield persists over time. View evidence ↗
- Random regression test day models (RRTDMs) are preferred for genetic evaluation because they account for short-term environmental factors more precisely than standard lactation models. View evidence ↗
The question
- The study aimed to describe the genetic curve patterns of daily estimated breeding values (EBVs) and determine if sires and cows change their relative rankings for daily milk yield throughout lactation in Kenyan Sahiwal cattle. View evidence ↗
What they did
- A 4th order random regression model was employed to estimate fixed, additive genetic, and permanent environmental effects. View evidence ↗
- K-means non-hierarchical clustering was used to analyze genetic curve patterns based on EBVs at specific days in milk (DIM): 30, 60, 90, 120, 150, 180, 210, and 240. View evidence ↗
- Spearman's rank correlation was used to assess the extent of re-ranking among sires and cows across different days in milk. View evidence ↗
What they found
- Cows experienced more frequent changes in their relative rankings across the lactation period than sires did. View evidence ↗
- Sahiwal sires were identified as 'generalists' because they tended to maintain their superior rank performance throughout the lactation. View evidence ↗
- Compared to day 2, the number of sires remaining in the top ten dropped to 4 at day 30, 2 at day 60, 1 at day 90, and 1 at day 120. View evidence ↗
What it means
- The authors conclude that cluster analysis is a viable tool for selecting Sahiwal cows and sires based on the shapes of their genetic curve patterns, specifically at day 235. View evidence ↗
- The authors recommend using cluster analysis as an initial exploratory step to identify the best group for breeding goals before selecting specific animals within that cluster. View evidence ↗
Visual summary
1 visualsIllustrations explain the paper; they do not show study data.
Sire vs Cow Ranking Stability
AI-generated conceptual illustration (Sahiwal cattle). It explains the idea and does not show study data.
View source evidence ↗Figures & tables
From the original paper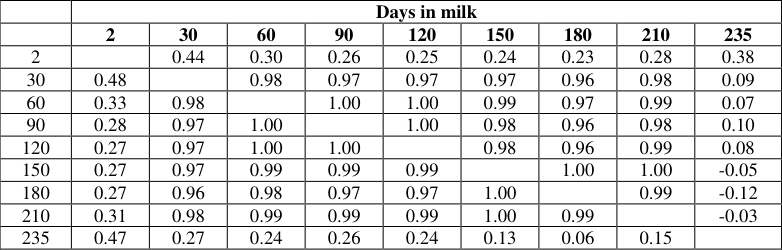 Table 1
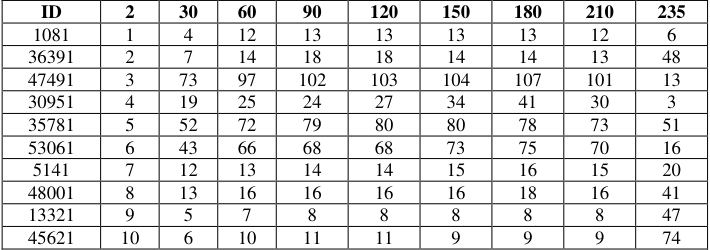 Table 2A
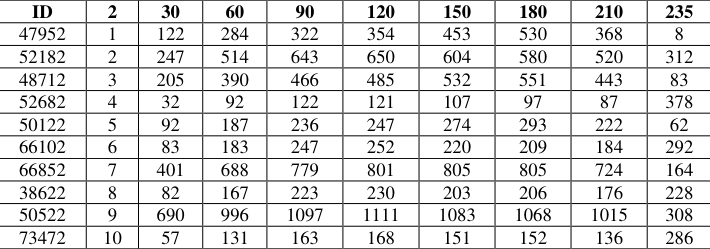 Table 2B
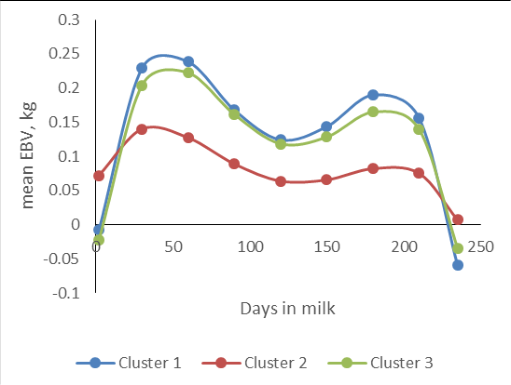 Figure 1
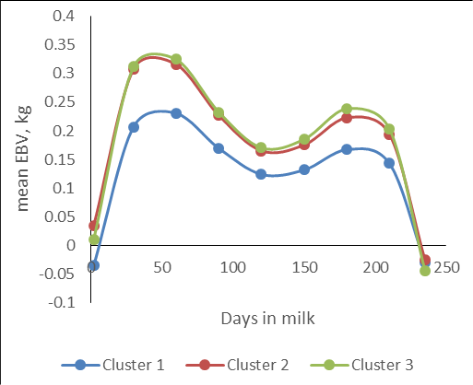 Figure 1
Introduction
Worldwide, random regression test day models (RRTDMs) are being widely adopted for genetic evaluation of dairy cattle (Interbull, 2014) [1] . This trend is because RRTDMs are able to more precisely define contemporary groups, enabling to directly account for short-term environmental factors specific to individual yields, a feature lacking in lactation models. This leads to improvements in the properties of the statistical model. RRTDMs use complete as well as incomplete lactations records, thereby overcoming the need to predict lactation milk yields. Additionally, use of incomplete lactation records provides an opportunity of shortening generation intervals. From a management perspective solutions obtained from RRTDMs can be used in decision making leading to improvements in herd management. The feasibility of implementing RRTDMs in genetic evaluations in Sahiwal cattle in Kenya has been evaluated (Ooko et al., 2016) [2] . However, the extent of re-ranking of animals across lactation was not evaluated. This is preferred that animals selected based on lactation breeding values have superior daily breeding values across lactation. It has been shown that animals with different additive genetic curves can have similar lactation breeding values. This implies the possibility of selection animals with poor lactation persistency (Khorshidie et al., 2012) [3] . Such animals require supplementation with concentrates to maintain milk yield at desired levels, leading to increased cost of production. Those that are more persistent utilize more roughages that concentrates, and are therefore more economical milk producers (Dekkers et al., 1998) [4] . Genotype by environment interaction for daily milk yield across lactation has not been investigated and it is therefore not known whether cows or sires will re-rank across lactation. Random regression test day models are more efficient than lactation models in identifying superior animals in breeding programmes. However, the environmental sensitivity of daily milk yield across a lactation have been estimated. It is therefore not known whether sire and cow will re-rank across lactation, thereby hampering use of RRTDMs in Kenya's Sahiwal cattle breeding programme.
Materials and Methods
Materials and Methods
Source of data
First lactation test day milk yield (TD) records of Sahiwal cattle breed were obtained from the National Sahiwal Stud, Naivasha. Each cow had at least 5 test day records, a sire and/or dam. Contemporary groups (CG) was determined as year-month of test day. Each contemporary group had at least 4 animals.
Statistical model and data analysis To estimate covariance components for daily milk yield across first lactation
A random regression model with a 4 th order for the fixed, additive genetic and permanent environmental effects was fitted as follows:
where ijkl y = l th TD milk yield for cow k; i HTD = fixed effect of i th herd-year-test day; j AC =fixed effect due to the j th age calving class; jm = m th fixed regression coefficient describing the average population curve; t X m = m th covariate evaluated at DIM t; km = m th random regression coefficient associated with daily additive genetic (AG) variance for animal k; km = m th random regression coefficient associated with daily permanent environmental (PE) variance for animal k;
covariates depending on DIM, t; and r e ijkl = error term, assumed to be independent and normally distributed and r=residual variance class assumed to be constant throughout lactation (Ooko et al., 2016) [2] .
To explore the genetic curve pattern of EBVs for TDMY in Sahiwal cows
Cluster analysis was used to group individual animals based on their EBVs for daily milk yield along the lactation curve. Two cluster analyses: hierarchical and non-hierarchical, was performed to describe the additive genetic pattern of daily milk yield in the population. Hierarchical cluster analysis was used to choose the number of clusters into which the population can be grouped. The Euclidian distance was used to measure the distance between the cows and the ward (1963) cluster algorithm was then used to form the clusters. Non-hierarchical clustering using k-means method was then carried out to explore the genetic curve patterns based on EBVs for 30, 60, 90, 120, 150, 180, 210 and 240 DIM. Estimated daily breeding values for sires and cows were estimated from the random regression coefficients. If i a is a 1 K a vector of additive random regression coefficients for animal I, and Z t is a 1 K a vector of Legendre polynomial coefficients evaluated at day t, in matrix notation, i a and Z t are:
then the EBV of an animal I for the t th day was:
The EBV for such an animal for 305-day milk yield was given by:
where MYg 305 c Z =vector of Legendre polynomial coefficients summed over the total lactation. The EBV for an animal i was calculated as:
Assessment the extent of cow and sire re-ranking for daily milk yield Sires and cows were arranged within DIM based on daily EBV from largest to the smallest and assigned ranked such that the sire with the largest daily EBV was ranked first while the one with the least EBV was ranked last. The rank correlation was estimated using Spearman's rank correlation (SAS, 2002) [5] . Top ten (10) sires and cows for daily milk yield from each DIM were identified. show that cows underwent more shifting in ranks across the lactation compared to sires. This is similar to the findings of Khan et al. 2008 [6] in relation to Sahiwal. The Sahiwal sires under this study could be considered generalists as they maintained their superior rank performance across the lactation. Similar results were reported by Swalve (1995) [7] , Kaya et al. (2003) [8] Khan et al. (2008) [6] . Swalve (1995) [6] reported that the largest rank shift in cows seemed to be associated with lactation curves that deviated greatly from standard lactation curve. This study also attempted to explore the genetic curve pattern of EBVs for TDMY in Sahiwal cows. Considering that Sahiwal cattle are dual purpose breeds, milk production level are still low, this implies that milk production level continues to be the main selection criterion. Therefore, emphasis should be given to persistency of lactation as a way of correcting long-term problems related to lower lactation persistency and shorter lactation length in animals of such a breeds (Cruz et al., 2016) [9] . To achieve this, cluster analysis was done based on the EBVs and days in milk with an aim of grouping those individual animals who are persistent throughout the lactation period to be used for selection purposes in Sahiwal breeding programmes.
Results and discussions
Based on cluster analyses, three non-overlapping clusters were identified as shown in Figure 1. The EBVs were higher at the beginning of lactation, decreasing then slightly increases thereafter decreasing to lowest values at the end of lactation. These trend support those obtained by spearman correlation analysis in this study (Table 1), in which higher correlations were observed between 30-210 DIM for a lactation period. Although the shapes and their respective curves across DIM were similar, clusters 1 had higher average daily EBV across lactation for sires, while for cows, cluster 2 and three had the highest average EBVs. Each cluster with specific animals presented a different genetic curve pattern based on the milk yield. Based on the results, cluster analysis can be used to pre-select cows and sires before ranking and selection is carried out with the cluster with the highest performance. This is attributed to the fact that cows with smoother production curves can be more persistent than cows exhibiting the same milk production with peak yields, but a sudden decline in production after peak lactation (Harder et al., 2006) [10] . Animals which are persistent throughout lactation have been reported to be requiring less feed and medication, therefore profiting the farmer in economic aspect (Cruz et al. 2016) [9] .
| — | Days in milk | — | — | — | — | — | — | — | — |
|---|---|---|---|---|---|---|---|---|---|
| 2 | 30 | 60 | 90 | 120 | 150 | 180 | 210 | 235 | |
| 2 | 0.44 | 0.30 | 0.26 | 0.25 | 0.24 | 0.23 | 0.28 | 0.38 | |
| 30 | 0.48 | 0.98 | 0.97 | 0.97 | 0.97 | 0.96 | 0.98 | 0.09 | |
| 60 | 0.33 | 0.98 | 1.00 | 1.00 | 0.99 | 0.97 | 0.99 | 0.07 | |
| 90 | 0.28 | 0.97 | 1.00 | 1.00 | 0.98 | 0.96 | 0.98 | 0.10 | |
| 120 | 0.27 | 0.97 | 1.00 | 1.00 | 0.98 | 0.96 | 0.99 | 0.08 | |
| 150 | 0.27 | 0.97 | 0.99 | 0.99 | 0.99 | 1.00 | 1.00 | -0.05 | |
| 180 | 0.27 | 0.96 | 0.98 | 0.97 | 0.97 | 1.00 | 0.99 | -0.12 | |
| 210 | 0.31 | 0.98 | 0.99 | 0.99 | 0.99 | 1.00 | 0.99 | -0.03 | |
| 235 | 0.47 | 0.27 | 0.24 | 0.26 | 0.24 | 0.13 | 0.06 | 0.15 |
Table text extracted from the original PDF; superscript letters are shown inline. The original table image is below.
View original table image
Conclusions
Cluster analysis can be used to choose individuals for selection based on the shapes of the genetic curve patterns for milk yield estimated breeding values at day 235 for Sahiwal cows and sires. Therefore, the more productive animals can be selected at the same time on genetic curve patterns using random regression test day models. The cluster analysis should be used as an exploratory analysis to choose the best group or cluster that meets the breeding goals and thereafter choose the best animals at specific times on the cluster chosen.
Figures and tables from the paper
| ID | 2 | 30 | 60 | 90 | 120 | 150 | 180 | 210 | 235 |
|---|---|---|---|---|---|---|---|---|---|
| 1081 | 1 | 4 | 12 | 13 | 13 | 13 | 13 | 12 | 6 |
| 36391 | 2 | 7 | 14 | 18 | 18 | 14 | 14 | 13 | 48 |
| 47491 | 3 | 73 | 97 | 102 | 103 | 104 | 107 | 101 | 13 |
| 30951 | 4 | 19 | 25 | 24 | 27 | 34 | 41 | 30 | 3 |
| 35781 | 5 | 52 | 72 | 79 | 80 | 80 | 78 | 73 | 51 |
| 53061 | 6 | 43 | 66 | 68 | 68 | 73 | 75 | 70 | 16 |
| 5141 | 7 | 12 | 13 | 14 | 14 | 15 | 16 | 15 | 20 |
| 48001 | 8 | 13 | 16 | 16 | 16 | 16 | 18 | 16 | 41 |
| 13321 | 9 | 5 | 7 | 8 | 8 | 8 | 8 | 8 | 47 |
| 45621 | 10 | 6 | 10 | 11 | 11 | 9 | 9 | 9 | 74 |
Table text extracted from the original PDF; superscript letters are shown inline. The original table image is below.
View original table image
| ID | 2 | 30 | 60 | 90 | 120 | 150 | 180 | 210 | 235 |
|---|---|---|---|---|---|---|---|---|---|
| 47952 | 1 | 122 | 284 | 322 | 354 | 453 | 530 | 368 | 8 |
| 52182 | 2 | 247 | 514 | 643 | 650 | 604 | 580 | 520 | 312 |
| 48712 | 3 | 205 | 390 | 466 | 485 | 532 | 551 | 443 | 83 |
| 52682 | 4 | 32 | 92 | 122 | 121 | 107 | 97 | 87 | 378 |
| 50122 | 5 | 92 | 187 | 236 | 247 | 274 | 293 | 222 | 62 |
| 66102 | 6 | 83 | 183 | 247 | 252 | 220 | 209 | 184 | 292 |
| 66852 | 7 | 401 | 688 | 779 | 801 | 805 | 805 | 724 | 164 |
| 38622 | 8 | 82 | 167 | 223 | 230 | 203 | 206 | 176 | 228 |
| 50522 | 9 | 690 | 996 | 1097 | 1111 | 1083 | 1068 | 1015 | 308 |
| 73472 | 10 | 57 | 131 | 163 | 168 | 151 | 152 | 136 | 286 |
Table text extracted from the original PDF; superscript letters are shown inline. The original table image is below.
View original table image
References
10 in the original paper- Interbull. Interbull routine genetic evaluation for production traits 2014.
- Ooko LA, Ilatsia ED, Muasya TK, Oliech GO, Rachuonyo HA, Kios DK et al. Genetic evaluation of lactation persistency for Sahiwal cattle in Kenya. Conference proceedings of the 3rd international interdisciplinary conference (iic-3) held at university of Eldoret from September 7th-9th 2016.
- Cruz DACD, Savegnago RP, Santana ABB, Peixoto MGCD, Bruneli FAT, Faro LE. Cluster analysis of breeding values for milk yield and lactation persistency in Guzerá cattle. Ciência Rural. 2016;46(7):1281-1288.
- Khorshidie R, Shadparvar AA, Ghavi Hossein-Zadeh N, Joezy Shakalgurabi S. Genetic trends for 305-day milk yield and persistency in Iranian Holsteins. Livestock Science 2012;144:211-217.
- Dekkers JCM, Tem Hag JH, Weersink A. Economic aspects of persistency of lactation in dairy cattle. Livestock Production Science 1998;53:237-252.
- SAS Institute. SAS users guide: Statistics. Version 9.1.3 ed. SAS Institute Inc., Cary, NC 2002.
- Khan MS, Bilal G, Bajwa IR, Rehman Z, Ahmad S. Estimation of breeding values of Sahiwal cattle using test day milk yields. Pakistan Veterinary Journal, 2008;28(3).
- Swalve HH. Test day models in the analysis of dairy production data-a review. Archiv für Tierzucht. 1995;38:591-612.
- Kaya İBRAHİM, AKBAŞ Y, Uzmay CAN. Estimation of breeding values for dairy cattle using test-day milk yields. Turkish Journal of Veterinary and Animal Sciences, 2003;27(2):459-464.
- Harder B, Bennewitz J, Hinrichs D, Kalm E. Genetic parameters for health traits and their relationship to different persistency traits in German Holstein dairy cattle. Journal of dairy science 2006;89(8):3202-3212.