
Research article · 2018 · Full text
International Journal of Agriculture Extension and Social DevelopmentAssessment of socio-personal and socio-economic characteristics of agricultural graduates of Odisha
Volume 1(2) · Pages 29–32 · DOI: 10.33545/26180723.2018.v1.i2a.85 ↗
Research areasLivestock Management and Performance ImprovementAgricultural Economics and Practices
Abstract
Author-writtenGrowth of population is directly related to the increase in importance of agriculture not only in India but also in the whole world. So, agricultural graduates are coming to the focus as of the farmers in India. Their mind-sets are also diverted after the statement given by Hon’ble Prime Minister Mr. Narendra Modi i.e, Youths should not be job seekers, they should be job providers. As no. of agricultural colleges are increasing in Odisha, no. of agricultural graduates are also increasing regularly. In this context, an assessment of socio-personal and socio-economic characteristics of agricultural graduates of Odisha was undertaken. The research study comes within the purview of survey research mainly “ex-post facto”. 80 number of respondents from three different colleges of three different universities were interviewed. Pilot study, Preparation and pre- testing of interview schedule, interviews from farmers and Processing of data had been undergone in this study. The statistical tools used in the study were frequency calculation & percentage. After proper assessment, we concluded that fathers of the respondents were more educated than their mothers. Majority of the agricultural graduate students of the state had less favourable to moderate favourable attitude towards agro-entrepreneurship. Maximum number of the respondent’s parents belonged to Govt. Service followed by business. So, The students related to agriculture must be encouraged by the family members and teachers towards agro-entrepreneurship. Agri-allied Skill oriented trainings and exposure visits should be made during undergraduate study & financial support should be provided to the interested students.
Summary
Source-checkedPlain-language reading of the full paper, prepared with AI and checked against the text. Each point links to the authors' own words.
Why it matters
- Agriculture is a primary sector of the Indian economy, with over 70% of the population depending on it for their livelihood. View evidence ↗
- Maintaining youth interest in agriculture is critical for future food security, though interest among young people is currently declining. View evidence ↗
- Because government and private jobs are limited, agricultural graduates need motivation to become job providers through agro-entrepreneurship rather than just job seekers. View evidence ↗
The question
- The study aimed to assess the socio-personal and socio-economic characteristics of agricultural graduates in Odisha. View evidence ↗
What they did
- The study surveyed 80 B.Sc(Ag) graduates who passed from selected colleges between 2018 and 2019. View evidence ↗
- Respondents were split equally between a government college (40 students) and two private colleges (20 students each). View evidence ↗
- Data analysis was performed using frequency calculations and percentages. View evidence ↗
What they found
- Among the 80 respondents, 62.5% were male and 37.5% were female. View evidence ↗
- The majority of respondents (43.8%) were from semi-urban areas, followed by rural (30%) and urban (26.2%) areas. View evidence ↗
- Most respondents belonged to the general category (67.5%), with others including OBC (16.2%), ST (8.80%), and SC (7.5%). View evidence ↗
- A majority of the respondents (68.8%) lived in nuclear families, while 31.2% lived in joint family systems. View evidence ↗
- Most respondents (83.8%) came from small families of fewer than 5 members, while 16.2% were from large families. View evidence ↗
- Fathers were generally more educated than mothers; 67.5% of fathers had a graduation degree, compared to 41.2% of mothers. View evidence ↗
- The most common family land holding size was between 1.1 and 2 hectares (35.0%). View evidence ↗
- The vast majority of parents (75.00%) were in government service, while only 1.2% were engaged in farming. View evidence ↗
- Most agricultural graduates in the state exhibited a less favorable to moderately favorable attitude toward agro-entrepreneurship. View evidence ↗
What it means
- The authors conclude that the moderately favorable attitude of students can be improved through interactive sessions with entrepreneurs and exposure visits. View evidence ↗
Visual summary
2 visualsIllustrations explain the paper; charts are replotted from the paper's own table values.
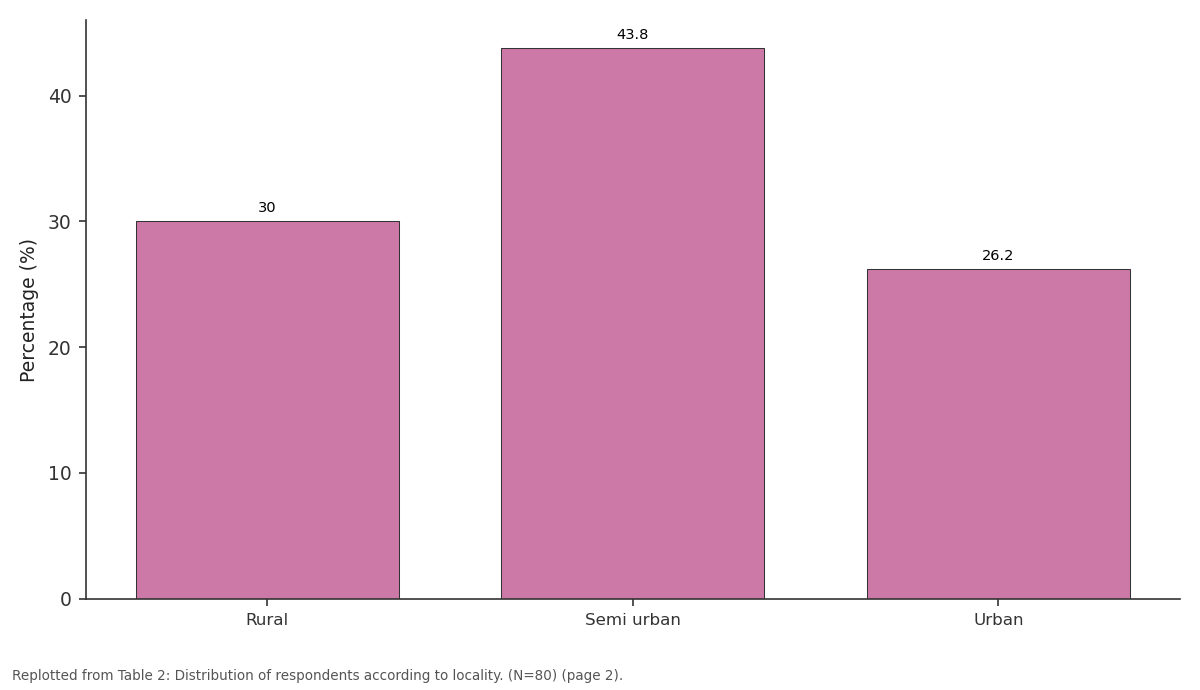
Percentage (%): Rural vs Semi urban vs Urban
Replotted from Table 2 (page 2) of the original paper. Every bar is the paper's own table value.
View source evidence ↗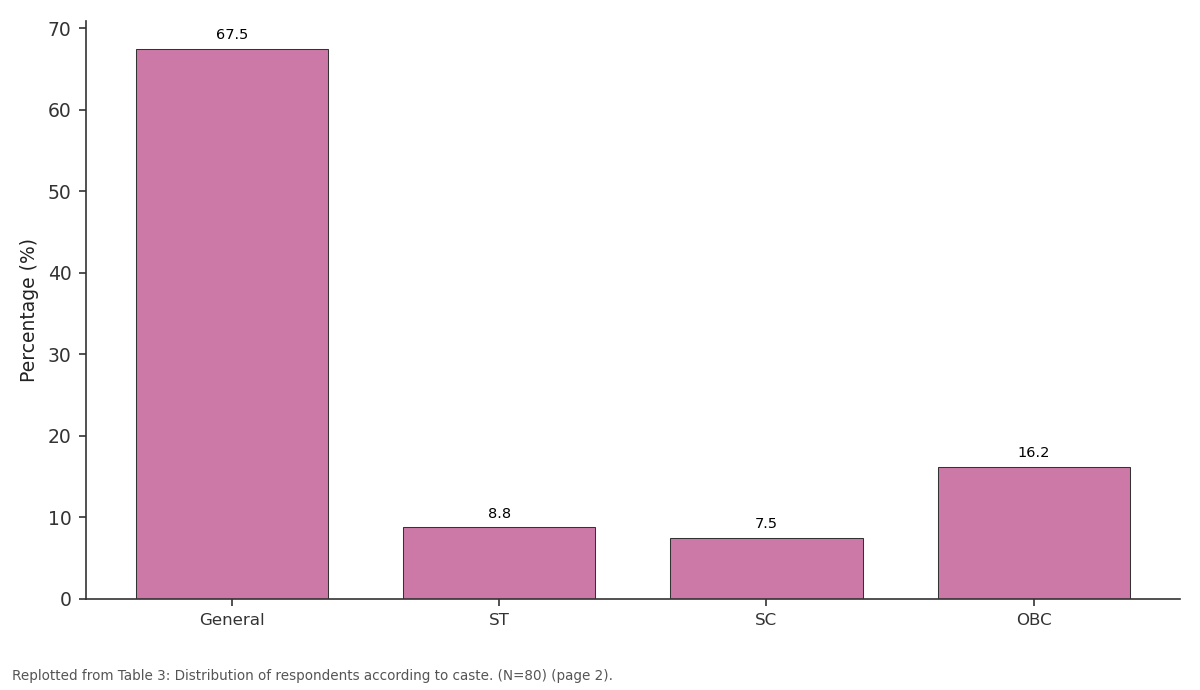
Percentage (%): General vs ST vs SC vs OBC
Replotted from Table 3 (page 2) of the original paper. Every bar is the paper's own table value.
View source evidence ↗Figures & tables
From the original paper Table 1
 Table 2
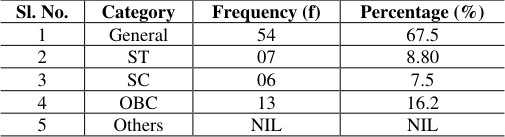 Table 3
 Table 4
 Table 5
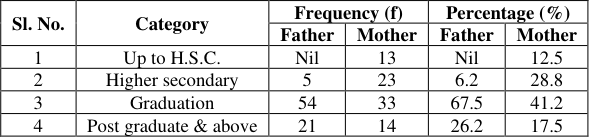 Table 6
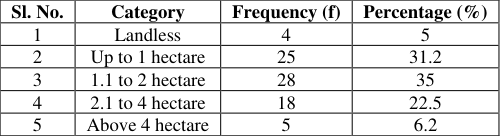 Table 8
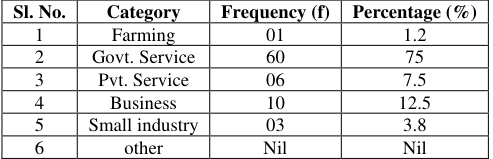 Table 7
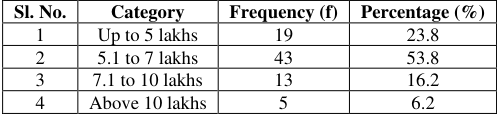 Table 9
Introduction
In the present context Agriculture is considered to be a primary sector of Indian economy, which determines the viability and sustainability of the country's economy. More than 70percent people directly or indirectly depend on agriculture for their livelihood. The Govt. of India as well as the state Govt. gives more emphasis to boost agriculture in order to increase the production and productivity of the country. In this regard much emphasis is given for quality agricultural education to double the production and to improve the socio economic condition of farmers. The interest of youngsters in agriculture is declining day by day and attracting and retaining youth in this sector is very important for future food security (Kumar and Sengar, 2017) [3] . There is a need to formulate new policy to attract and retain the bright brain for agricultural education and research. It is a fact that all the trained graduates cannot be employed in public sector. On the other hand lot of scopes remain for agricultural graduates to play a key role in improving Indian economy particularly in the field of agro-entrepreneurship for contribution to national income. Every year more than thousands of students are awarded with bachelor's degree in agriculture by the Govt. and private institutions those who impart agricultural education. It is not possible to give employment to each graduate as Govt. and private jobs are scanty in nature. Therefore the agricultural graduates are to be motivated for not to be the job seekers but to be the job givers through adopting various agri-allied activities. Against this background a study has been undertaken on the subject entitled "Assessment of Socio-personal, Socioeconomic Characteristics of Agricultural Graduates of Odisha".
Review of Literature
Ayanda et al. (2013) [1] reported that 43.20 per cent of the student's fathers and 33.30 per cent of the mothers were civil servants, 7.4 per cent were medical personnel of the father and 43.2 per cent of the mothers were in various private enterprises. Chidi (2014) [6] opined that measuring (57%) of the agricultural graduate respondents were males by females accounted for the rest of 43 per cent. Dhakre (2014) [2] concluded that majority of respondent's www.extensionjournal.com fathers 68.80 per cent were in service sector, 18.80 per cent of them were having business and 12.05 per cent were doing farming majority of the mothers (92.50%) were housewives and only 3.80 per cent of them were having business and doing jobs. Dhakre (2014) [2] found that majority of the respondents (40%) had annual income between 2 lakhs to 3 lakhs followed by 36.3 per cent of them between annual income ranges between 1 lakh to 2 lakhs. Dhakre (2014) [2] in a study observed that majority (66.3%) of the family of agricultural students size had 1 to 4 members followed by 20 per cent of them had family size of 5 to 6 members. Dhakre (2014) [2] revealed that majority (61.3%) of respondents father were college educated and majority (40%) of mother educated up to middle school. Kumar and et al. (2012) in a study revealed that boys were more willing to become livestock entrepreneur (84.85%) than girls. Kumar and sengar (2017) [3] revelled that majority (41.16%) of father were educated up to graduation and above and 19.89 per cent mother educated up to middle class. Nirmala (2001) [5] in a study found that majority (96.3%) women college students had very low risk bearing ability for entrepreneurial activity. Sridevi (2013) [4] revealed that 30 per cent of the respondent's parents were in business followed by 23.50 per cent were in government service, 6.50 per cent were unskilled workers and 5.6% were professionals.
Materials & Methods
This topic has been chosen for assessment of socio-personal, socio-economic characteristics of agricultural graduates of odisha. Before actual investigation, efforts were made to conduct a detailed survey of all related aspects of the study as it was a student project. The present research study comes within the purview of survey research mainly "ex-post facto". College of Agriculture, Bhubaneswar among the three colleges of the Govt. undertaking university i.e., Orissa University of Agriculture and Technology, Bhubaneswar and two colleges namely Faculty of Agricultural sciences of Siksha 'O' Anusandhan deemed to be university, Bhubaneswar and M.S. Swaminathan school of Agriculture of Centurion university, Gajapati among four privately running universities were selected randomly for the purpose of the study were purposefully selected for the study. The no. of respondents of the study confined to 80 numbers B.Sc(Ag) graduates pass from the selected colleges during the year 2018 and 2019. 40 respondents are selected from the Government running agriculture college i.e., College of Agriculture of OUAT, Bhubaneswar and 40 respondents, 20 each from the two privately running agriculture colleges purposefully. Pilot study, Preparation and pre-testing of interview schedule, Pretesting of interview schedule, interviews from farmers and Processing of data had been undergone in this study. The statistical tools used in the study were frequency calculation & percentage.
Results and Discussion
Socio personal profile of the agricultural graduates. Gender, locality, caste, family type, size of family, parent's education were considered as socio personal character of the respondents. As regards to locality of the respondents it was observed from the above table that majority (43.8%) of them were from semi urban area followed by 30 per cent were belonged to rural area and 26.2 per cent were from urban areas. Majority of the semi urban and rural area respondents had opted for agriculture as career option and undergone graduation studies in agriculture. Is might be due to their natural choice or due to higher cost investment in other technical studies like engineering, medical science etc. The findings are contradict with the findings of Mudau & Krugar (2014) and Sridevi (2013) [4] . Regarding size of family, it was found from the above table that majority (83.8%) respondents were from small (less than 5) family where as only 16.2 per-cent belonged to large (more than 5 members). Dhakre (2014) [2] noted similar findings in his study. The above table indicated that fathers of the respondents were more educated than their mothers. Majority (67.5%) of the respondents fathers were educated up to graduation followed by 26.2 and 6.2 per-cent educated up to post graduate and higher secondary levels respectively. As regards to the educational level of mother of the respondents majority 41.2 percent educated up to graduation. The findings are corroborated with the findings of Kumar & Sengar (2017) [3] and Dhakre (2014) [2] . Socio economic profile of the agricultural graduates. Parent's occupation, size of land holdings and annual family income were considered as socio economic characteristics of the respondents. The data in the above table indicated that maximum number of the respondent's parents (75.00%) belonged to Govt. Service followed by business 12.5 per cent, private service 7.5 per cent, industrial service 3.8 per cent and only 1.2 per cent farming as the parent's occupation. From the above results it may be concluded that majority of the respondents parent were Govt. Servants. The above findings are tally with the findings of Ayanda et al. (2014) and partly corroborated with the findings of Dhakre (2014) [2] . The data given in the above table demonstrate the distribution of respondents according to their family land holding. Out of the total no. of parents of the respondents, majority (35.0%) had land holding between 1.1-2 hectares followed by 31.2 per cent, 22.5 per cent, 6.2 per cent and 5 per cent had land holdings up to 1 hectare, 2.1-4 hectares and above 4 hectares respectively. Only 5 per cent of respondents parents belong to landless category. This might be the reason that due to the fragmentation of the family members and population growth the family land holding decreases accordingly. The above table depicted that out of total respondents majority (53.8%) had annual family income 5.1 to 7 lakhs followed by 23.8 per-cent up to 5 lakhs, 16.2 per-cent 7.1 to www.extensionjournal.com 10 lakh and 6.2 per-cent had above 10 lakhs annual family income respectively. It can be assessed from the above findings that those parents have annual income up to 5 lakhs and more can afford to send their children for higher education in agriculture. The findings are corroborated with the findings of Dhakre (2014) [2] .
Gender
Gender
Caste
Caste
Size of family
Size of family
Parent's education
Parent's education
Parent's occupation
Parent's occupation
Size of land holding
Size of land holding
Annual family income
Annual family income
Summary and Conclusion
The above findings indicated that fathers of the respondents were more educated than their mothers. Majority of the agricultural graduate students of the state had less favourable to moderate favourable attitude towards agrientrepreneurship. Maximum number of the respondent's parents belonged to Govt. Service followed by business. Out of the total no. of parents of the respondents, majority had land holding between 1.1-2 hectares. From the study it was observed that majority respondents had moderately favourable attitude for agri-allied activities can be very easily converted in to favourable attitude by organizing interactive session with successful entrepreneurs, exposure visit to nearby enterprises which should be given much emphasis by the institutions providing under graduate agricultural education to students.
Recommendations
▪ The students must be encouraged by the family members and teachers towards agri-entrepreneurship. ▪ Study related issues should be discussed more with father. ▪ Skill oriented trainings and exposure visits should be made during undergraduate study. ▪ Financial support should be provided to the interested students.
Figures and tables from the paper
| Sl. No. | Male students | — | Female students | — |
|---|---|---|---|---|
| f | % | f | % | |
| 1 | 50 | 62.5 | 30 | 37.5 |
Table text extracted from the original PDF; superscript letters are shown inline. The original table image is below.
View original table image
| Sl. No. | Category | Frequency (f) | Percentage (%) |
|---|---|---|---|
| 1 | Rural | 24 | 30 |
| 2 | Semi urban | 35 | 43.8 |
| 3 | Urban | 21 | 26.2 |
Table text extracted from the original PDF; superscript letters are shown inline. The original table image is below.
View original table image
| Sl. No. | Category | Frequency (f) | Percentage (%) |
|---|---|---|---|
| 1 | General | 54 | 67.5 |
| 2 | ST | 07 | 8.80 |
| 3 | SC | 06 | 7.5 |
| 4 | OBC | 13 | 16.2 |
| 5 | Others | NIL | NIL |
Table text extracted from the original PDF; superscript letters are shown inline. The original table image is below.
View original table image
| Sl. No. | Category | Frequency (f) | Percentage (%) |
|---|---|---|---|
| 1 | Nuclear | 55 | 68.8 |
| 2 | Joint | 25 | 31.2 |
Table text extracted from the original PDF; superscript letters are shown inline. The original table image is below.
View original table image
| Sl. No. | Category | Frequency (f) | Percentage (%) |
|---|---|---|---|
| 1 | Small family | 67 | 83.8 |
| 2 | Large family | 13 | 16.2 |
Table text extracted from the original PDF; superscript letters are shown inline. The original table image is below.
View original table image
| Sl. No. | Category | Frequency (f) | — | Percentage (%) | — |
|---|---|---|---|---|---|
| Father | Mother | Father | Mother | ||
| 1 | Up to H.S.C. | Nil | 13 | Nil | 12.5 |
| 2 | Higher secondary | 5 | 23 | 6.2 | 28.8 |
| 3 | Graduation | 54 | 33 | 67.5 | 41.2 |
| 4 | Post graduate & above | 21 | 14 | 26.2 | 17.5 |
Table text extracted from the original PDF; superscript letters are shown inline. The original table image is below.
View original table image
| Sl. No. | Category | Frequency (f) | Percentage (%) |
|---|---|---|---|
| 1 | Landless | 4 | 5 |
| 2 | Up to 1 hectare | 25 | 31.2 |
| 3 | 1.1 to 2 hectare | 28 | 35 |
| 4 | 2.1 to 4 hectare | 18 | 22.5 |
| 5 | Above 4 hectare | 5 | 6.2 |
Table text extracted from the original PDF; superscript letters are shown inline. The original table image is below.
View original table image
| Sl. No. | Category | Frequency (f) | Percentage (%) |
|---|---|---|---|
| 1 | Farming | 01 | 1.2 |
| 2 | Govt. Service | 60 | 75 |
| 3 | Pvt. Service | 06 | 7.5 |
| 4 | Business | 10 | 12.5 |
| 5 | Small industry | 03 | 3.8 |
| 6 | other | Nil | Nil |
Table text extracted from the original PDF; superscript letters are shown inline. The original table image is below.
View original table image
| Sl. No. | Category | Frequency (f) | Percentage (%) |
|---|---|---|---|
| 1 | Up to 5 lakhs | 19 | 23.8 |
| 2 | 5.1 to 7 lakhs | 43 | 53.8 |
| 3 | 7.1 to 10 lakhs | 13 | 16.2 |
| 4 | Above 10 lakhs | 5 | 6.2 |
Table text extracted from the original PDF; superscript letters are shown inline. The original table image is below.
View original table image
References
6 in the original paper- Ayanda OS, Fatoki OS, Adekola FA, Ximba BJ. Kinetics and equilibrium models for the sorption of tributyltin to nZnO, activated carbon and nZnO/activated carbon composite in artificial seawater. Marine pollution bulletin 2013;72(1):222230.
- Dhakre DS. Aspiration of agriculture students towards agriculture enterprise in West Bengal: a case study. Indian Research Journal of Extension Education, 2014;14(1):64-67.
- Kumar A, Das M, Garg V, Sengar BS, Htay MT, Kumar S et al. Forming-free high-endurance Al/ZnO/Al memristor fabricated by dual ion beam sputtering. Applied Physics Letters 2017;110(25):253509.
- Mullai P, Yogeswari MK, Sridevi KJBT. Optimisation and enhancement of biohydrogen production using nickel nanoparticles-A novel approach. Bioresource technology 2013;141:212-219.
- Nirmala X, Kodrík D, Žurovec M, Sehnal F. Insect silk contains both a Kunitz-type and a unique Kazal-type proteinase inhibitor. European Journal of Biochemistry 2001;268(7):2064-2073.
- Unekwu HR, Audu JA, Makun MH, Chidi EE. Phytochemical screening and antioxidant activity of methanolic extract of selected wild edible Nigerian mushrooms. Asian Pacific Journal of Tropical Disease 2014;4:S153-S157.