
Research article · 2018 · Full text
International Journal of Agriculture Extension and Social DevelopmentIndian agriculture and confronting issues: An critical assessment
Volume 1(2) · Pages 33–37 · DOI: 10.33545/26180723.2018.v1.i2a.87 ↗
Research areasAgricultural Economics and PracticesAgricultural risk and resilience
Abstract
Author-writtenAs a source of livelihood, agriculture (including forestry and fishing) remains the largest sector of Indian Economy. While its output share fell from 28.3% in 1993-94 to 14.4% in 2011-12, employment share declined from 64.8% to 48.9% over the same period. Therefore, almost half of the workforce in India still remains dependent on agriculture. Given the low share of this workforce in the GDP, on average, it earns much lower income poorer than its counterpart in industry and services. Therefore, progress in agriculture has a bearing on the fate of the largest proportion of the low income population in India. The paper identifies important aspects of agriculture that need immediate attention to bring economic advantages to millions of farm families. Preferably output per hectare, which is a common measure of agricultural productivity, remains low for many crops when compared to many other countries. In the above setting this paper briefly explore the current situation of Indian Agriculture and further critically examines the Issues Confronting Indian Agriculture finally concludes that it needs to strengthen policy interventions for the rejuvenation of agriculture as well as ensuring a decent life for farmers by rising productivity.
Summary
Source-checkedPlain-language reading of the full paper, prepared with AI and checked against the text. Each point links to the authors' own words.
Why it matters
- Agriculture, including fishing and forestry, is the largest sector of the Indian economy in terms of providing livelihoods. View evidence ↗
- Between 1993-94 and 2011-12, agriculture's share of output dropped from 28.3% to 14.4%, and its employment share fell from 64.8% to 48.9%. View evidence ↗
- Because the agricultural workforce contributes a low share to the GDP, these workers generally earn lower incomes than those in the service and industry sectors. View evidence ↗
The question
- The paper aims to identify critical agricultural aspects that require immediate attention to improve the economic status of millions of farming families. View evidence ↗
What they did
- The author conducts a critical assessment by exploring the current state of Indian agriculture and examining the specific issues it faces. View evidence ↗
What they found
- From the triennium ending 2001-2 to 2013-14, the area used for cereals decreased from 54% to 51%, while the area for pulses increased from 11.3% to 12.5%. View evidence ↗
- India's rice yield is significantly lower than China's, reaching only 55% of the Chinese yield. View evidence ↗
- In terms of wheat yield per hectare, India slightly outperforms the United States. View evidence ↗
- India's potato productivity is less than half that of the USA, Germany, and the Netherlands, and its banana yield is 1.5 times lower than Indonesia's. View evidence ↗
- A study indicates that 53% of farmers with land holdings under 0.63 hectares earn an income from farming that is below the poverty line. View evidence ↗
- Crop insurance programs often fail the poorest farmers because they primarily cover those with bank loans, and the poorest lack access to the banking system. View evidence ↗
What it means
- The author concludes that strengthening policy interventions to increase productivity is essential to rejuvenate agriculture and ensure a decent life for farmers. View evidence ↗
Visual summary
2 visualsIllustrations explain the paper; charts are replotted from the paper's own table values.
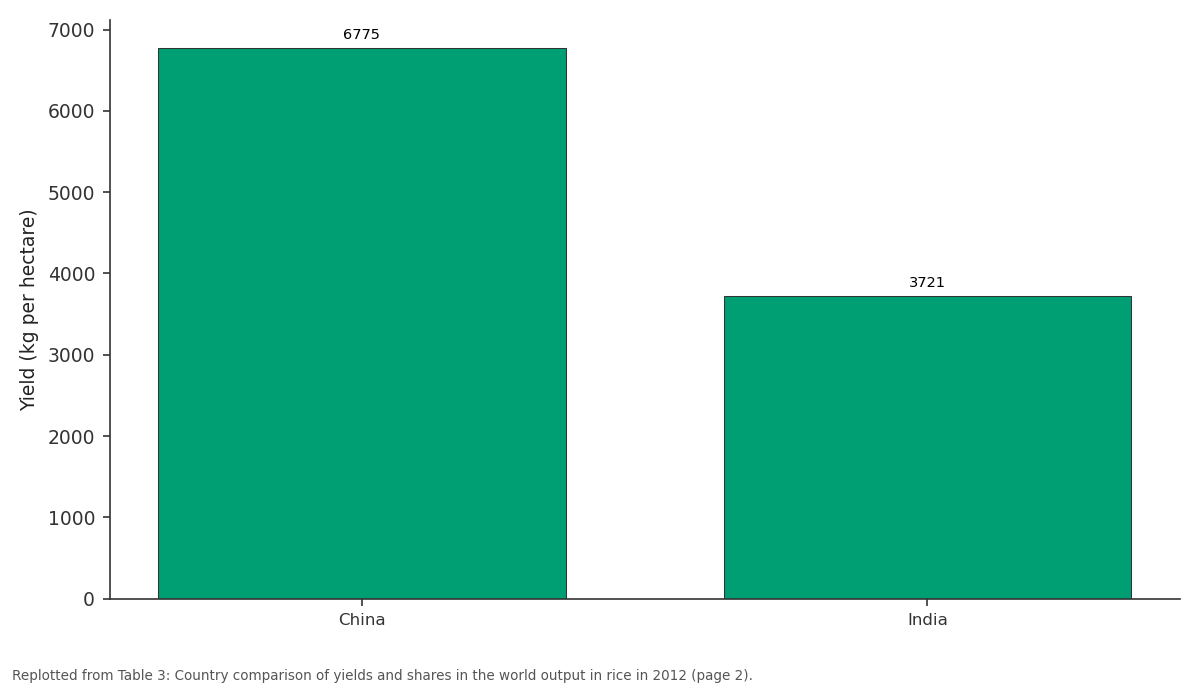
Yield (kg per hectare): China vs India
Replotted from Table 3 (page 2) of the original paper. Every bar is the paper's own table value.
View source evidence ↗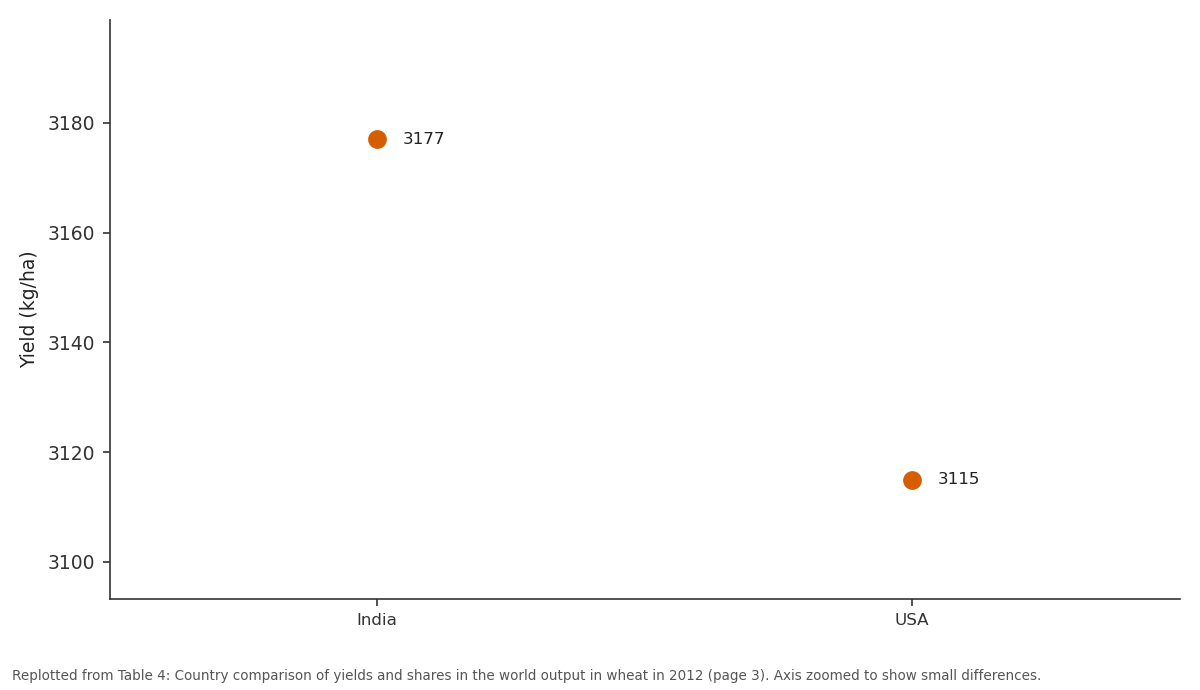
Yield (kg/ha ) 3090: India vs USA
Replotted from Table 4 (page 3) of the original paper. Every bar is the paper's own table value.
View source evidence ↗Figures & tables
From the original paper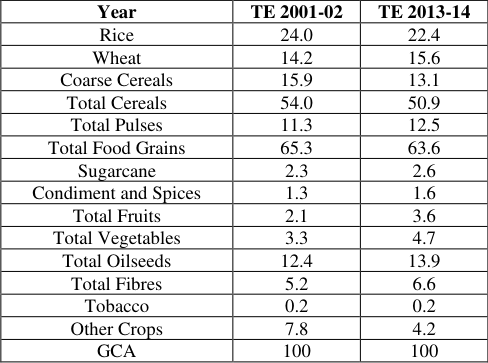 Table 1
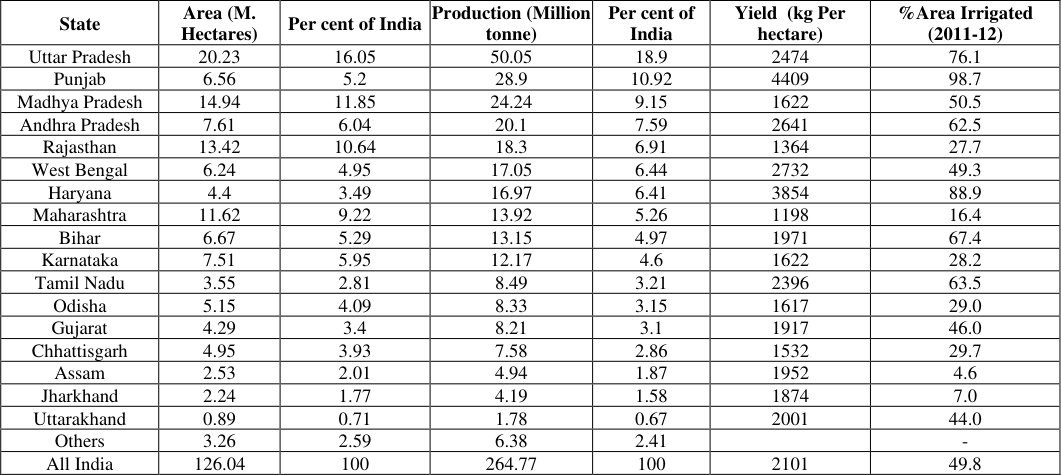 Table 2
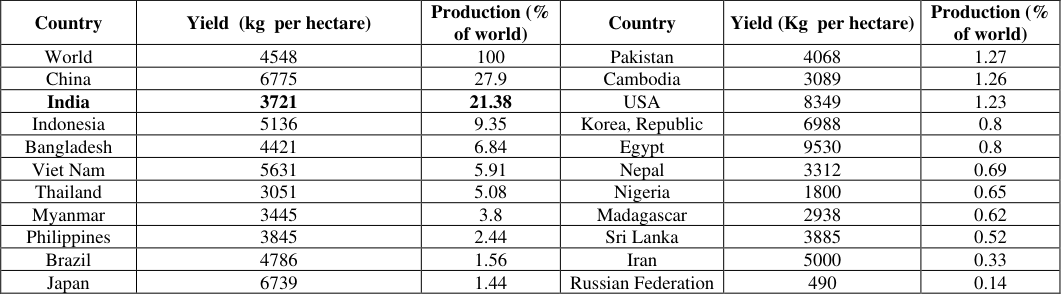 Table 3
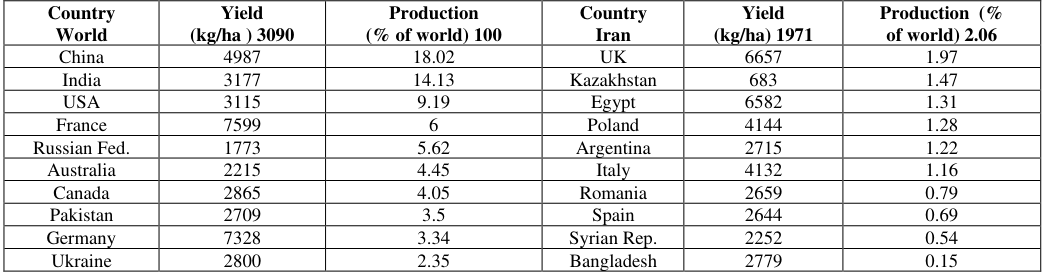 Table 4
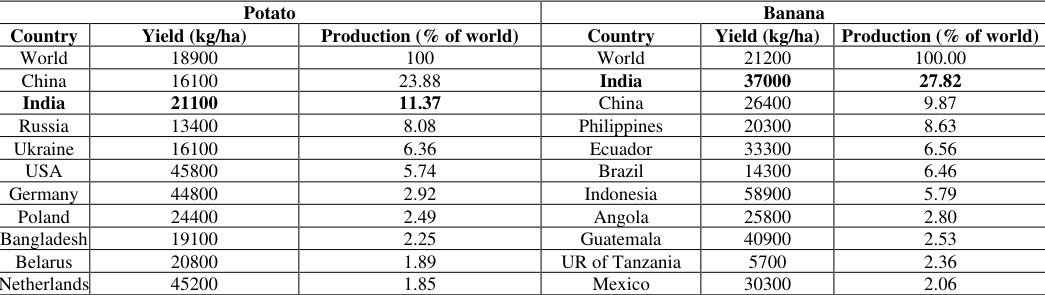 Table 5
Introduction
Since 1970-71, trend growth in Indian agriculture has been approximately 3%, above that in population but well below that in the entire economy consisting of agriculture, industry and services. By implication, while per-capita agricultural output has seen a steady rise, the share of agriculture in the Gross Domestic Product (GDP) has fallen. The rise in percapita agricultural production has gone a long way toward easing pressure on meeting food and nutrition security of the country. Unfortunately, however, growth in agricultural output is characterised by fluctuations; each high growth period is followed by a phase of low growth. This cyclical pattern has reflected itself in annual growth rates of approximately 3% in the 10 th Plan, 4% in the 11 th Plan and just 1.7% during the first three years of the 12 th Plan. Specific sub sectors, most notably crop segment, are subject to occasional severe negative shocks leading to serious distress. Crop production in the country is dominated by cultivation of paddy in Kharif and wheat in Rabi seasons. These two crops cover about 38 per cent of gross cropped area in the country. Cereals including coarse cereals occupy more than half of the total land under cultivation. Yields and the proportion of area irrigated vary widely across states. Predictably, there is a strong correlation between these two variables. Punjab ranks the first and Haryana the second in terms of both variables. Among larger producers, Madhya Pradesh, Rajasthan and Maharashtra show relatively low yields. Rajasthan and Maharashtra also exhibit low proportions of area under irrigation. In Bihar, the proportion of area irrigated is above the national average but not the yield. This is very likely due to high frequency of floods that occasionally destroy standing crops. The international comparison of yields and share in world's output in rice, wheat and horticultural crops are presented in Tables 3,4 and 5, respectively. The countries are ranked according to declining share in the output in each table. In terms of the total output, India ranks second in rice, wheat and potato with China ranking the first. In banana India ranks first followed by China. India exhibits low yields in rice when compared to other countries but not in wheat. Rice yield in India is just 55% of rice yield in China. Average yield of rice in India is much lower than other major rice producing countries like Bangladesh, Indonesia and Vietnam. India is fairly placed in terms of contribution to global production of potato and banana but there also the level of productivity is less as compared to many countries. In potato the productivity of India is less than half of the productivity of USA, Germany and Netherlands while yield of banana in Indonesia is 1.5 times higher than that of India.
Issues Confronting Indian Agriculture
Indian Agriculture is confronted with several issues. After careful deliberations, the Task Force on Agricultural Development chose to concentrate on five major issues: agricultural productivity, remunerative prices for farmers, land policy, agrarian distress and eastern states that have lagged behind the rest of the country in farming. These issues are summarized immediately below with a more detailed dissection and associated policy recommendations provided in subsequent sections.
First: A series of essential steps are required to raise agricultural productivity. At a broad level, this issue has two aspects: low average productivity at the national level and high variation in it regionally. As explained earlier, the average productivity in rice is low relative to most of the major rice producing counties. India does better in wheat but the scope for improvement exists in this crop as well.
The same goes for other crops including oilseeds, fruits and vegetables as well as activities such as animal husbandry, fisheries and poultry. The second broad productivity concern relates to regional variation. It is also evident that while Punjab and Haryana exhibit high productivity nationally, states such as Madhya Pradesh, Rajasthan, Maharashtra, Chhattisgarh, Odisha, and Karnataka suffer from quite low yields per hectare. The scope for improved productivity in these latter regions is substantial.
To increase productivity, progress is required along three dimensions: (i) Quality and judicious use of inputs such as water, seeds, fertilizer and pesticides; (ii) judicious and safe exploitation of modern technology including genetically modified (GM) seeds; and (iii) shift into high value commodities such as fruits, vegetables, flowers, fisheries, animal husbandry and poultry. In the longer run, productivity enhancement requires research toward discovery of robust seed varieties and other inputs, appropriate crops and input usage for a given soil type and effective extension practices. Agricultural research and development (R&D) in India has made impressive contribution in the past. But the system is under significant stress today with lack of clarity on focus and inefficient use of financial resources. Links among sister institutions have weakened and accountability declined over time. There is need for a rethink of the R&D system.
Second: Farmers need to be ensured to receive remunerative prices. This issue has two aspects, one relating to the Minimum Support Price (MSP) and the other relating www.extensionjournal.com to the farmer's share in the price paid by the final consumer.
Taking the MSP first, it effectively applies to a specified set of commodities, predominantly rice, wheat and cotton, and is available only in a subset of producer states. In the states in which no procurement is done by the public agencies at the MSP, farmers lack the guarantee offered by the MSP (Chand 2003, Planning Commission 2007). Moreover, subsidized sales of cereals under the public distribution system (PDS) divert part of the demand thereby artificially lowering the price at which they must sell their produce.
Likewise, for commodities such as fruits and vegetables, which are not subject to any procurement by official agencies, sometimes the market price can be excessively low due to perishability and localized nature of markets for them. The inadequate cold storage facility makes matters worse by discouraging farmers from opting for these crops in the first place. Agricultural marketing has not seen any significant reforms and modernisation for decades. The supply chain remains fragmented, scale of operations is low and there is excessive presence of intermediaries. The poor state of competitiveness is more pronounced during above normal or below normal production. A small increase in production above normal level often results in price crash for farmers and a below normal production is followed by skyrocketing prices in the post-harvest period with hardly any benefit for the farmers.
The second aspect of the price received by the famer concerns the small fraction of the price paid by the final consumer that the farmer receives in the marketplace. The continued presence of regulations flowing from the Agricultural Produce Marketing Committees (APMC) Acts in most commodities in most states has meant that the farmer is compelled to sell her produce in the governmentcontrolled marketing yards. These controls restrict transactions to the handful of local players and easy manipulations. The APMC market yards are subject to vast technical as well as marketing inefficiencies that undermine the prices that farmers receive (Chand 2012). Only a genuine implementation of the model APMC Act of 2003, which introduces all-around marketing reform, can ensure that the farmer gets her fair share of the price paid by the final consumer (Gulati and Ganguly 2010). Additionally, some of the restrictive features of the Essential Commodity Act, which create an environment of uncertainty and discourage the entry of larger players into agriculturalmarketing infrastructure, requires review and possibly revision.
Third: For understandable historical reasons, land leasing laws in India have taken forms that discourage formal leasing contracts between the owner and the tenant. Field studies have shown that most of tenancy in the country is concealed and, thus, unofficial. This fact has the implication that tenants are often not identified as actual cultivators in the records. The lack of identification of tenants as actual farmers has very serious implications for the conduct of public policy. Benefits intended for the tenant farmer such as disaster relief or direct benefit transfers risk being disbursed to the owner of the land who appears as the cultivator in the official records. In the absence of official records, tenants also lack access to formal credit and other benefits available to cultivators. In many states, leasing laws can effectively result in the loss of land to the tenant leading owners to eschew leasing land altogether. Over the generations, as families have grown, land holdings have come to be divided and fragmented into small economically unviable parcels and plots. 1 Onerous leasing laws have prevented consolidation of these holdings. On the one hand, these smallholdings force owners to seek alternative means of livelihood and on the other their plots remain uncultivated with no prospect of being joined to other plots to produce more viable holdings. Closely related, ownership rights in India are also poorly defined. All ownership is presumptive and subject to challenge in the courts According to a recent study income earned from farming by 53 per cent famers, who operate on land holdings below 0.63 hectare, is not enough even to keep them above poverty line (Chand et. al. 2015).development of a vibrant land sales market with the owner unable to get the true value of his piece of land. In turn, this discourages land sales as well when the farmer finds his piece of land too small to be a viable source of livelihood. Equally important, in the absence of ownership titles and the prospects of land disputes, banks hesitate to accept land as collateral.
Fourth: Farmers are frequently affected by natural disasters such as droughts, floods, cyclones, storms, landslides, hails and earthquakes. Because most farmers lead subsistence existence, such disasters can lead to extreme distress and hardship. Though some crop insurance schemes have been tried in the past, they have not worked effectively (Chand 2015, Raju and Chand 2007). One critical problem is that these programs predominantly cover only farmers with outstanding bank loans. Because the poorest farmers are unable to access the banking system in the first place, they are rarely covered by the insurance. There is acute need to rectify this situation by providing for at least minimum quick relief to marginal and small farmers in case of natural calamities that destroy a large proportion of the crop.
Fifth:
We need to pay special attention to the problems of farmers in eastern states. Given fertile land and abundant water resources, these states have a high potential in agriculture. Yet, their productivity in various crops lags behind the national average. Despite favorable climatic conditions and water availability crop intensity in the region is low. Therefore, concerted effort is required to bring the Green Revolution to these states (Gulati, Gujaral and Nandakumar 2010).
Conclusion
This paper has concentrated on a set of policy issues confronting Indian agriculture to throw a light that would help bring about a second Green Revolution in India and sustain robust growth in agriculture. Five such issues have been chosen: measures necessary to raise productivity, policies ensuring remunerative prices for farmers, reforms necessary in the area of land leasing and titles, a mechanism to bring quick relief to farmers hit by natural disasters, and initiatives necessary to spread Green Revolution to eastern states. While measures that have been outlined are essential for rejuvenation of agriculture as well as ensuring a decent life for farmers, we must not lose sight of the fact that relief to www.extensionjournal.com farmers will remain incomplete without the creation of job opportunities for them in non-agricultural sectors. With industry and services able to grow much faster than agriculture-the fastest that agriculture has grown over a continuous ten-year period in the post-independence era is 4.7% during the 1980s-the share of agriculture in the GDP will continue to decline. Already, this share is down to approximately 15% while it supports 49% of the workforce.
In order that today's farmer families can share in the faster growth occurring in industry and services, it is essential that some of them be able to find good jobs in these sectors. As some of the farm families move out of agriculture, the opportunities for consolidating and enlarging land holdings will open up as well. In turn, this will allow greater use of modern machinery and farm techniques allowing productivity and wages to rise rapidly in agriculture as well.
Figures and tables from the paper
| Year | TE 2001-02 | TE 2013-14 |
|---|---|---|
| Rice | 24.0 | 22.4 |
| Wheat | 14.2 | 15.6 |
| Coarse Cereals | 15.9 | 13.1 |
| Total Cereals | 54.0 | 50.9 |
| Total Pulses | 11.3 | 12.5 |
| Total Food Grains | 65.3 | 63.6 |
| Sugarcane | 2.3 | 2.6 |
| Condiment and Spices | 1.3 | 1.6 |
| Total Fruits | 2.1 | 3.6 |
| Total Vegetables | 3.3 | 4.7 |
| Total Oilseeds | 12.4 | 13.9 |
| Total Fibres | 5.2 | 6.6 |
| Tobacco | 0.2 | 0.2 |
| Other Crops | 7.8 | 4.2 |
| GCA | 100 | 100 |
Table text extracted from the original PDF; superscript letters are shown inline. The original table image is below.
View original table image
| State | Area (M. Hectares) | Per cent of India | Production (Million tonne) | Per cent of India | Yield (kg Per hectare) | %Area Irrigated (2011-12) |
|---|---|---|---|---|---|---|
| Uttar Pradesh | 20.23 | 16.05 | 50.05 | 18.9 | 2474 | 76.1 |
| Punjab | 6.56 | 5.2 | 28.9 | 10.92 | 4409 | 98.7 |
| Madhya Pradesh | 14.94 | 11.85 | 24.24 | 9.15 | 1622 | 50.5 |
| Andhra Pradesh | 7.61 | 6.04 | 20.1 | 7.59 | 2641 | 62.5 |
| Rajasthan | 13.42 | 10.64 | 18.3 | 6.91 | 1364 | 27.7 |
| West Bengal | 6.24 | 4.95 | 17.05 | 6.44 | 2732 | 49.3 |
| Haryana | 4.4 | 3.49 | 16.97 | 6.41 | 3854 | 88.9 |
| Maharashtra | 11.62 | 9.22 | 13.92 | 5.26 | 1198 | 16.4 |
| Bihar | 6.67 | 5.29 | 13.15 | 4.97 | 1971 | 67.4 |
| Karnataka | 7.51 | 5.95 | 12.17 | 4.6 | 1622 | 28.2 |
| Tamil Nadu | 3.55 | 2.81 | 8.49 | 3.21 | 2396 | 63.5 |
| Odisha | 5.15 | 4.09 | 8.33 | 3.15 | 1617 | 29.0 |
| Gujarat | 4.29 | 3.4 | 8.21 | 3.1 | 1917 | 46.0 |
| Chhattisgarh | 4.95 | 3.93 | 7.58 | 2.86 | 1532 | 29.7 |
| Assam | 2.53 | 2.01 | 4.94 | 1.87 | 1952 | 4.6 |
| Jharkhand | 2.24 | 1.77 | 4.19 | 1.58 | 1874 | 7.0 |
| Uttarakhand | 0.89 | 0.71 | 1.78 | 0.67 | 2001 | 44.0 |
| Others | 3.26 | 2.59 | 6.38 | 2.41 | - | |
| All India | 126.04 | 100 | 264.77 | 100 | 2101 | 49.8 |
Table text extracted from the original PDF; superscript letters are shown inline. The original table image is below.
View original table image
| Country | Yield (kg per hectare) | Production (% of world) | Country | Yield (Kg per hectare) | Production (% of world) |
|---|---|---|---|---|---|
| World | 4548 | 100 | Pakistan | 4068 | 1.27 |
| China | 6775 | 27.9 | Cambodia | 3089 | 1.26 |
| India | 3721 | 21.38 | USA | 8349 | 1.23 |
| Indonesia | 5136 | 9.35 | Korea, Republic | 6988 | 0.8 |
| Bangladesh | 4421 | 6.84 | Egypt | 9530 | 0.8 |
| Viet Nam | 5631 | 5.91 | Nepal | 3312 | 0.69 |
| Thailand | 3051 | 5.08 | Nigeria | 1800 | 0.65 |
| Myanmar | 3445 | 3.8 | Madagascar | 2938 | 0.62 |
| Philippines | 3845 | 2.44 | Sri Lanka | 3885 | 0.52 |
| Brazil | 4786 | 1.56 | Iran | 5000 | 0.33 |
| Japan | 6739 | 1.44 | Russian Federation | 490 | 0.14 |
Table text extracted from the original PDF; superscript letters are shown inline. The original table image is below.
View original table image
| Country World | Yield (kg/ha ) 3090 | Production (% of world) 100 | Country Iran | Yield (kg/ha) 1971 | Production (% of world) 2.06 |
|---|---|---|---|---|---|
| China | 4987 | 18.02 | UK | 6657 | 1.97 |
| India | 3177 | 14.13 | Kazakhstan | 683 | 1.47 |
| USA | 3115 | 9.19 | Egypt | 6582 | 1.31 |
| France | 7599 | 6 | Poland | 4144 | 1.28 |
| Russian Fed. | 1773 | 5.62 | Argentina | 2715 | 1.22 |
| Australia | 2215 | 4.45 | Italy | 4132 | 1.16 |
| Canada | 2865 | 4.05 | Romania | 2659 | 0.79 |
| Pakistan | 2709 | 3.5 | Spain | 2644 | 0.69 |
| Germany | 7328 | 3.34 | Syrian Rep. | 2252 | 0.54 |
| Ukraine | 2800 | 2.35 | Bangladesh | 2779 | 0.15 |
Table text extracted from the original PDF; superscript letters are shown inline. The original table image is below.
View original table image
| Potato | — | — | Banana | — | — |
|---|---|---|---|---|---|
| Country | Yield (kg/ha) | Production (% of world) | Country | Yield (kg/ha) | Production (% of world) |
| World | 18900 | 100 | World | 21200 | 100.00 |
| China | 16100 | 23.88 | India | 37000 | 27.82 |
| India | 21100 | 11.37 | China | 26400 | 9.87 |
| Russia | 13400 | 8.08 | Philippines | 20300 | 8.63 |
| Ukraine | 16100 | 6.36 | Ecuador | 33300 | 6.56 |
| USA | 45800 | 5.74 | Brazil | 14300 | 6.46 |
| Germany | 44800 | 2.92 | Indonesia | 58900 | 5.79 |
| Poland | 24400 | 2.49 | Angola | 25800 | 2.80 |
| Bangladesh | 19100 | 2.25 | Guatemala | 40900 | 2.53 |
| Belarus | 20800 | 1.89 | UR of Tanzania | 5700 | 2.36 |
| Netherlands | 45200 | 1.85 | Mexico | 30300 | 2.06 |
Table text extracted from the original PDF; superscript letters are shown inline. The original table image is below.
View original table image
References
9 in the original paper- Chand Ramesh (2005). Whither India's Food Policy: From Food Security to Food Deprivation, Economic and Political Weekly 2005;40(12):1055-1061.
- Chand Ramesh. Demand for Foodgrains. Economic and Political Weekly. December 2007;29:10-13.
- Chand Ramesh. Wheat Market: The Distortions Caused by Government Intervention, Economic and Political Weekly 2009;44(12):41-46.
- Chand Ramesh. Development Policies and Agricultural Markets, Economic and Political Weekly, Review of Rural Affairs 2012;47(52):53-63.
- Chand Ramesh, Raka Saxena, Simmi Rana. Estimates and Analysis of Farm Income in India 1983-84 to 201112, Economic and Political Weekly, Review of Rural Affairs 2015;50(22):139-145.
- Gulati Ashok, Jyoti Gujaral, Nandakumar T. National Food Securti Bill, Challenges and Options, Discussion Paper No. 2, Commission on Agricultural Costs and Prices, Ministry of Agriculture, GOI, New Delhi, December 2012.
- Gulati Ashok, Kaveri Ganguli. The Changing Landscape of Indian Agriculture, Agricultural Economics, in Johann Kirsten (ed.) The New landscape of Global agriculture, Proceedings of the Twenty Seventh Conference of the International Association of Agricultural Economists, Beijing, Wiley Blackwell 2010.
- Gulati Ashok. How to Create Economic Freedom for Agriculture -Can Agriculture be Unshackled from Government Controls, in Bibek Debroy and Laveesh Bhandari (ed) State of Economic Freedom in India 2013. available at Agriculturehttp://object.cato.org/economic-freedomindia/Economic-Freedom-States-of-India-2012Chapter-3.pdf.
- Gulati, Ashok, Banerjee, P. Rationalizing Fertiliser subsidy in India: Key issues and Policy Options: Indian Council for Research on International Economic Relations (ICRIER) Working Paper No. 307, New Delhi 2015.