
Research article · 2021 · Full text
International Journal of Geography Geology and EnvironmentOccurrence of fluoride in groundwater with special reference to health hazards, Nasrullaganj area, district Sehore, Madhya Pradesh
Volume 3(1) · Pages 19–25
Research areasGroundwater and Isotope Geochemistry
Abstract
Author-writtenThe study of fluoride, north of Nasrullaganj area has been carried out and 35 water samples have been collected from the area. The study of these samples reveals some anomalous values of fluoride in groundwater near Nasrullaganj area. The analysis was carried out following the BIS (2012) and APHA (2012) standards. The study reveals that 50% of the samples are below desirable limit, 44% samples within acceptable range and only 6% samples are above the permissible limit. High values of fluoride are being reported apparently due to heavy usage of groundwater for irrigational and drinking water purposes. The highest value reported is 3.31 mg/L and lowest 0.14 mg/L. The problem needs attention to avoid the health hazards associated with fluoride contamination in groundwater as this may come up as a major heath issue.
Summary
Source-checkedPlain-language reading of the full paper, prepared with AI and checked against the text. Each point links to the authors' own words.
Why it matters
- High concentrations of fluoride in groundwater are a significant issue in India, affecting approximately 10 lakh people across 22 states and over 200 districts as of 2016. View evidence ↗
- While excessive fluoride is harmful, limited intake is beneficial for preventing tooth decay. View evidence ↗
The question
- The study aimed to assess fluoride concentrations in the groundwater of the Nasrullaganj area to evaluate potential health impacts on the population. View evidence ↗
What they did
- The researchers collected 35 groundwater samples from the Nasrullaganj area for analysis. View evidence ↗
- Chemical analysis of the samples was performed according to the standards set by the Bureau of Indian Standards (BIS 2012) and the American Public Health Association (APHA 2012). View evidence ↗
- Water samples were stored in airtight polypropylene bottles with capacities of one or two liters. View evidence ↗
What they found
- Regarding overall distribution, 50% of samples were below the desirable limit, 44% were within the acceptable range, and 6% exceeded the permissible limit. View evidence ↗
- The fluoride concentrations in the studied groundwater ranged from a minimum of 0.14 mg/L to a maximum of 3.31 mg/L. View evidence ↗
- The average fluoride concentration across the sampled area was found to be 0.67 mg/L. View evidence ↗
- During the pre-monsoon period, 16 out of 18 samples were below the 1 mg/L desirable limit, with only two samples exceeding it (1.02 mg/L and 3.31 mg/L). View evidence ↗
- Fluoride concentrations in the groundwater generally decreased following the monsoon season. View evidence ↗
- Spatial analysis revealed that groundwater to the north of an imaginary East-West line (from Jogla to Pipaliya) had higher fluoride values than the area to the south. View evidence ↗
- The authors suggest that fluoride in the groundwater may originate from the leaching of fluoride-rich minerals within the local vesicular basalts. View evidence ↗
What it means
- The authors conclude that prolonged groundwater use and the depth of the wells are major factors contributing to the higher fluoride levels observed. View evidence ↗
- To ensure safe drinking water, the authors recommend implementing defluorination at both the domestic and community levels. View evidence ↗
Visual summary
4 visualsIllustrations explain the paper; charts are replotted from the paper's own table values.
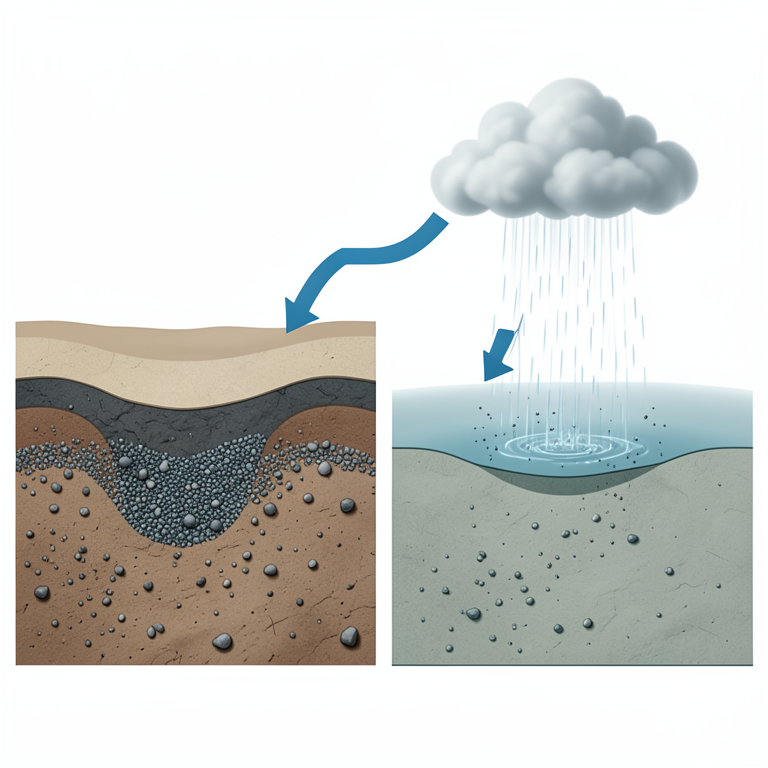
Seasonal Fluoride Variation
AI-generated conceptual illustration (groundwater aquifer in soil layers). It explains the idea and does not show study data.
View source evidence ↗
Spatial Distribution of Fluoride
AI-generated conceptual illustration (Groundwater aquifers in a rural landscape of Madhya Pradesh, India). It explains the idea and does not show study data.
View source evidence ↗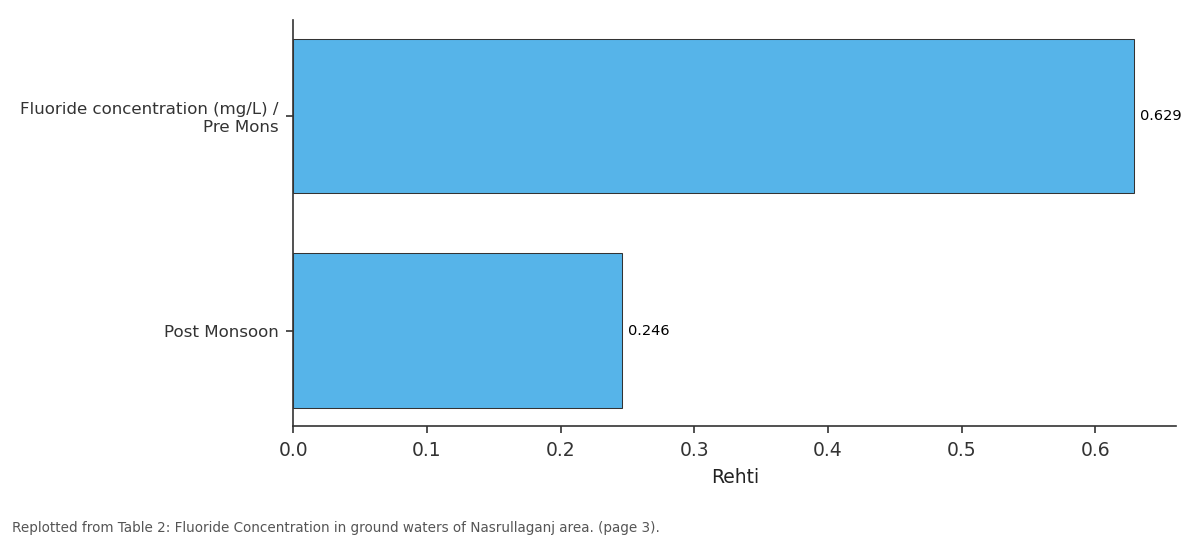
Rehti: Fluoride concentration... vs Post Monsoon
Replotted from Table 2 (page 3) of the original paper. Every bar is the paper's own table value.
View source evidence ↗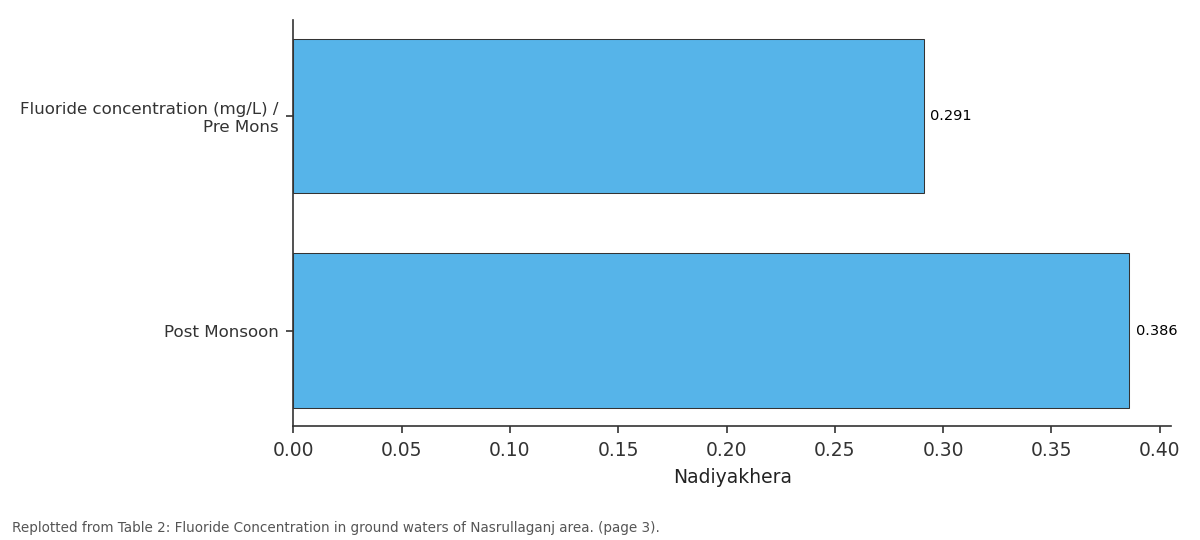
Nadiyakhera: Fluoride concentration... vs Post Monsoon
Replotted from Table 2 (page 3) of the original paper. Every bar is the paper's own table value.
View source evidence ↗Figures & tables
From the original paper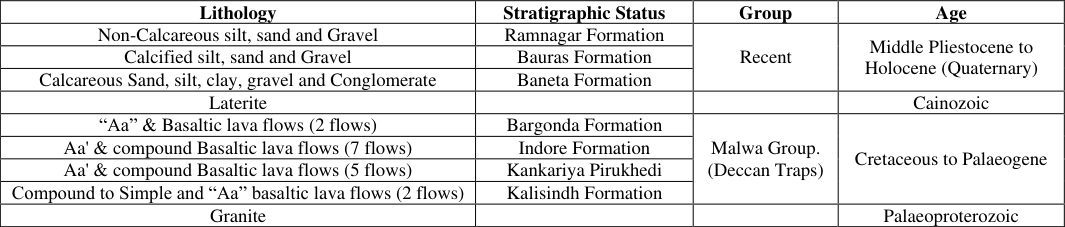 Table 1
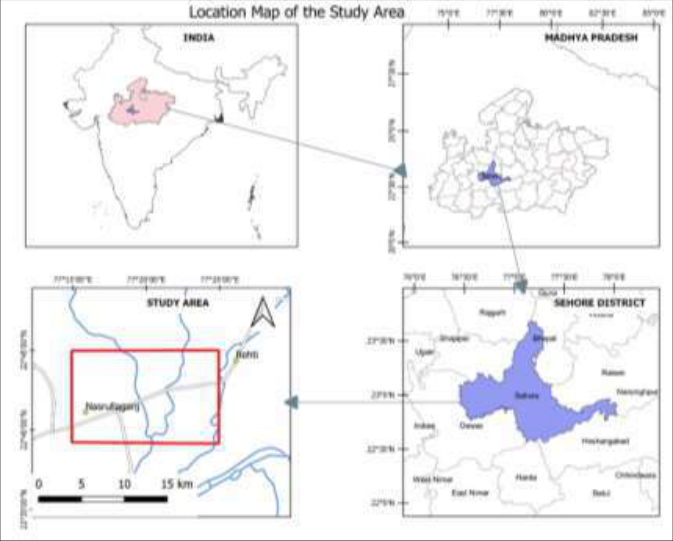 Figure 1
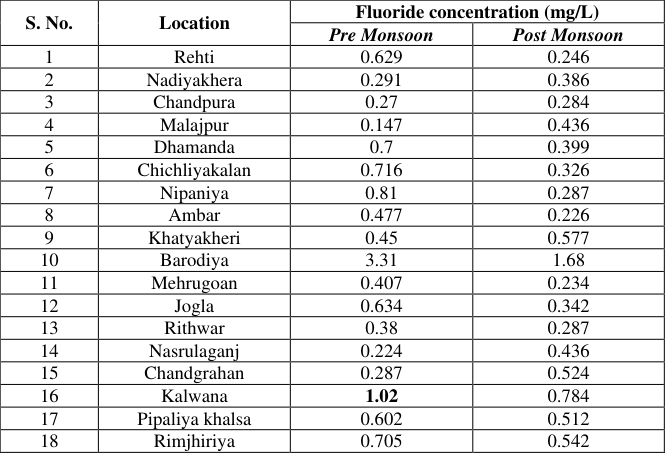 Table 2
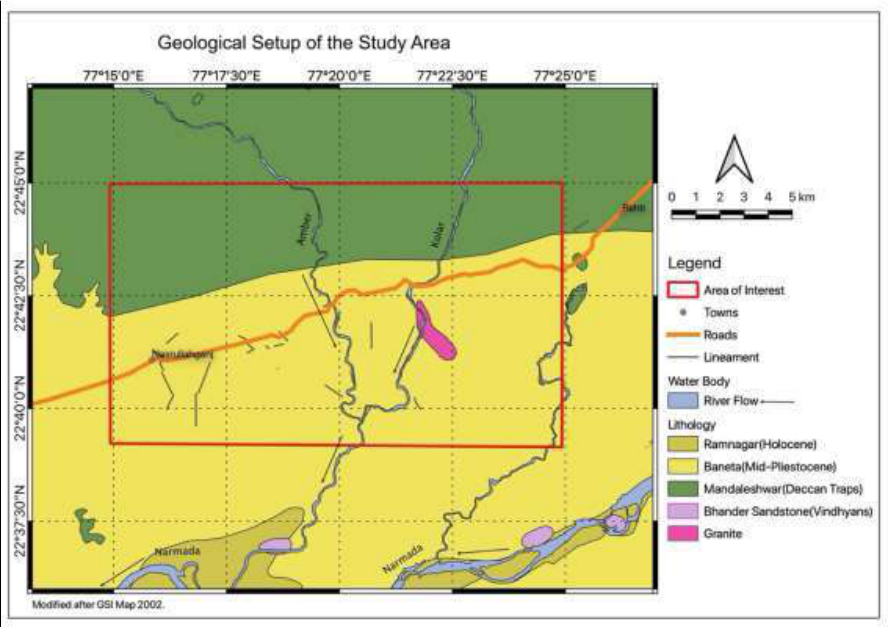 Figure 2
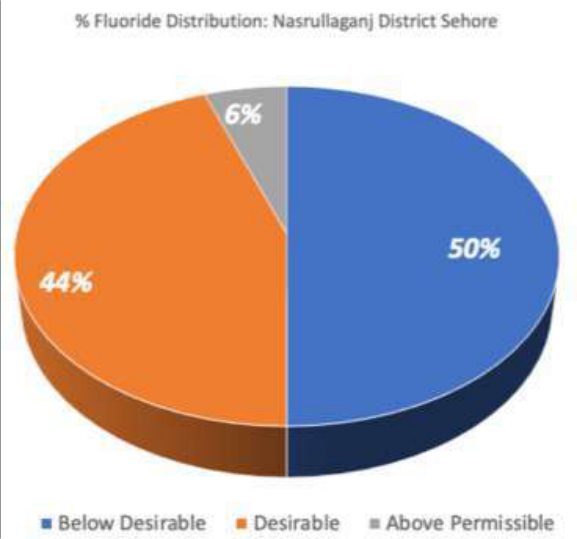 Figure 3
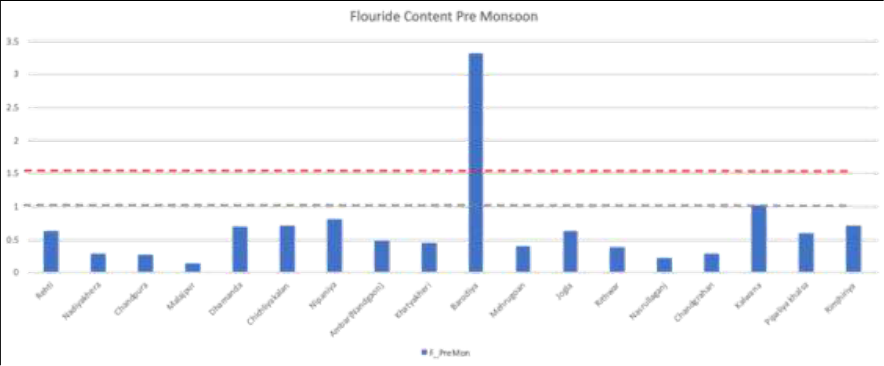 Figure 4
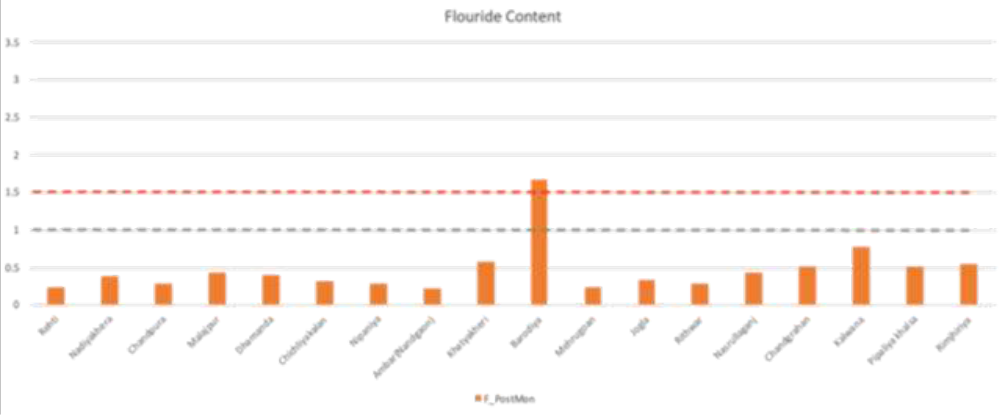 Figure 5
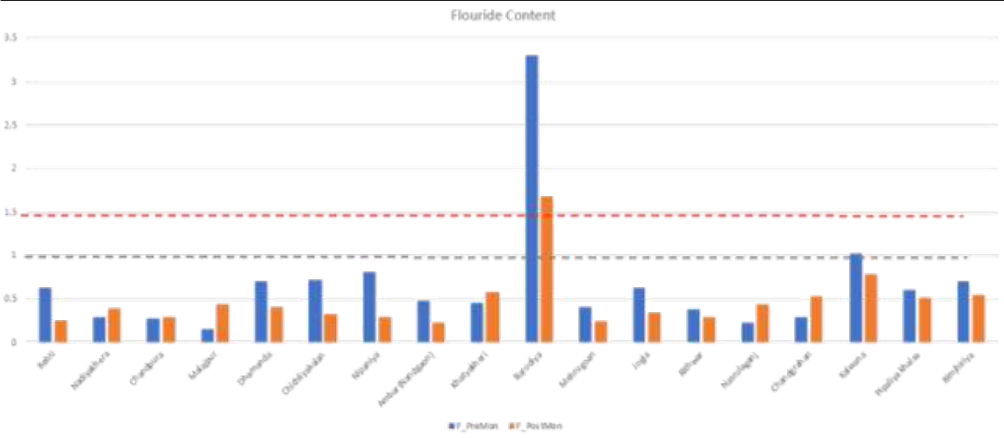 Figure 6
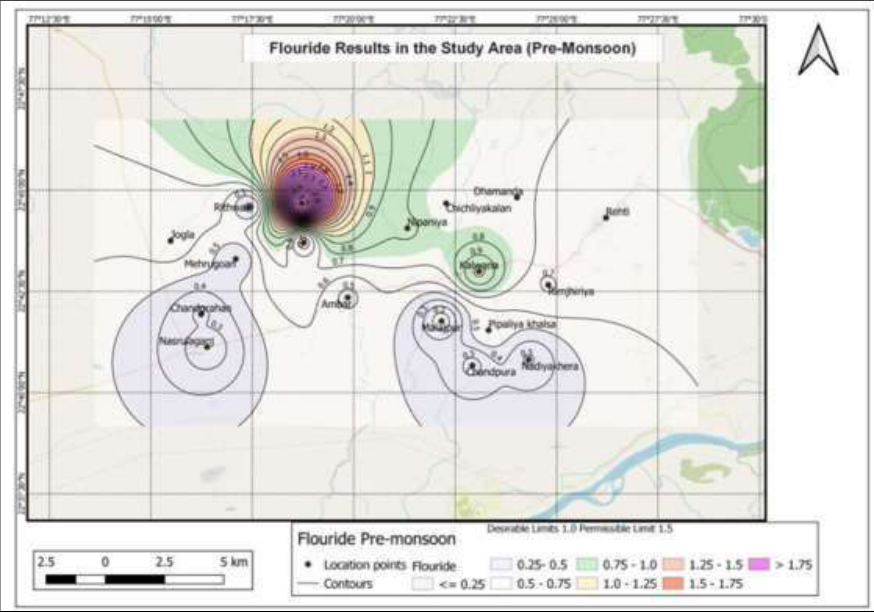 Figure 7
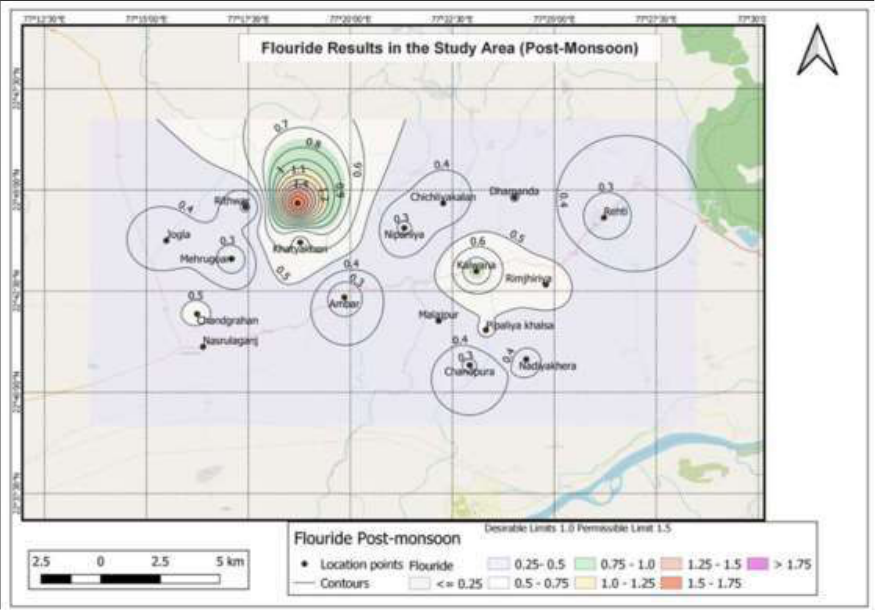 Figure 8
Introduction
India has reported overwhelming amounts of fluoride concentrations in groundwater in various states. According to the state of fluoride in India, about 10 lakh people from 22 states and 200+ districts are facing deformities due to high concentrations of fluoride, in 2016. The leading states are Rajasthan, Gujarat, Andhra Pradesh, Telangana etc. and Madhya Pradesh has also started reporting high concentrations of fluoride. Madhya Pradesh has also started reporting high concentrations of fluoride. An assessment study of water samples for fluoride concentrations from 15 districts of Madhya Pradesh reveal, high values of fluoride in Seoni (14.20 ppm), Jhabua (13.86 ppm), Vidisha (4.43 ppm), Shivpuri (3.89 ppm), Gwalior (6.20 ppm), Mandla (3.30 ppm), Bhopal (2.69 ppm), Jabalpur (5.00 ppm) and Dhar (4.07 ppm) (Jinwal & Dixit, 2009) [5] Khatarkar & Tiwari (2009) [6] have reported fluoride contamination from 9 locations in Sehore district. The study of fluoride concentration from Nasrullaganj area has been carried out for assessing the possible health impacts.
Materials and Methods
Materials and Methods
Study area
The study area is a part of Nasrullaganj, which falls under Survey of India Toposheet No. 55 F/6 and bounded by latitudes 22°40'00''to 22°45'00'' N and longitudes 77°15'00''to 77° 25'00''E thus covering a total of about 158 km 2 area. Sehore is the nearest railway station and Bhopal, the state capital of Madhya Pradesh is the nearest airport. The entire area can be accessed through all-weather roads. The area of present study lies to the north of Nasrullaganj in Sehore district of Madhya Pradesh (Fig 1). For the present study a total of 35 ground water samples were collected in order to carry out a detailed geochemical analysis. Samples were collected in airtight polypropylene bottles of one-and two-liter capacity. The chemical analysis has been carried out using standard procedures given by APHA (2012) [2] .
Geology and Geomorphology of the Area
Geologically Granites, are the oldest rocks, overlain by Vindhyans and Deccan basalts followed by laterites and alluvial deposits in the area. The recent formations can be encountered randomly in the area. Major structure in the area is the Narmada-Son Lineament running NNE-SSW (Fig 2). The geological succession of the study area is given in Table 1.
| Lithology | Stratigraphic Status | Group | Age |
|---|---|---|---|
| Non-Calcareous silt, sand and Gravel | Ramnagar Formation | Recent | Middle Pliestocene to Holocene (Quaternary) |
| Calcified silt, sand and Gravel | Bauras Formation | ||
| Calcareous Sand, silt, clay, gravel and Conglomerate | Baneta Formation | ||
| Laterite | Cainozoic | ||
| “Aa” & Basaltic lava flows (2 flows) | Bargonda Formation | Malwa Group. (Deccan Traps) | Cretaceous to Palaeogene |
| Aa' & compound Basaltic lava flows (7 flows) | Indore Formation | ||
| Aa' & compound Basaltic lava flows (5 flows) | Kankariya Pirukhedi | ||
| Compound to Simple and “Aa” basaltic lava flows (2 flows) | Kalisindh Formation | ||
| Granite | Palaeoproterozoic |
Table text extracted from the original PDF; superscript letters are shown inline. The original table image is below.
View original table image
2.2.1
Granite Granite is seen exposed near Nasrullaganj; and belongs to Paleao-Proterozoic age. These granite gneisses occur as inliers in metasediments, which consist of phyllite, schist, quartzite, gneiss and amphibolite. (Geological Survey of India, 2002) [4] .
Deccan Trap formations
The dominant rock types exposed in the study area are Deccan Traps, which cover nearly 30% of the area. The characteristic type of lava flow in the area is "Aa" type. They are disposed along a vertical column in a three-fold system. Each flow normally consists of three parts: (Singh & Singh, 2013) [7] an upper fragmentary zone a middle massive part a lower, impersistent thin layer of basalt clinkers
The top zone displays a fragmentary, brecciated very often highly vesicular and amygdular appearance. The vesicles have a sub-rounded to irregular shaped appearance. The middle massive part has a widely varying texture ranging from aphanitic to highly porphyritic. The lower layer of basalt clinker is impersistent and often absent. Wherever present, the thickness of this horizon is highly variable, ranging from a few centimetres to about 0.50 m. In terms of the physical characteristics, this layer is very similar to the to top vesicular amygdular zone. Another characteristic feature of the Deccan Trap flows in the area is the variation of the flow thickness. A distinctive feature of the flow contacts is that most of them can be demarcated by the presence of a red bole horizon. Over an altitude range of less than 100m (i.e., between 435-533 msl), as many as 12 flows of Deccan Trap have been identified in the area, with the thickness of the individual flows ranging from 5 to 10 m. It is important to note that the older flows seem to have more thickness compared to the younger ones.
Alluvium
The southern part of the study area is covered by Recent to sub-recent alluvial formations of limited areal extent and fairly good thickness occur adjacent to Narmada river. The alluvial formations comprise of silt, clay, sand, gravel and pebbles cobbles etc. with kankar. (Singh & Singh, 2013) [7] . Geomorphologically, the area is a part of Malwa Plateau.
Major rivers draining the area are Kolar and Amber. These are tributaries to the Narmada river and join about 30 km south of Nasrullaganj near village Neelkanth. Isolated hills form the major water divide towards the northern part. The general slope of the area is towards south west. The elevation ranges from 280m to 570m. Dominant soil type observed is black cotton soil and alluvial at places. Area exhibits the older flood plain of fluvial origin.
Results and Discussion
The values of fluoride concentrations are given in Table 2.
| S. No. | Location | Fluoride concentration (mg/L) | — |
|---|---|---|---|
| Pre Monsoon | Post Monsoon | ||
| 1 | Rehti | 0.629 | 0.246 |
| 2 | Nadiyakhera | 0.291 | 0.386 |
| 3 | Chandpura | 0.27 | 0.284 |
| 4 | Malajpur | 0.147 | 0.436 |
| 5 | Dhamanda | 0.7 | 0.399 |
| 6 | Chichliyakalan | 0.716 | 0.326 |
| 7 | Nipaniya | 0.81 | 0.287 |
| 8 | Ambar | 0.477 | 0.226 |
| 9 | Khatyakheri | 0.45 | 0.577 |
| 10 | Barodiya | 3.31 | 1.68 |
| 11 | Mehrugoan | 0.407 | 0.234 |
| 12 | Jogla | 0.634 | 0.342 |
| 13 | Rithwar | 0.38 | 0.287 |
| 14 | Nasrulaganj | 0.224 | 0.436 |
| 15 | Chandgrahan | 0.287 | 0.524 |
| 16 | Kalwana | 1.02 | 0.784 |
| 17 | Pipaliya khalsa | 0.602 | 0.512 |
| 18 | Rimjhiriya | 0.705 | 0.542 |
Table text extracted from the original PDF; superscript letters are shown inline. The original table image is below.
View original table image
The study of the table reveals that two samples from preand post-monsoon have reported the values above the permissible limits. These are 3.31 mg/L and 1.68mg/L from a borewell, located at Barodiya. The higher values are more than permissible limits of BIS (2012) [3] i.e., more than 1.5 mg/L. However, the average value in the area is 0.67mg/L. A relative distribution of fluoride content within the samples can be seen in Figure 3, in the study area, as function of the desirable and permissible limits of BIS (2012) [3] and U.S Public Health Services. It is interesting to note that 50% of the samples have fluoride content below the desirable limit with 44% of the samples lying within the desirable and permissible limits. 6% of the samples have Fluoride above the permissible limit. The area covering these 44% samples can be considered to be suitable for drinking purposes in terms of fluoride content while the area covering these 50% samples needs additional fluoride treatment/augmentation for safeguarding the villagers from health issues like dental caries etc. The distribution of fluoride concentration is represented with the help of bar graph, this can be seen in Figure 4. It is noteworthy that out of 18 samples, 16 are below the desirable limit of 1mg/L, whereas only 2 samples have reported the values above the desirable limit are 1.02 mg/L and 3.31 mg/L. The lowest value is of 0.14 mg/L. During post-monsoon period, fluoride concentration in water samples can be seen in bar graph shown in Figure 5. It is noteworthy that out of 18 samples, 17 are below the desirable limit of 1mg/L, and the remaining 1 sample shows the value 1.68 mg/L, which is above the permissible limit.
The lowest value during post-monsoon is in the order of 0.23 mg/L. The area falling into a particular colour range indicates the possible value ranges that can be assumed for a specific region radiating from the centre which is a real number.
Based on the fluoride concentration distribution in the water samples, the area can be subdivided in two broad zones separated by an imaginary line that can be drawn from villages Jogla in the west to Pipaliya in the east. The area to the north of this E-W line shows fluoride values on the higher side as compared to the area south of this E-W line.
An observation reveals that the area south of this E-W line appears to have fluoride concentration in water below the desirable limit. The population consuming water in the southern part is likely to be exposed to the health conditions caused due to low fluoride concentrations, viz. dental caries, tooth decay etc. The low fluoride levels could be considered for fluoridation in drinking water or topical introduction can also be suggested to reduce the occurrence of dental problems. (Aoun, et al., 2018) [1] .
The area north of this E-W line has values above the desirable limit. It is important to highlight the anomalously high fluoride concentration in the water sample from Barodiya (3.31 mg/L, Pre-monsoon, 1.68 mg/L, Postmonsoon). The population consuming water from this part is likely to be exposed to health conditions like fluorosis, osteosclerosis etc. The high value of fluoride concentration in ground water during pre-monsoon spell indicate the possibility of water samples collected from the fractured vesicular basalts, which has been reported as the bedrock here (Singh & Singh, 2007) [8] . The ions from the leaching of fluoride rich minerals within the vesicular basalts could be contributing to the fluoride content in the groundwater. The lower levels of post-monsoon fluoride concentration in water samples from certain areas is possibly due to the rise in water column, which dilutes the fluoride content. The higher levels of post monsoon fluoride concentration in water samples from the other areas could be anthropogenic sources with contribution from fertilizers.
Conclusion
The depth of the well and prolonged usage of groundwater is apparently playing a major role in the higher values of fluoride in the area. Ground water recharge and wells of shallow depths would serve to reduce the fluoride contamination of groundwater from the bedrock. Educating community about the presence of fluoride in the groundwater and its hazards. Introduction of defluorination of water at the community and domestic level will help to make water safe for drinking purpose.
Figures and tables from the paper
References
8 in the original paper- Aoun A, Darwiche F, Al Hayek S, Doumit J. The Fluoride Debate: The Pros and Cons of Fluoridation. Preventive Nutrition and Food Science 2018;23(3):171180.
- APHA. Standard Methods for the Examination of Water and Wastewater. 22 nd Edition ed. Washington: American Public Health Association 2012.
- BIS IS. 10500. Amendment no. 1, June 2015, to Indian Standard, Drinking Water -Specification, (Second Revision). New Delhi: Bureau of Indian Standards 2012.
- Geological Survey of India. District Resource Map, Bhopal: Geological Survey of India (GSI) 2002.
- Jinwal A, Dixit S. An Assessment of Fluoride Concentrations in different districts of Madhya Pradesh, India. International Journal of Chemical Sciences 2009;7(1):147-154.
- Khatarkar SK, Tiwari DR. Contamination of fluoride in ground water in and around Sehore city (M.P.) with special reference to human health. Oriental Journal of Chemistry 2009;25(1):181-186.
- Singh SC, Singh P. Ground Water Information Booklet, Sehore District, Madhya Pradesh, Bhopal: Ministry of Water Resources, Central Ground Water Board, North Central Region 2013.
- Singh SC, Singh RN. Ground Water Information Booklet, Sehore District, Madhya Pradesh, Bhopal: Ministry of Water Resources, Central Ground Water Board, North Central Region 2007.