
Research article · 2020 · Full text
International Journal of Geography Geology and EnvironmentStudy of linear aspects of morphometric parameters in parts of TAPI river basin, Madhya Pradesh, India using remote sensing and GIS perspective
Volume 2(2) · Pages 131–135
Research areasGroundwater and Watershed AnalysisSouth Asian Studies and Conflicts
Abstract
Author-writtenRemote Sensing technique is a method for basin study as the satellite images provide a synoptic view over a large area. Digital Elevation Model (DEM) in the field of GIS provides the three-dimension assessment of the earth surface. Morphometric analysis provides a quantitative description of drainage system. Morphometric analysis such as linear aspects in part of Tapi river basin covering Madhya Pradesh and some part of Maharashtra was carried out by using geoprocessing techniques. These techniques were used for extraction of river basin and its drainage network. Carto DEM data and ArcGIS software were used for the extraction of drainage and the Morphometric parameters and classified based on the formula suggested by Strahler (1964) [19]. The analysis of linear aspects of drainage basin reveals that the basin has mostly dendritic to sub dendritic drainage pattern with 7th order stream while 1st order streams are mostly controlling the basin. The Carto DEM was utilized to automatically identify and extract drainage network. Five types of drainage patterns were identified: dendritic, parallel, rectangular, trellis, and modified dendritic/trellis. Study conclude that remote sensing data (Carto DEM of 30 m spatial resolution) along with geoprocessing techniques proven to be a tool used for morphometric analysis and evolution of linear aspects of morphometric parameters. Bifurcation ratio of basin (1.54 to 5.32) showing that geologic structures moderately controlled the drainage pattern. Length of overland flow of the basin (0.209 Km) usually low and indicates that basin is showing high relief and slope.
Summary
Source-checkedPlain-language reading of the full paper, prepared with AI and checked against the text. Each point links to the authors' own words.
Why it matters
- Morphometric analysis is used to provide a quantitative description of a drainage system. View evidence ↗
- Analyzing the morphometry of a drainage basin helps researchers understand its geo-hydrological behavior and the influence of climate, geology, and structural history. View evidence ↗
- Remote sensing and GIS techniques are increasingly used to interpret terrain and assess morphometric parameters of drainage basins. View evidence ↗
The question
- The study aims to analyze the linear morphometric attributes of the Tapi drainage basin using geospatial technology. View evidence ↗
What they did
- The study area consists of parts of the Tapi river basin covering districts in Madhya Pradesh (Khandwa, Khargone, and Burhanpur) and Maharashtra (Amravati, Buldhna, and Jalgaon). View evidence ↗
- Researchers used Carto DEM data with a 30 m spatial resolution from the Bhuvan Earth geoportal to delineate the basin and extract the stream network. View evidence ↗
- Stream ordering was performed using geoprocessing models based on Strahler's method. View evidence ↗
- Linear morphometric parameters, including stream order, length, mean length, bifurcation ratios, and overland flow length, were estimated using specific mathematical formulas. View evidence ↗
What they found
- The study area is classified as a 7th order drainage basin. View evidence ↗
- A total of 24,683 streams were identified within the study area. View evidence ↗
- Total stream length is highest for first-order streams and generally decreases as order increases, although the 7th order streams are longer than the 6th order streams. View evidence ↗
- Bifurcation ratios range from 1.5 to 5.3 with a mean of 2.379, suggesting some variation in basin geometry and structural control. View evidence ↗
- The highest bifurcation ratio (5.325) occurs between the 5th and 6th orders, indicating high slope and less permeable rock in hilly terrain. View evidence ↗
- The length of overland flow is 0.209 km, a low value that indicates the basin has high relief and slope. View evidence ↗
- The drainage basin primarily exhibits a dendritic to sub-dendritic drainage pattern. View evidence ↗
What it means
- The authors conclude that GIS techniques are highly useful tools for the geomorphometric analysis of drainage basins in geo-hydrological studies. View evidence ↗
- The authors state that these types of morphometric studies are valuable for the planning and management of drainage basins. View evidence ↗
Visual summary
2 visualsIllustrations explain the paper; charts are replotted from the paper's own table values.
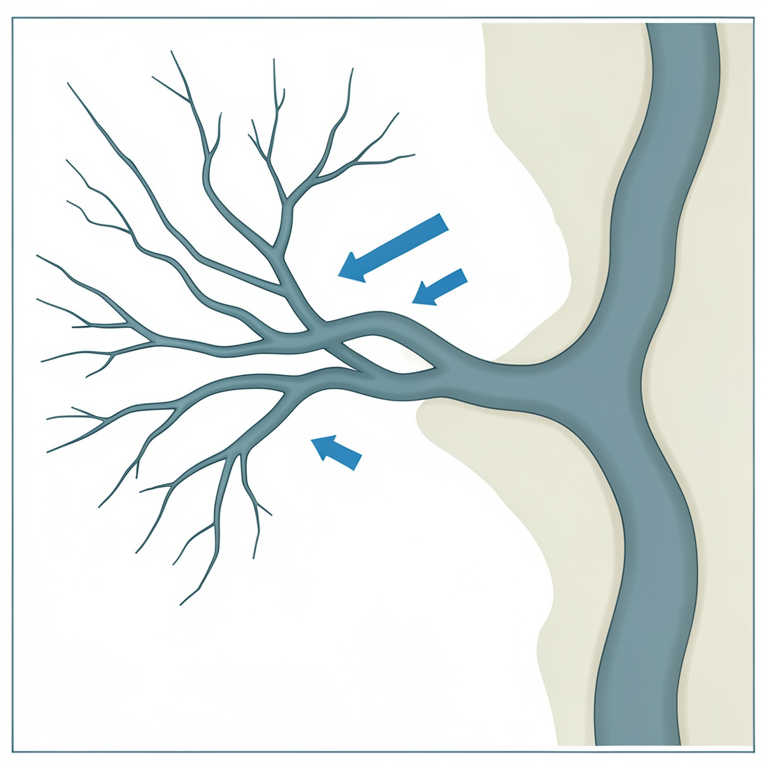
Stream Ordering Concept
AI-generated conceptual illustration (A river basin drainage network in the Tapi river basin, Madhya Pradesh, India). It explains the idea and does not show study data.
View source evidence ↗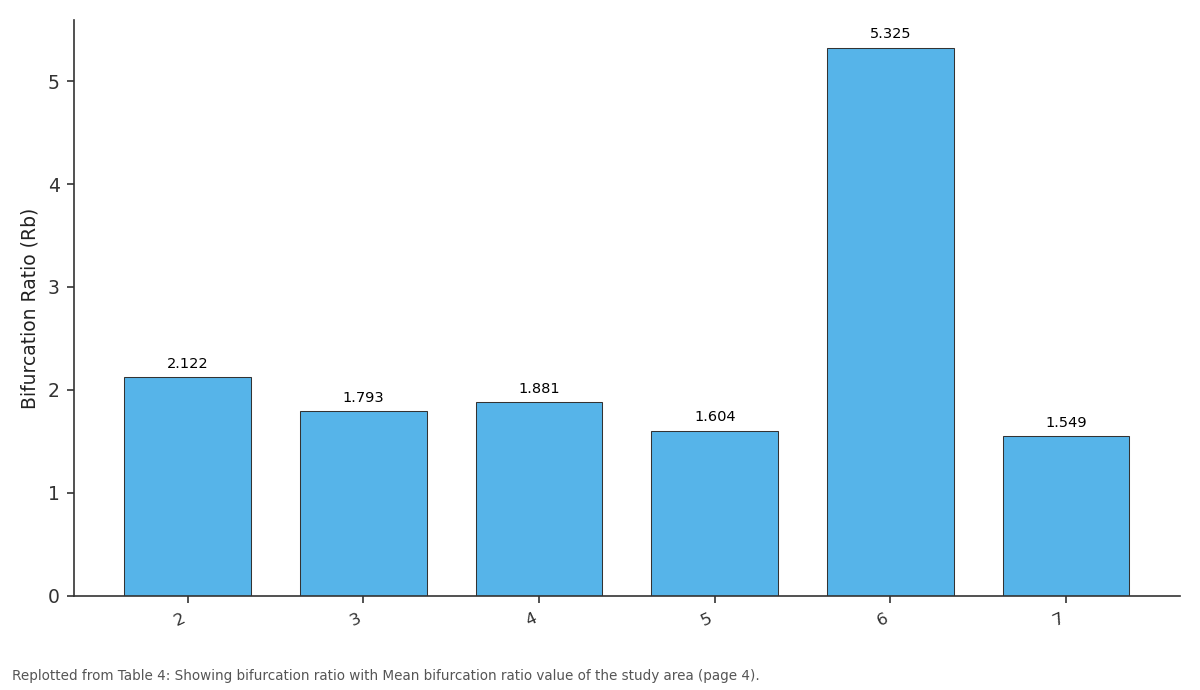
Bifurcation Ratio (Rb): 2 vs 3 vs 4 vs 5 vs 6
Replotted from Table 4 (page 4) of the original paper. Every bar is the paper's own table value.
View source evidence ↗Figures & tables
From the original paper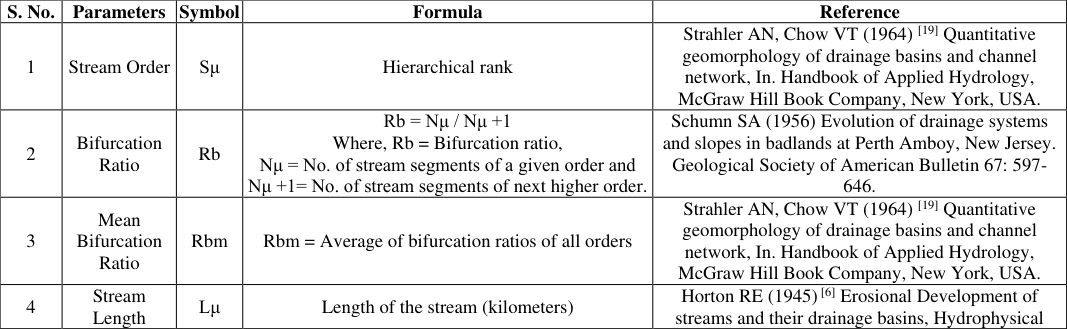 Table 1
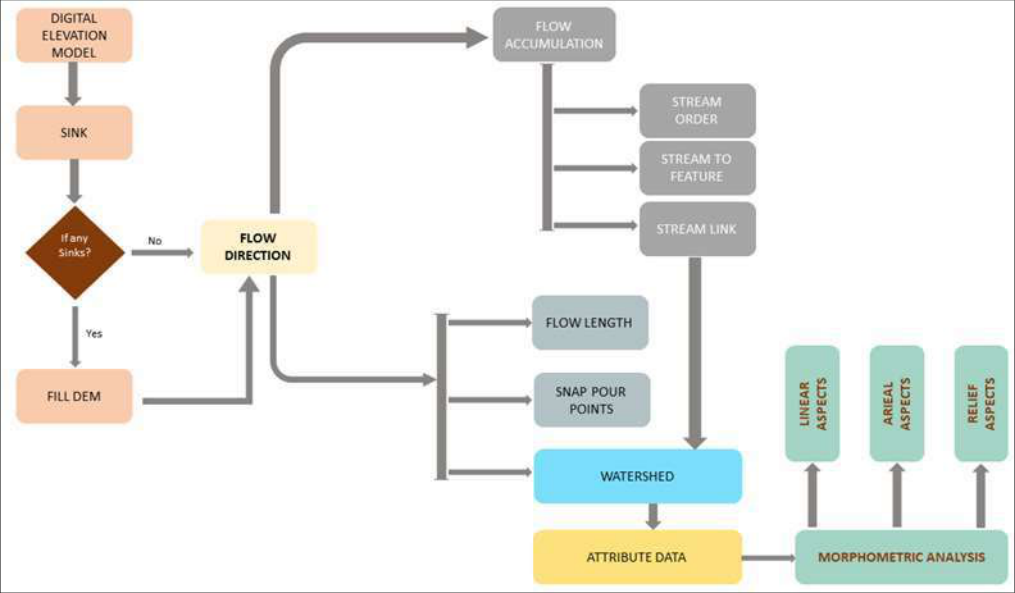 Figure 1
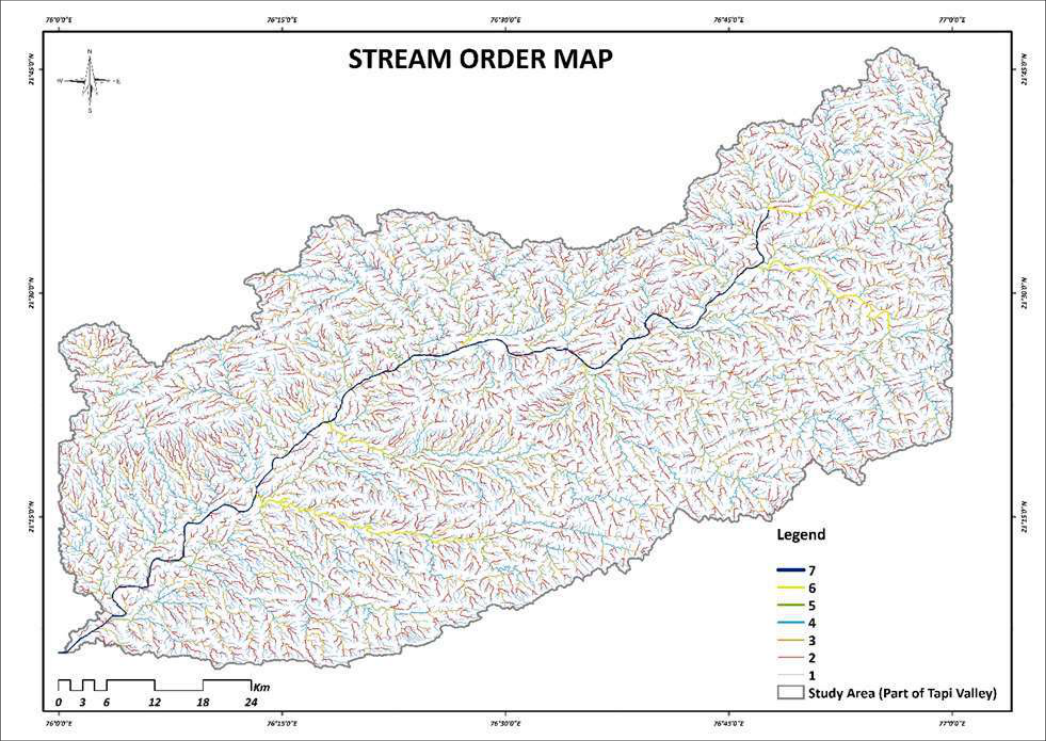 Figure 2
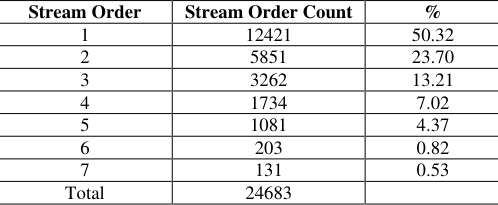 Table 2
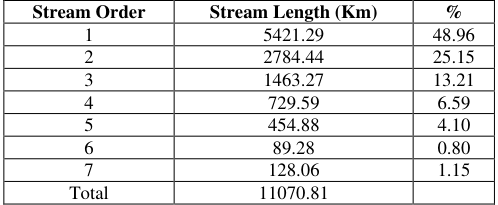 Table 3
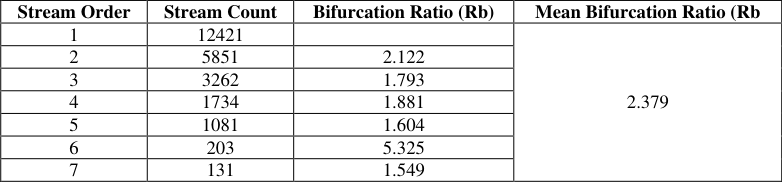 Table 4
Introduction
The study of the geometry of the basin and the way in which it changes in response to processes has become a major part of modern geomorphology. Morphometric analysis of a drainage basin is a quantitative description of a basin and an important aspect to know the character of the basin Strahler (1964) [19] . The term 'morphometry' signifies the meaning of 'measurement of form' derived from morpho (form) and metry measurement Sen (1993) [16] . The morphometric analysis includes linear, relief, aerial and gradient of channel network and slope of the basin Nag and Chakraborty S (2003) [12] , Magesh et al. Several scholars have identified drainage basin and its relationship with climate, relief, structure of the basin Strahler (1964) [19] , Miller (1953) [10] , Nag (1998) [11] . The morphometric analysis of the drainage basin and channel network play an important role in understanding the geohydrological behavior of drainage basin and expresses the prevailing climate, geology, geomorphology, structural antecedents of the catchment. The relationship among various drainage parameters and the aforesaid factors are well recognized by many workers Horton (1945) [6] , Strahler (1957) [18] , Pakhmode et al. (2003) [14] , Gangalakunta et al. (2004) [4] , Chandrasekar and Magesh (2014) [2] . The DEM is used assuming that the water will flow from higher to lower elevation using steepest descent, will produce a stream extraction model with a thematic layer of aspect, slope, relief, and drainage density, stream frequency Chandrasekar and Magesh (2014) [2] . In recent years, remote-sensing data and Geographical Information System (GIS) techniques have increasingly been used for the interpretation of objects, assessing various terrain and morphometric parameters of the drainage basins as it provides an environment for the manipulation and analysis of spatial information in various applications of geology. The objective of this study is to analyses the linear morphometric attributes of Tapi drainage basin by using geospatial technology.
This study attempted to use the morphometric technique by using geo spatial technology to give an insight of the different geo-hydrological and geo-structural characteristics of the drainage basin to help in the morphotectonic study of the drainage basin.
Study Area
The Tapi River lies between Godavari and Narmada River in central India. It originates from Multai of Betul district of Madhya Pradesh. The study area (i.e. part of Tapti river basin) located within the toposheets 55C/3, 55C/4, 55C/7, 55C/8, 55C/10, 55C/11, 55C/14 & 55C/15. Covering the parts of Khandwa, Khargone & Burhanpur districts in Madhya Pradesh and some parts of Amravati, Buldhna & Jalgaon in Maharashtra.
Methodology
Present study carried out by collecting the data from various sources. Data collected from the following sources i.e. SOI toposheets No. 55C/3, 55C/4, 55C/7, 55C/8, 55C/10, 55C/11, 55C/14 & 55C/15 were georeferenced/geo-rectified and mosaiced in GIS environment by using GIS software on 1:50,000 scale. These topographic maps were used to delineate/validate the Tapi River basin. Basin extracted from Carto DEM images in GIS environment by using geoprocessing tools assigning UTM 43N Projection System. As, morphometric analysis of a drainage basin requires the delineation of all the existing streams, extraction of the streams was carried out for morphometric analysis in GIS environment using geoprocessing tools in GIS software. Carto DEM data on 30 m spatial resolution downloaded from the Bhuvan Earth geoportal and used to delineate the river basin and extract the stream network Law of Strahler's method for stream ordering were adopted for ordering the streams using geoprocessing models. Process workflow showing in Figure 1 for extraction of the streams by using geoprocessing models in GIS environment. The stream order, stream length, mean stream length, bifurcation ratios, length of overland flow and elongation ratio were estimated using the mathematical formula given in Table 1 with the Carto DEM satellite images. Strahler AN, Chow VT (1964) [19] Horton RE (1945) [6] Erosional Development of streams and their drainage basins, Hydrophysical approach to quantitative morphology. Geological Society of American Bulletin 56: 275-370.
Mean Stream Length Lsm
Lsm = Lμ/Nμ Where, Lμ = Total stream length of order 'μ' Nμ = Total no. of stream segments of order 'μ' Strahler AN, Chow VT (1964) [19] Quantitative geomorphology of drainage basins and channel network, In. Handbook of Applied Hydrology, McGraw Hill Book Company, New York, USA.
6
Stream Length Ratio RL RL= Lsm / Lsm-1 Where, Lsm=Mean stream length of a given order and Lsm-1= Mean stream length of next lower order Horton RE (1945) [6] Erosional Development of streams and their drainage basins, Hydrophysical approach to quantitative morphology. Geological Society of American Bulletin 56: 275-370.
7
Length of Overland Flow Lg Lg=1/2D Km Where, D=Drainage density (Km/Km2) Horton RE (1945) [6] Erosional Development of streams and their drainage basins, Hydrophysical approach to quantitative morphology. Geological Society of American Bulletin 56: 275-370.
Geomorphometric parameters of the tapi river basin
Linerar aspects of morphometry Stream order (u): Stream order is defined as a measure of the position of a stream in the hierarchy of tributaries Leopold et al. (1964) [8] . Assigning the stream order is the first step in basin analysis. The primary step in drainage basin analysis is to designate stream orders Horton (1945) [6] . As per the Strahler's (1964) [19] ordering method, study area is a 7 th order drainage basin as shown in Figure 2.
Order and size of the tributary basin is mainly dependent to physiographic and structural conditions in the study area.
Study area basin develops over the moderate to highly dissected Decan Trap basalt rock thereby the number and order of streams are high. Increase stream order is associated with more discharge. The main stream, Tapi, by which all discharge and sediment passes is therefore the stream segment of highest order. Stream number: The count of stream channels in a given order is known as stream number Horton (1945) [6] . The number of streams of different orders and its total counted with the help of GIS software. A total number of streams in the study area are 24683. The Moderate to highly dissected underlying Decan Trap basalt rock favor many streams.
Numbers of streams are anti propositional with the order of the streams and thereby it can be said that the basin is developed over homogeneous rock materials. Similarly, in the study area basin, the first order of the streams is associated with the highest number of streams and viceversa as shown in Table 2. Stream length (Lu): Stream length calculated based on the law proposed by Horton (1945) [6] . Stream length reveling chronological stream segments changes with tectonic disturbances interval. In the study, results show that total length of stream segments is maximum for first order streams and reduces with the increment of stream order except the 7 th order stream total length is more than the total length of the 6 th order stream segments as shown in Table 3.
| Stream Order | Stream Length (Km) | % |
|---|---|---|
| 1 | 5421.29 | 48.96 |
| 2 | 2784.44 | 25.15 |
| 3 | 1463.27 | 13.21 |
| 4 | 729.59 | 6.59 |
| 5 | 454.88 | 4.10 |
| 6 | 89.28 | 0.80 |
| 7 | 128.06 | 1.15 |
| Total | 11070.81 |
Table text extracted from the original PDF; superscript letters are shown inline. The original table image is below.
View original table image
| Stream Order | Stream Order Count | % |
|---|---|---|
| 1 | 12421 | 50.32 |
| 2 | 5851 | 23.70 |
| 3 | 3262 | 13.21 |
| 4 | 1734 | 7.02 |
| 5 | 1081 | 4.37 |
| 6 | 203 | 0.82 |
| 7 | 131 | 0.53 |
| Total | 24683 |
Table text extracted from the original PDF; superscript letters are shown inline. The original table image is below.
View original table image
Study shows that stream segments up to 4th order passes through the parts of high to moderate altitude zones and steep to moderate slopes areas while the 6 th and 7 th order stream segments passes through relatively in low altitude and gentle slope areas. Mean stream length (Lsm): Mean stream length is the total stream length is divided by the total number of segments in while total length of stream calculated using GIS tools. There is the relationship between mean stream length and basin order, i.e., mean stream length increases with successive increasing orders. It is related to the size of the drainage network Strahler (1964) [19] . Mean Stream Length of the study area basin is 0.5171 kms and is quite moderate.
Bifurcation ratio (Rb):
The Bifurcation ratio may be defined as the ratio between the numbers of stream segments of any given order to the number the next higher order Singh (1971) [17] . The bifurcation ratio ranges in between 1.5 to 5.3. The high value of the ratio indicates a lower degree of drainage integration and vice-versa. The irregularities of bifurcation ratio depend on the lithological development of the drainage basin. The lower value of the bifurcation ratio reveals that the basin has suffered less structural disturbances and the higher values of the bifurcation ratio indicate strong structural control on the drainage pattern Agarwal (1998) [1] . The High bifurcation ratio shows significant variations in the number of stream segments of lower and higher order that represents the occurrence of relatively juvenile and mature topography [Chorley RJ (1969] [3] . Bifurcation ratio having value >10 indicates the drainage basin developed over the easily erodible rocks Ozdemir and Bird (2009) [13] . The bifurcation ratio values for the study area basin ranges from 1.5 to 5.3 (Table 4), showing possibility of variations in basin geometry and structural control but tend to be constant throughout the series with the mean bifurcation ratio of 2.379. The highest Rb (5.325) is found between 5 th and 6 th order that indicates maximum overland flow and discharge in less permeable rock hilly terrain with high slope of the terrain that indicates the basin developed under the influences of underlying structures and lithology. Length of overland flow (Lg): Length of overland flow is one of the most important independent variables affecting both hydrologic and physiographic development of drainage basins Horton (1932) [5] . Overland flow is significantly affected by infiltration/percolation through the soil that vary in time and space Schmid (1997) [15] , Kanth and Hassan (2012) [7] . Higher value of Lg represents low relief and whereas a low value of Lg is an indicative of high relief.
| Stream Order | Stream Count | Bifurcation Ratio (Rb) | Mean Bifurcation Ratio (Rb |
|---|---|---|---|
| 1 | 12421 | 2.379 | |
| 2 | 5851 | 2.122 | |
| 3 | 3262 | 1.793 | |
| 4 | 1734 | 1.881 | |
| 5 | 1081 | 1.604 | |
| 6 | 203 | 5.325 | |
| 7 | 131 | 1.549 |
Table text extracted from the original PDF; superscript letters are shown inline. The original table image is below.
View original table image
The length of the overland flow of study area basin is 0.209 Km which is usually low and indicates that basin is showing high relief and slope.
Conclusion
Conclusion
References
19 in the original paper- Agarwal CS. Study of drainage pattern through aerial data in Naugarh area of Varanasi district U.P. Journal of the Indian Society of Remote Sensing 1998;26:169175.
- Chandrasekar N, Magesh. GIS model-based morphometric evaluation of Tamiraparani sub basin Tirunelveli, India. Arab Journal Geo science 2014;7:131-141.
- Chorley RJ. Introduction to Physical Hydrology. Suffolk, Methuen and Co. Ltd 1969.
- Gangalakunta P, Amal K, Kothiram S. Drainage morphometry and its influence on landform characteristics in a basaltic terrain, Central India: A remote sensing and GIS approach. Int J Appl Earth and Geoinformatic 2004;6:1-16.
- Horton RE. Drainage basin characteristics. American Geophysical Union of Transactions 1932;13:350-361.
- Horton RE. Erosional development of streams and their drainage basins; Hydrophysical approach to quantitative morphology. Geological society of America bulletin 1945;55:275-370.
- Kanth TA, Hassan ZU. Morphometric Analysis and Prioritization of Watersheds for Soil and Water Resource Management in Wular Catchment Using GeoSpatial Tools. International Journal of Geology, Earth and Environmental Sciences 2012;2:30-41.
- Leopold LB, Wolman MG, Miller JP. Fluvial Processes in Geomorphology New York: Dover Publication Magesh 1964.
- Magesh NS, Jitheshlal KV, Chandrasekar N, Jini KV. GIS based morphometric evaluation of Chimmini and Mupily watersheds parts of Western Ghats Thrissur, India. Earth Science Informatics 2012;5:111-121.
- Miller JP. A Quantitative geomorphic study of drainage basin characteristics in the Clinch Mountain area Virginia and Tennessee. Technical Report 3 Office of Naval Research, Department of Geology Columbia University 1953.
- Nag SK. Morphometric analysis using remote sensing techniques in the chaka sub-basin Purulia district West Bengal. Journal of the Indian Society of Remote Sensing 1998;26:69-76.
- Nag SK, Chakraborty S. Influence of rock types and structures in the development of drainage network in hard rock area. Journal of the Indian Society of Remote Sensing 2003;31:25-35.
- Ozdemir H, Bird D. Evaluation of morphometric parameters of drainage networks derived from topographic maps and DEM in point of floods. Environmental Geology 2009;56:1405-1415.
- Pakhmode V, Kulkarni H, Deolankar SB. Hydrological drainage analysis in watershed programme planning, A case study from the Deccan basalt, India. Hydrogeology Journal 2003;11:595-604.
- Schmid BH. Critical Rainfall Duration for Overland Flow an Infiltrating Plane Surface. Journal of Hydrology 1997;193:45-0.
- Sen PK. Geomorphological analysis of drainage basins Burdwan: The University of Burdwan 1993.
- Singh RL. India: A Regional Geography Varanasi: National geographical Society of India 1971.
- Strahler AN. Quantitative analysis of watershed geomorphology. American Geophysical Union Transactions 1957;38:912-920.
- Strahler AN. Quantitative geomorphology of drainage basins and channel networks In VT Chow Edition. Handbook of Applied Hydrology 1964, 439-476.
Cited by 1
From OpenAlex, OpenCitations and reference lists read by Scinovex
- Riverine flood susceptibility assessment using drainage basin morphometry in the Bahe River ↗
Antonio Chissende, Muhammad Sajid Mehmood, Aidi Huo, Pingping Lou, Zhenhong Wang · International Journal of Disaster Risk Reduction · 2025
❝ 17