
Research article · 2024 · Full text
International Journal of Agriculture Extension and Social DevelopmentAn impact study of MGNREGA in Dimapur District of Nagaland
Volume 7(10) · Pages 97–100 · DOI: 10.33545/26180723.2024.v7.i10b.1210 ↗
Research areasSouth Asian Studies and ConflictsAgricultural Economics and Practices
Abstract
Author-writtenAfter gaining independence in 1947, India faced significant challenges with poverty and unemployment due to rapid population growth. The labor force grows at 2.0% annually, outpacing the 1.6% employment growth rate, necessitating long-term solutions focusing on the labor supply side. Despite a lower unemployment rate, poverty remains severe, with underemployment being a major issue, especially in rural areas where 60% of the population lives. Various national schemes were implemented to combat poverty, but many failed due to resource constraints and lack of planning. The NREGA scheme, later renamed MGNREGA, was introduced in 2005 to address these issues by providing 100 days of paid labor annually to rural households. This study is conducted to access the impact of MGNREGA scheme through income as the main aim of the scheme concentrates on creating an impact through increasing the income generation of the beneficiaries. As a result, it was found that there is a significance difference in the total yearly income of the beneficiaries with a difference of 16.01 per cent. The expenditure on the children per year was also increased by 16.8 per cent and the average budget on food was also increased by 9.6 per cent. It was also observed that the per capita savings of the beneficiaries have increased by 37.23 per cent. The beneficiaries were able to open saving accounts in banks and other schemes with the benefits received from money made through the MGNREGA scheme. The study also showed moderate behavioural change and high social participation. The study also shows the different budget allocation at district and state level. Statistical tools such as Mean, frequency and percentage method, t-test method and Karl’s correlation coefficient were used for the study. Overall, MGNREGA has had a positive impact on income generation among rural households, contributing to poverty alleviation and economic stability.
Summary
Source-checkedPlain-language reading of the full paper, prepared with AI and checked against the text. Each point links to the authors' own words.
Why it matters
- Since independence in 1947, India has struggled with high levels of poverty and unemployment driven by rapid population growth. View evidence ↗
- Underemployment is a critical issue in India, particularly in rural regions where 60% of the population resides. View evidence ↗
- The MGNREGA scheme was designed as a social security tool to alleviate poverty and unemployment and improve living standards for the poor. View evidence ↗
The question
- The study aims to assess the impact of the MGNREGA scheme specifically through its effect on income generation for beneficiaries. View evidence ↗
What they did
- The researchers purposefully selected the Dimapur district of Nagaland for the study due to its high population and number of blocks and villages. View evidence ↗
- The study sample consisted of 100 respondents, with 25 individuals selected from each of the four participating villages. View evidence ↗
- Data analysis was performed using t-tests, Karl's correlation coefficient, and descriptive statistics including mean, frequency, and percentage. View evidence ↗
What they found
- Beneficiaries saw a significant 16.01% increase in average yearly income, rising from 72,000 to 85,720. View evidence ↗
- Annual expenditure on children increased by 16.8% following the increase in income from the scheme. View evidence ↗
- The average budget allocated for food increased significantly by 9.6%. View evidence ↗
- Per capita savings among beneficiaries increased by 37.23%. View evidence ↗
- The study found that social participation among beneficiaries in the study area was high. View evidence ↗
- Behavioral change was observed in all beneficiaries, with 59% showing moderate change and 41% showing high change. View evidence ↗
- Funding for the blocks was distributed as 90% from the central government and 10% from the state government. View evidence ↗
What it means
- The authors conclude that MGNREGA effectively promotes rural development by providing jobs, improving economic stability, and fostering social connections and positive lifestyle changes. View evidence ↗
Visual summary
2 visualsIllustrations explain the paper; charts are replotted from the paper's own table values.
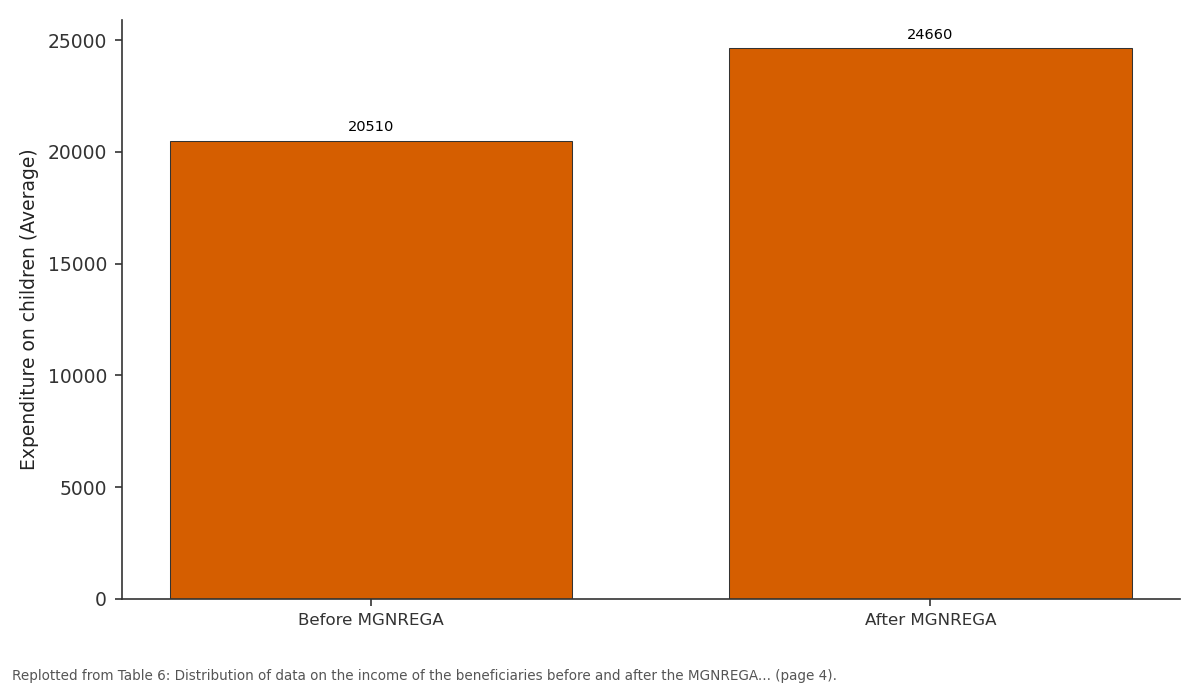
Expenditure on children (Average): Before MGNREGA vs After MGNREGA
Replotted from Table 6 (page 4) of the original paper. Every bar is the paper's own table value.
View source evidence ↗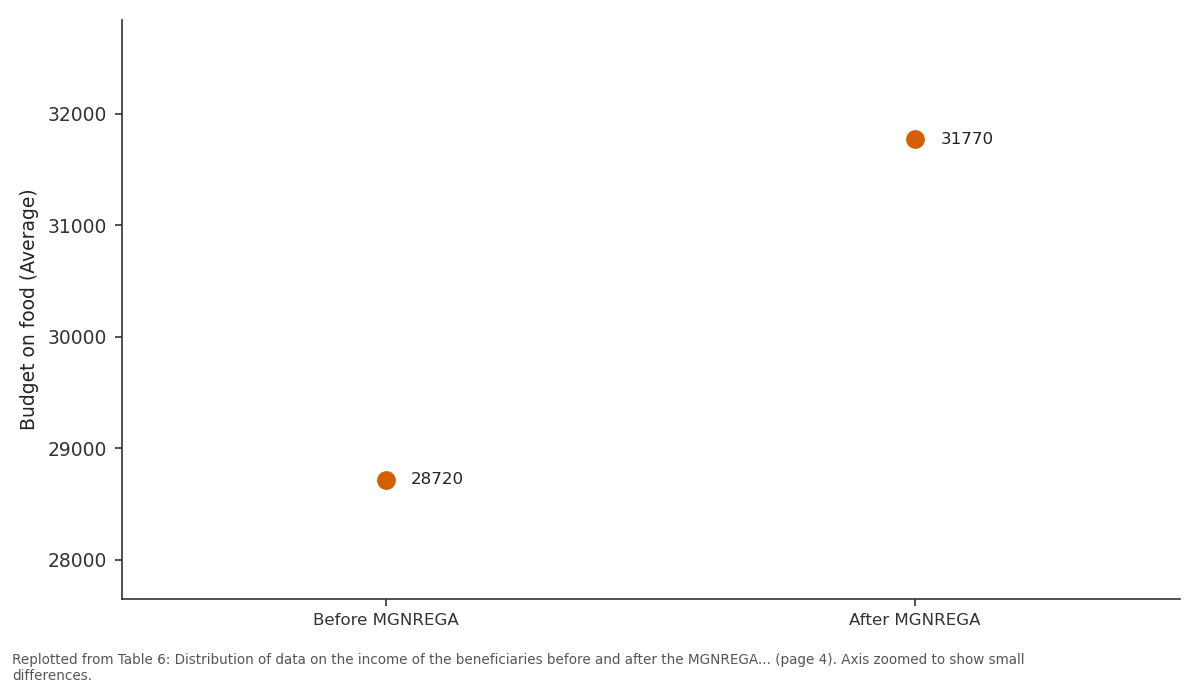
Budget on food (Average): Before MGNREGA vs After MGNREGA
Replotted from Table 6 (page 4) of the original paper. Every bar is the paper's own table value.
View source evidence ↗Figures & tables
From the original paper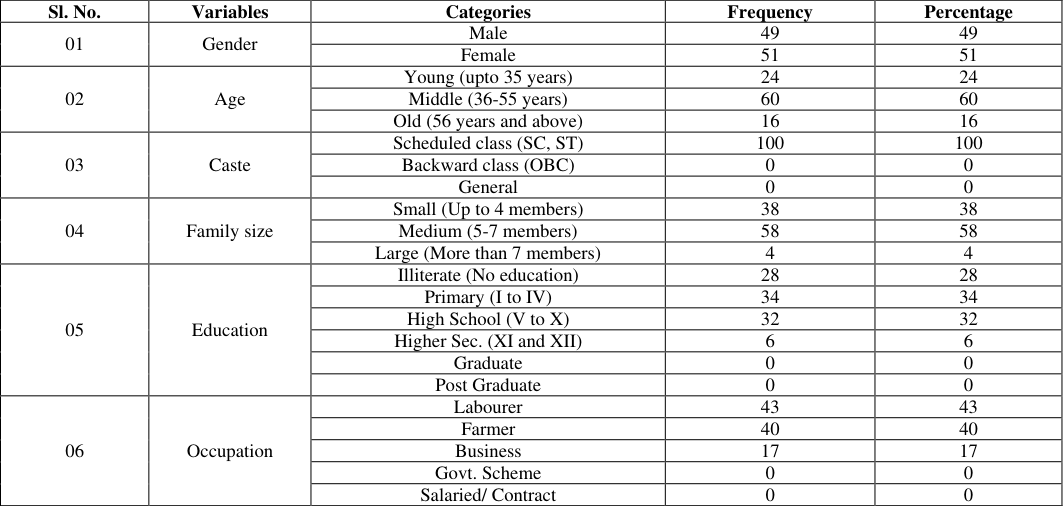 Table 1
 Table 3
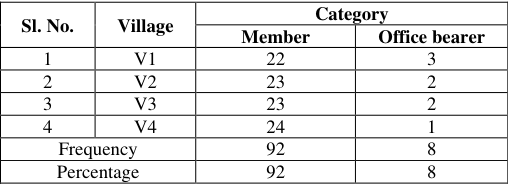 Table 2
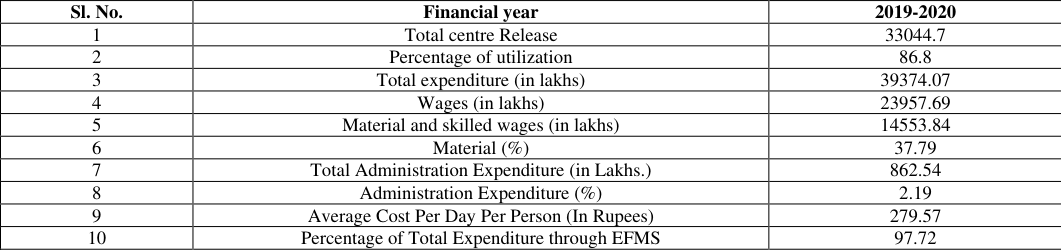 Table 4
 Table 5
 Table 6
Introduction
Following its independence in 1947, India having the largest democracy in the world was presented with two pressing issues: poverty and unemployment (Sinha, 2013) [1] . India's high unemployment rate is a direct result of the country's rapid growth in population. Given that India's labour force is expanding faster by 2.0% than the country's overall employment rate, which is 1.6%, the supply side of the labour force must be the focus of long-term solutions for the unemployment issue (Khan et al., 2012) [2] . The unemployment rate is low compared to the poverty rate which is by far greater. When there is no official social security benefit, most people do not choose to be unemployed. As a result, just 18 to 19% of the unemployed were impoverished in 1993, compared to approximately 33% of those who were employed. This suggests low levels of income and production along with increased rates of underemployment. Consequently, underemployment poses a significant problem in the country (Sinha, 2013) [1] . Approximately 60% of people in India live in rural areas among which scheduled castes and scheduled tribes experience the greatest levels of poverty. 50% of scheduled tribe members and 40% of scheduled caste members are among India's poorest citizens (Sinha 2013; Tiwari and Pawariya, 2015) [1,3] . Moreover, 70% of its rural household still depend primarily on agriculture for their household income. Therefore, during the lean agriculture season, most of the people remain unemployed (Beniwal, 2023) [4] . As a result, numerous programs and schemes have been implemented in an attempt to abolish poverty and to give rural people livelihood security. Several schemes such as RMP, CSRE, PIREP, MFALS, FWP, NREP and RLEGP) were adopted and implemented on a national scale. To gather job generation, infrastructure pattern and meals safety in the rural areas, the government built-in NREP and RLEP into a brand-new scheme the Jawahar Rojgar Yojana (JRY) in the year 1989. Later on 1 st April 1999, the JRY was renamed to Jawahar Gram Samridhi Yojana (JGSY) with a similar objective. In 2001, it was merged with SGRY. Even after the implementation of these schemes and efforts were made by the Government, still, a very large number of the population were not engaging themselves in rural development activities. These programmes were proved to be a failure mainly due to lack of sufficient available resources and many constraints like lack of planned approach and confinement to mere subsidy providing programmes. On August 2005, the NREGA scheme was passed in India which was first suggested and www.extensionjournal.com conceptualised by the then Prime Minister P.V Narasimha Rao in 1991 and finally it was enacted in September 2005. It was later renamed by the Government of India as MGNREGA (Mahatma Gandhi National Rural Employment Guarantee Act) on 2 nd October 2009. NREGA is a social security tool which was implemented to tackle the problem of poverty and unemployment in India thereby improving the standard of living of the poorer section of the society in the country. The program was implemented with the primary goals of promoting the development of the rural economy, empowering women, ensuring the social safety of vulnerable populations, and elevating people's socioeconomic standing by giving every registered household's unskilled adult member 100 days of paid labour in the financial year (Bishnoi et al., 2012; Biswas et al., 2024) [5,6]. MGNREGA scheme was implemented in 625 districts of India. On 2 nd February 2006, the first phase of the scheme was introduced in 200 backward districts. An addition of 130 rural districts was extended to the first phase from 2007-08 and the remaining districts were implemented from 1 April 2008 (Reddy et al., 2014) [7] .
MGNREGA in Nagaland
After the implementation of the MGNREGA scheme in India, the first phase consisted of 200 backward districts on 2 nd February 2006. Among the selected backward districts on the 1 st phase, the Mon district of Nagaland was also selected because of the very low employment rate of 57.26% as per 2001 census. A survey was also conducted to regulate district domestic products. The result of the survey quantifies that the per capita income of Nagaland state was Rs 11,119, where Mon district had the least of Rs. 4,500 (As per 2001 census) [8] . Mon district was also ranked as the least for literacy with a rate of 42.25%. Hence, Mon district was selected by the Government of India among the 200 backward districts on the first phase. According to the census of 2001, Nagaland with a population of 19.81 constituted 0.19% of the country's total population. Out of which 71.14% were from rural areas having a literacy rate of 67.11% and 36.82% of rural area population of Nagaland were living below the poverty line. Also, Nagaland had registered a rise of over 12% in poverty. Hence in the subsequent years, MGNREGA was declared in all the districts of Nagaland under Phase-II (in 2007) and Phase -III (in 2008) by the government. With a population of 3,78,811 out of which 47.77% is from rural areas and 52.23% is from an urban area (2011 census) and a literacy rate of 78.15% and also with 2,06,122 number of nonworking individuals, Dimapur district of Nagaland was included in the Phase-III of MGNREGA in 2008. Objectives 1. To examine the socio-economic status of MGNREGA beneficiaries of the selected area 2. To find out social participation and budget allocation of MGNREGA and 3. To evaluate the behavioural change and income impact of MGNREGA on the respondents.
Methodology
The Study was conducted in the state of Nagaland. Nagaland has 11 districts and out of them, Dimapur district of Nagaland was purposefully selected for the study as it has the highest number of population with highest number of blocks and villages. Also, The district of Dimapur has 6 blocks. Out of 6 blocks, Chumukedima and Medziphema block was selected for the study. From Chumukedima block, Chumukedima village and Unity village were selected and from Medziphema block, Khaibung and Seithekiema C villages were selected for the study. 25 respondents were selected from each village. Thus, a total of 100 respondents were selected for the research study. Welldeveloped scheduled was made for the collection of data from the respondents. Secondary data was taken from government officials of the study area and main web site. The collected data were analysed using mean, frequency and percentage method, t-test method and Karl's correlation coefficient.
Results and Discussion
Results and Discussion
Extend of participation
The beneficiaries were analysed with regards to the extent of participation in different social organizations/ programmes held in the study area. According to the number of participation by the respondents in organizations/programmes, the data was analysed and categorised as given in table 3. The above table reveals that social participation was high in the study area. Participation of the beneficiaries in various organizations/programmes held in the study area was influenced by their participation in the MGNREGA scheme. Due to the success of the programme, it was observed that this has encouraged the beneficiaries to participate in other programmes as well.
| Sl. No. | Participation | Frequency | Percentage |
|---|---|---|---|
| 1 | Low | 5 | 5 |
| 2 | Moderate | 29 | 29 |
| 3 | High | 66 | 66 |
Table text extracted from the original PDF; superscript letters are shown inline. The original table image is below.
View original table image
Budget
The information regarding the budget of the MGNREGA was taken from secondary sources, viz., nrega.nic.in and block development officers in the district level. The budget of the MGNREGA scheme as allocated by the central to the state is given in table 10 which shows the distribution of the budget for the financial year 2019-20.
Budget allocation at the district level
• It was recorded that the total fund allocation to the different blocks was 90% from the centre and 10% from the state. • The fund allocation for Chumukedima block was 50 lakhs and Medziphema was 3.5 lakhs for the year 2019-2020. • Out of the total fund, it was noted that 60 per cent of the fund allocation was for the payment of wages to the MGNREGA workers and the rest 40 per cent was spent on the purchase of the materials for the MGNREGA works.
Behavioural change
The participation in the MGNREGA scheme by the beneficiaries can positively influence the people to have changes in their behaviour and instil in them the willingness to have a change. Table 5 shows that the beneficiaries showed a moderate change in behaviour (59.00 per cent) while the rest of 41.00 per cent showed high behavioural change. The study also indicated that there were no beneficiaries who showed low behavioural change. This indicates that the implementation of the scheme has made a difference in the behaviour of the beneficiaries and brought about changes in the lifestyle of the family as a whole. The earnings through the MGNREGA scheme has paved way for improving the standard of living of the individual and has impacted in such a way that the changes in the behaviour have taken place www.extensionjournal.com towards different aspects like maintaining a budget, maintaining proper hygiene, creating an interest in participation in other governmental programmes, etc.
| Sl. No. | Performance | Frequency | Percentage |
|---|---|---|---|
| 1 | Low | 0 | 0 |
| 2 | Moderate | 59 | 59 |
| 3 | High | 41 | 41 |
Table text extracted from the original PDF; superscript letters are shown inline. The original table image is below.
View original table image
Impact of MGNREGA Changes in the income of the beneficiaries
The impact of the MGNREGA scheme revolves around several factors. However, the main aim of the scheme concentrates on creating an impact through increasing the income generation of the beneficiaries. Therefore, the data of the income generation through the MGNREGA scheme and the observation on the changes in other aspects of the income have been analysed and displayed in the table below. The data from table 6 shows the average data of the yearly income of the respondents before and after MGNREGA for the year 2019-2020. It is evident from table 6 that there is a significance difference in the total yearly income of the beneficiaries with a difference of 16.01 per cent. It was shown that the average yearly income was 72000 before MGNREGA and 85720 after MGNREGA. The change in the income also influenced expenditure on children, budget on food and also the per capita savings of the beneficiaries' households. The expenditure on the children per year was also increased by 16.8 per cent with the increase in the income of the beneficiaries. This is evident from table 6 which shows that there is a significant difference (shown by p-value in table 6). Similarly, the average budget on food was also increased by 9.6 per cent and shows a significance difference (Evident through p-value). It was also observed that the per capita savings of the beneficiaries have increased by 37.23 per cent. The beneficiaries were able to open saving accounts in banks and other schemes with the benefits received from money made through the MGNREGA scheme.
Conclusion
In conclusion, the study of the Mahatma Gandhi National Rural Employment Guarantee Act (MGNREGA) shows how much it helps people engage in their communities and improve their lives. Many beneficiaries are actively involved in social groups, which has created a strong sense of community and empowerment. The funding for the program has been used effectively, with a large part going towards wages, leading to an increase in the income of those involved. This boost in earnings has allowed them to spend more on important things like food and education for their children, showing better financial management and improved living conditions. Additionally, savings have increased, indicating greater financial stability. Overall, MGNREGA not only provides essential job opportunities but also encourages positive changes in behaviour and lifestyles, making a real difference in rural development by enhancing both economic stability and social connections.
Figures and tables from the paper
| Sl. No. | Variables | Categories | Frequency | Percentage |
|---|---|---|---|---|
| 01 | Gender | Male | 49 | 49 |
| Female | 51 | 51 | ||
| 02 | Age | Young (upto 35 years) | 24 | 24 |
| Middle (36-55 years) | 60 | 60 | ||
| Old (56 years and above) | 16 | 16 | ||
| 03 | Caste | Scheduled class (SC, ST) | 100 | 100 |
| Backward class (OBC) | 0 | 0 | ||
| General | 0 | 0 | ||
| 04 | Family size | Small (Up to 4 members) | 38 | 38 |
| Medium (5-7 members) | 58 | 58 | ||
| Large (More than 7 members) | 4 | 4 | ||
| 05 | Education | Illiterate (No education) | 28 | 28 |
| Primary (I to IV) | 34 | 34 | ||
| High School (V to X) | 32 | 32 | ||
| Higher Sec. (XI and XII) | 6 | 6 | ||
| Graduate | 0 | 0 | ||
| Post Graduate | 0 | 0 | ||
| 06 | Occupation | Labourer | 43 | 43 |
| Farmer | 40 | 40 | ||
| Business | 17 | 17 | ||
| Govt. Scheme | 0 | 0 | ||
| Salaried/ Contract | 0 | 0 |
Table text extracted from the original PDF; superscript letters are shown inline. The original table image is below.
View original table image
| Sl. No. | Financial year | 2019-2020 |
|---|---|---|
| 1 | Total centre Release | 33044.7 |
| 2 | Percentage of utilization | 86.8 |
| 3 | Total expenditure (in lakhs) | 39374.07 |
| 4 | Wages (in lakhs) | 23957.69 |
| 5 | Material and skilled wages (in lakhs) | 14553.84 |
| 6 | Material (%) | 37.79 |
| 7 | Total Administration Expenditure (in Lakhs.) | 862.54 |
| 8 | Administration Expenditure (%) | 2.19 |
| 9 | Average Cost Per Day Per Person (In Rupees) | 279.57 |
| 10 | Percentage of Total Expenditure through EFMS | 97.72 |
Table text extracted from the original PDF; superscript letters are shown inline. The original table image is below.
View original table image
References
7 in the original paper- Sinha P. Combating youth unemployment in India. https://library.fes.de/pdf-files/iez/09728.pdf. Visted on 2 June, 2024.
- Khan JH, Shamshad, Hassan T. Unemployment and Levels of Socio-Economic Deprivation in India: A Regional Perspective. British Journal of Humanities and Social Sciences. 2012;3(2):126-140.
- Tiwari U, Pawariya V. Poverty Alleviation and Unemployment Scenario in India. International Journal of Research. 2015;2(1):208-224.
- Beniwal V. Weak rural labour marker pushes India's unemployment rate above 8%. https://www.businessstandard.com/economy/news/weak-rural-labourmarket-pushes-india-s-unemployment-rate-above-8123070300234_1.html. Visted on 19 June, 2024
- Bishnoi I, Verma S, Rai S. MNREGA: An Initiative towards Poverty Alleviation through Employment Generation. Indian Research Journal of Extension Education. 2021;1:169-173.
- Biswas A, Roy C, Sati VP, Kumar S. The role of Mahatma Gandhi National Rural Employment Guarantee Act on women empowerment in selected districts of West Bengal, India. SN Social Sciences 2023; https://doi.org/10.1007/s43545-024-00857-1.
- Reddy DN, Reddy AA, Bantilan MCS. The Impact of Mahatma Gandhi National Rural Employment Guarantee Act (MGNREGA) on Rural Labor Markets and Agriculture. Indian Review. 2014;13(3):251-273.
Social participation
The social participation of the beneficiaries indicates the partaking of the MGNREGA beneficiaries either as a member of the different governmental programmes/ organizations/schemes or as an office-bearer in the study area. The data are shown in the above table 2 displays that out of the 100 respondents, 92.00% were members of a social organization or institution, while the rest of the 8.00 per cent of the respondents were found to be office-bearers.
Table text extracted from the original PDF; superscript letters are shown inline. The original table image is below.
View original table image