
Research article · 2019 · Full text
International Journal of Geography Geology and EnvironmentThe variation in distribution of literacy rate in Bihar: An analytical approach
Volume 1(1) · Pages 72–79
Research areasArtificial Intelligence and Decision Support SystemsInnovations in Educational MethodsOnline Learning and Analytics
Abstract
Author-writtenUndoubtedly, education strengthens the ability of the people of all across the region to meet their wants and those of their family by increasing their productivity and their potential to achieve a higher standard of living. By improving people’s confidence and their ability to create and innovate, it multiplies their opportunities for personal and social achievement. Thus, education is viewed as an integral part of societal and national development. This paper is mainly devoted to examine the spatio-temporal, distribution of literacy rate in Bihar. An extensive evaluation of trends and patterns of literacy rate of the state has been enquired minutely. In almost all the important indicators of development, even to this day, the region has been and still remains one of the most educationally deprived sates in India. In the state, however, the literacy rate is rising from 47% in 2001 to 63 in 2011, but, still it has the lowest literacy rate in India. While, as per the latest census estimates (2011), the all India literacy figure has gone up to 74%; About three-fourth of our menfolk (7.58%) half of our womenfolk (54.16%) are literate. More importantly, at district wise, the level of literacy is unevenly distributed. In a nutshell, there is need to improve educational infrastructure including education relevant to societal needs and enhance the management and capacity of educational institutions at the state, district and local levels. Emphasis should also be to promote greater presence of civil society and community participation to enhance enrolment retention and other aspects of education.
Summary
Source-checkedPlain-language reading of the full paper, prepared with AI and checked against the text. Each point links to the authors' own words.
Why it matters
- Education is considered essential for societal and national development because it increases productivity and the potential for a higher standard of living. View evidence ↗
- Bihar is identified as one of the most educationally deprived states in India across most development indicators. View evidence ↗
- The state suffers from a significant mismatch between the demand for and supply of education due to inadequate infrastructure. View evidence ↗
The question
- The primary aim of the study is to examine the spatial and temporal distribution of literacy rates in Bihar. View evidence ↗
- The study seeks to analyze and compare literacy rate trends between India and Bihar starting from 1951. View evidence ↗
What they did
- The research utilized secondary data obtained from the Census of India and official Bihar government websites. View evidence ↗
- Data analysis was performed using simple percentages and visualized through bar diagrams, line graphs, and choropleth maps. View evidence ↗
What they found
- Bihar's literacy rate increased from 47% in 2001 to 63% in 2011, yet it remained the lowest in India. View evidence ↗
- In 1951, the total literacy rate for India was 18.33%, while for Bihar it was 13.49%. View evidence ↗
- In 2011, district-level literacy in Bihar varied significantly, ranging from a low of 51.08% in Purniya to a high of 73.37% in Rohtas. View evidence ↗
- Urban male literacy (77.3%) was substantially higher than rural male literacy (57.2%). View evidence ↗
- A wide gap exists in female literacy, with urban rates at 58.42% compared to 29.57% in rural areas. View evidence ↗
- Female literacy is lower than male literacy and varies by district, from 18.6% in Kishangang to 50.8% in Patna. View evidence ↗
- Child labor is a factor in low education; 2011 census data shows 0.54 million children as main workers and 0.58 million as marginal workers. View evidence ↗
What it means
- The author concludes that there is an urgent need to improve educational infrastructure and management at all administrative levels to meet societal needs. View evidence ↗
- The author attributes the educational gaps in Bihar primarily to poverty, gender, and caste status. View evidence ↗
Visual summary
3 visualsIllustrations explain the paper; charts are replotted from the paper's own table values.
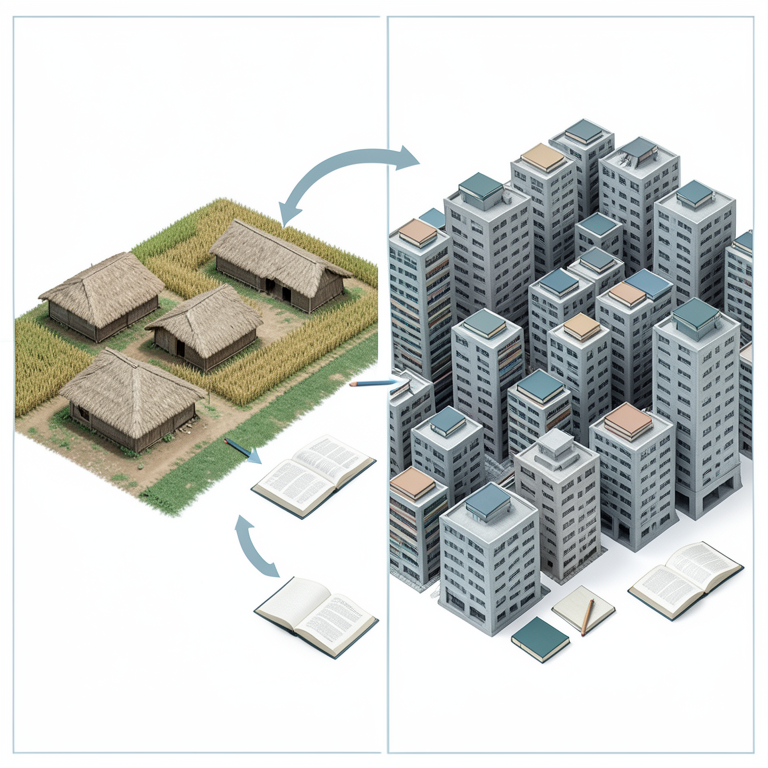
Urban vs Rural Literacy Gap
AI-generated conceptual illustration (Urban and rural landscapes of Bihar, India). It explains the idea and does not show study data.
View source evidence ↗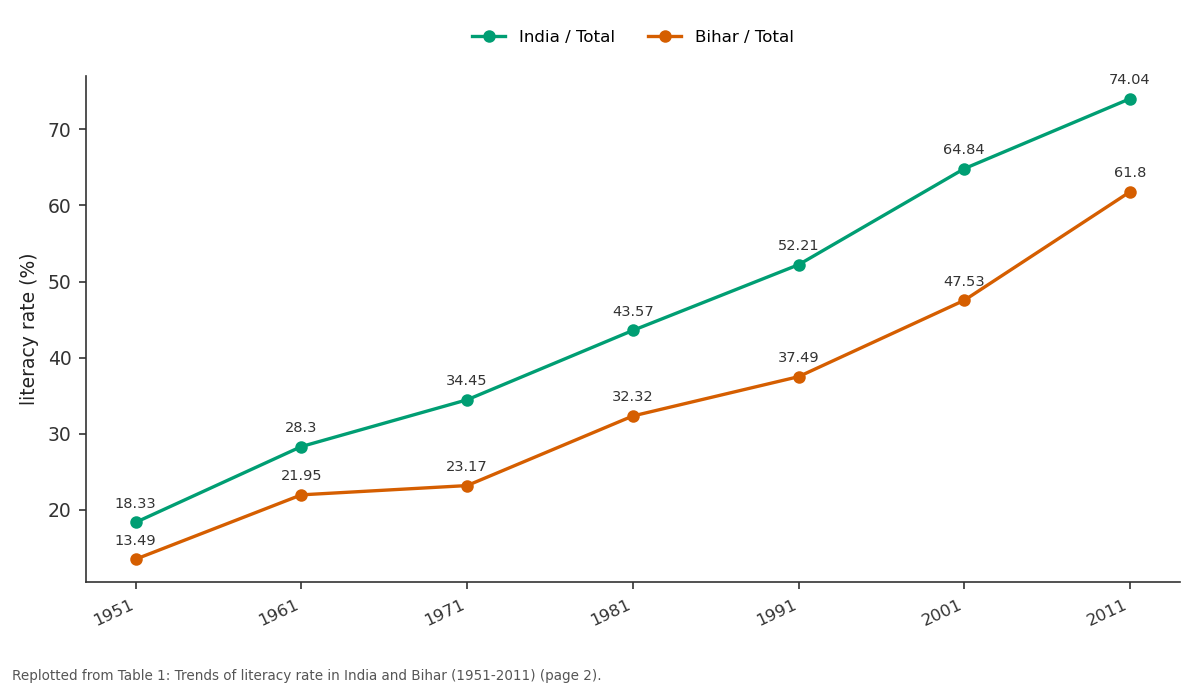
India / Total and Bihar / Total: 1951 vs 1961 vs 1971 vs 1981 vs 1991
Replotted from Table 1 (page 2) of the original paper. Every bar is the paper's own table value.
View source evidence ↗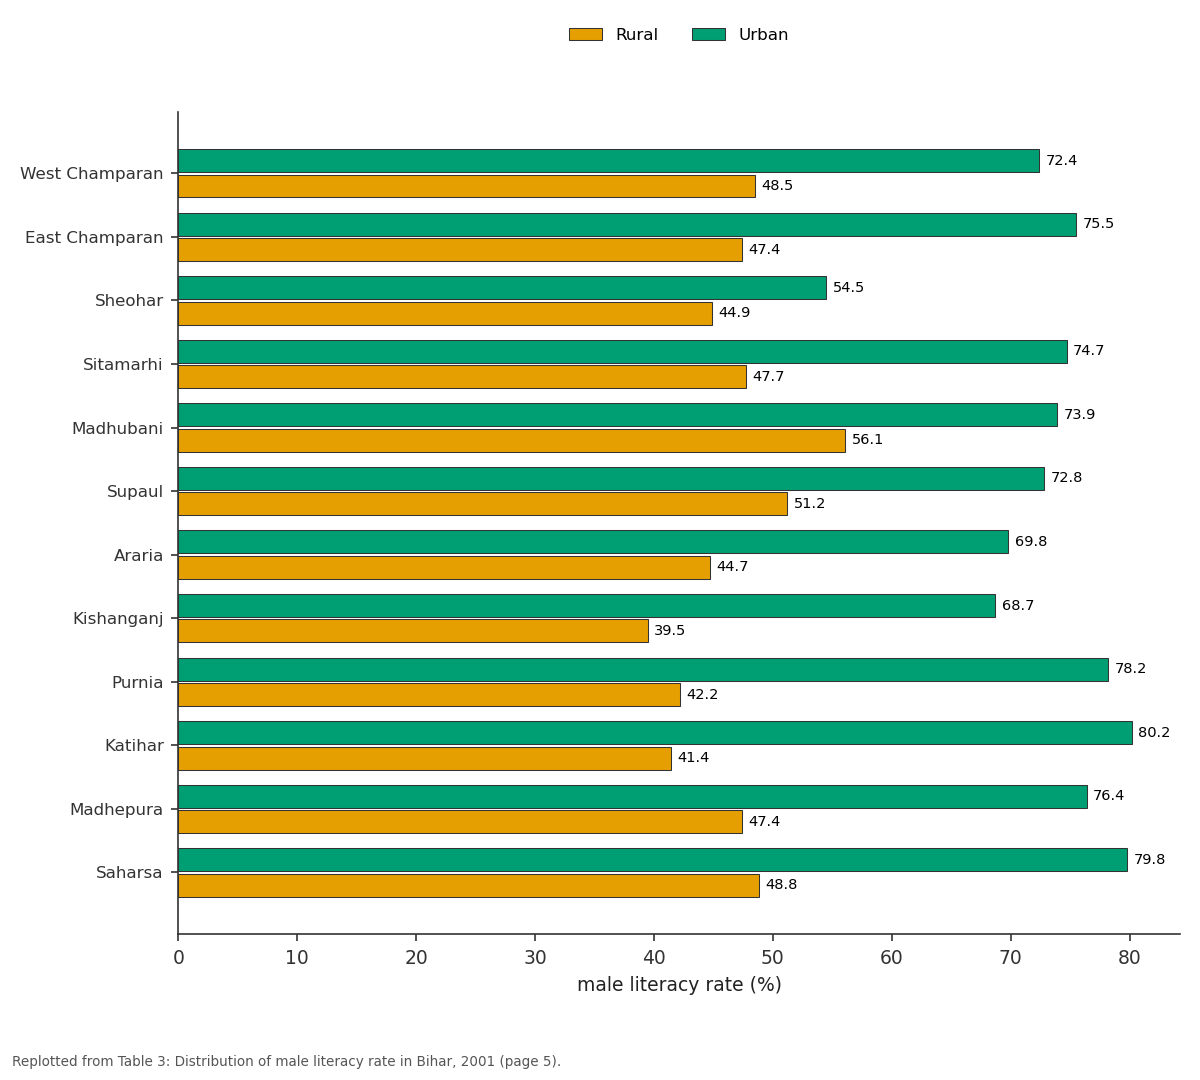
Rural and Urban: West Champaran vs East Champaran vs Sheohar vs Sitamarhi vs Madhubani
Replotted from Table 3 (page 5) of the original paper. Every bar is the paper's own table value.
View source evidence ↗Figures & tables
From the original paper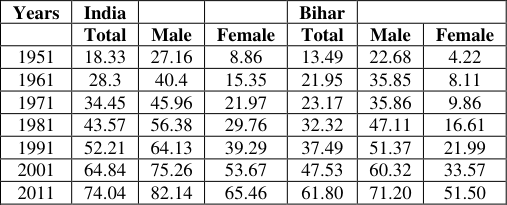 Table 1
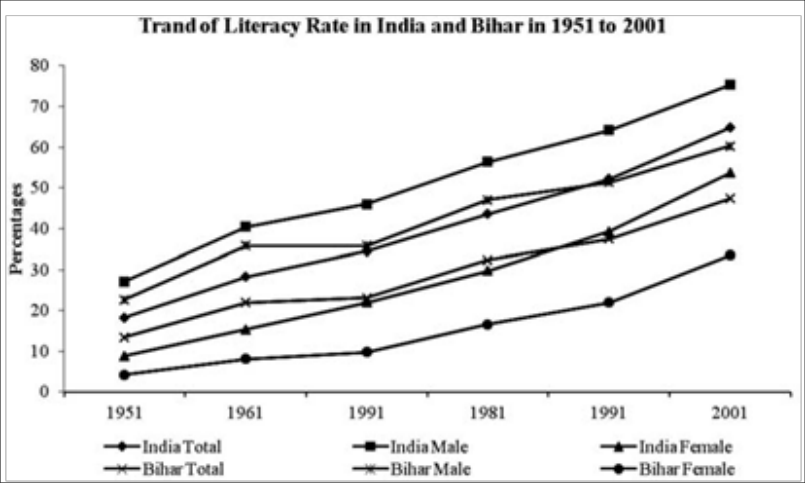 Figure 1
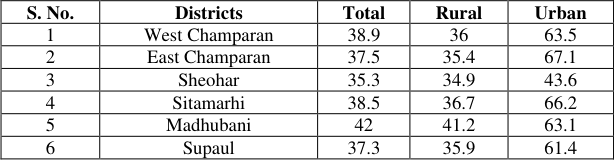 Table 2
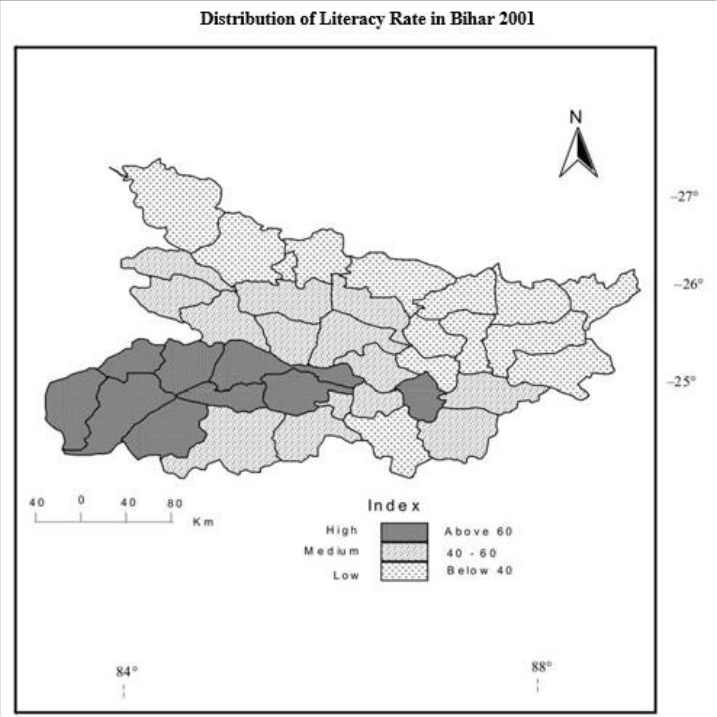 Figure 2
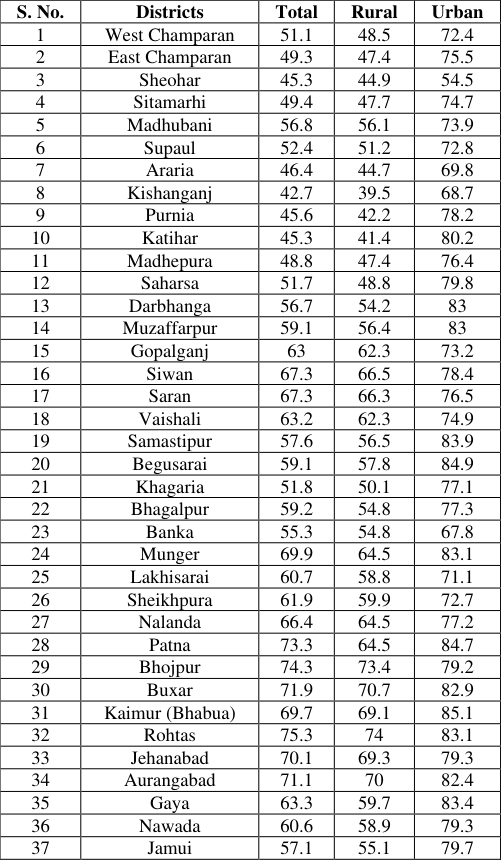 Table 3
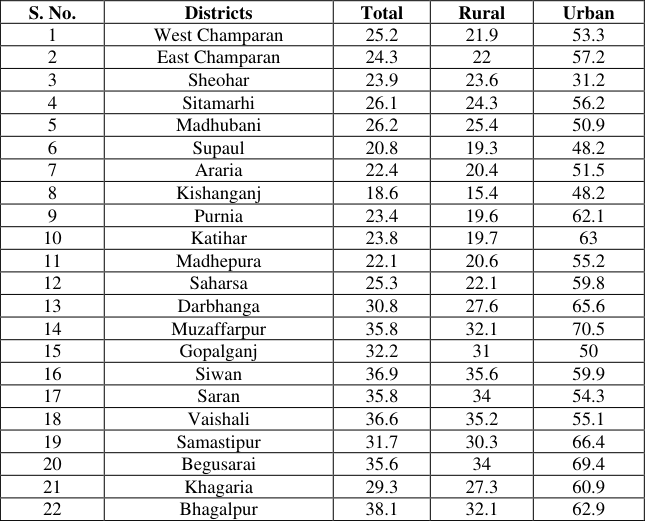 Table 4
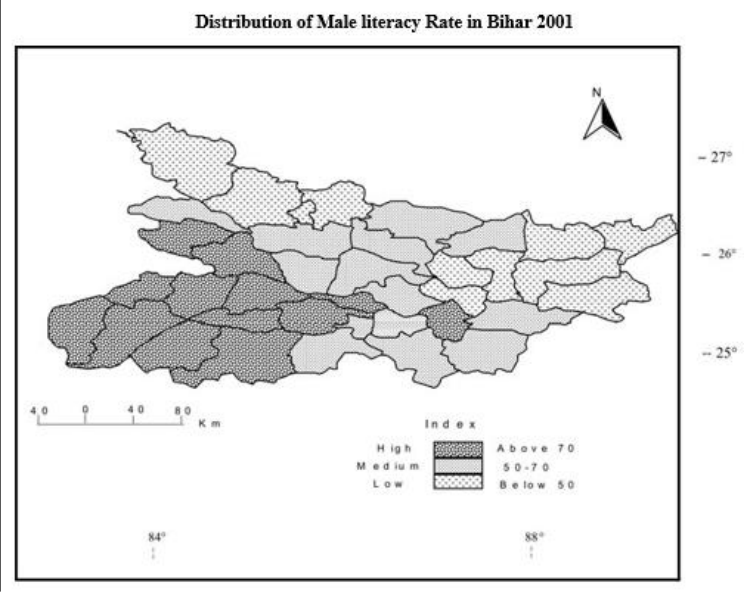 Figure 3
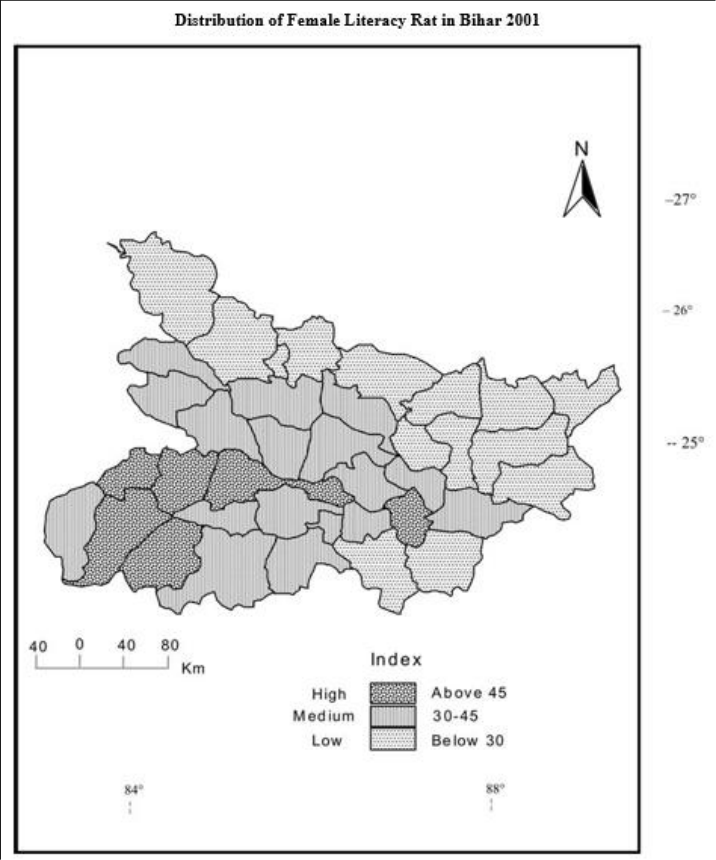 Figure 4
Introduction
After many decades of independence, Bihar largely an agrarian state is economically most backward region of Indian federal system. In the state, however, the literacy rate is rising from 47% in 2001 to 63%in 2011, but, still it has the lowest literacy rate in India. Globally, the definition of literacy varied to large extent, in India, although the basic criterion to define literacy is the ability to read and write with understanding in any language. A person who can merely read but cannot write is not classified as literate. Thus, any formal education or minimum education standard is not required to be considered literate. As per the latest census (2011), the all India literacy figure has gone up to 74.0%; Literacy rate amount female is 65.5% where as male literacy rate is 82. Modern Bihar has a grossly inadequate educational infrastructure creating a huge mismatch between demand and supply. This problem further gets compounded by the growing aspiration of the people and increase in population. More importantly, at district wise, the level of literacy in Bihar is unevenly distributed. This remarkable variation of regional analysis is even quite visible in urban and rural areas too. It is pleasant surprise to find that being a comparatively less literate state in India, with women's literacy being only 51.50%, the state is striving to climb.
Objectives: This Study is intended to achieve the following objectives: I. To discuss and examine the spatio-temporal distribution of literacy rate in Bihar. II. To analyse and access the trend of literacy rate between India and Bihar from 1951 onwards. III. To evaluate the trends, patterns and interacting factors of literacy in Bihar at district level IV. To identity the dynamics of influencing factors of literacy rate at regional and intraregional level.
Data Base and Methodology
The study is based on secondary sources of data. The data were collected from Census of India, and official websites of Bihar. The major advantages of the census data are that they are based on complete enumeration and are, therefore reliable than projections and estimates. Further, they provide an opportunity to observe trends over a period of time and draw meaningful conclusion to facilitate planning. Method of Simple percentage has been used for the analysis of data. The data were shown on multiple bar diagram, Simple line graph and on Choropleth map. For comparative study line graph, cartographic technique was used to show the trend of literacy rate. This line graph and bar graph also helps in giving legitimate references to the past trends and to elucidate variation and change.
Study Area
The region has been selected for study to enquire the spatiotemporal distribution and trends and patterns of literacy rate in Bihar. The state with the predominantly illiterate population and low levels of educational achievement is one of the poorest and least developed regions in India. It lags behind other states in almost all the important indicators of development. Even to this day, over half the population of the state is illiterate and only about a third of the females can read and write. Thus, Bihar has been and still remains one of the most educationally deprived states in India. As elsewhere in India, much of the gaps in education can be attributed to caste status, gender and poverty.
Discussion
Discussion
Comparative Study of Trends of Literacy Rate Between India and Bihar from 1951-2011
Undoubtedly, the general population of Bihar has lagged behind in educational, indicators such as general literacy rates, female literacy rates and enrolment and retention rates. On the other hand, the facts reveal that India is far behind acceptable standards regarding the first step towards education i.e. literacy. However, even that level is not uniformly attained throughout India. Wide regional disparity in educational attainment is a vexing problem in India. Here, an attempt has been made to discuss the trends of literacy rate between India and Bihar from 1951 onwards. Census of India, 1951, 1961, 1971, 1981, 1991, 2001and 2011 In 1951, the literacy rate for India was 18.33 and it was 13.49 for Bihar (for male it was 27.16 per cent for India and 13.49 per cent for Bihar whereas for female it was 8.86 per cent for India and 4.22 per cent for Bihar). The difference of literacy rate between India and Bihar during 1951 was 4.84 per cent of the total population (it was 4.84 per cent for male and 4.46 for female). Reasons of low literacy in Bihar supported by a set of factors comprise of poverty, socio-economic constraints and background of the family-as the children need to struggle for survival at an early age. Many parents know that education is important for their children. Nevertheless, due to economic and socio-cultural constraints, preference and priority were given to work. In 1961, the literacy rate increased to 26.3 per cent (9.98 per cent point) for India and 21.95 per cent (8.46 per cent point) for Bihar. The male literacy rate was 40.40 per cent (an increase in 13.34 per cent point) for India and 35.85 per cent (an increase of 13.17 per cent) for Bihar. In case of female literacy rate an increase of 15.35 per cent (6.49 per cent point) for India and 8.11 per cent for Bihar (3.89 per cent) has been reported.
While female literacy may have exhibited the largest decadal increase ever, it still remains considerably lower than male literacy rates. What farther confounds the picture is the considerable disparity between educational achievements between and within states, between rural and urban areas, between social groups. In 1971, the total literacy rate increased to 34.45 per cent (6.14 per cent point) and 23.17 per cent (1.22 per cent point) for India and Bihar respectively. An increase in male and female literacy rate up to this level is 45.96 per cent (5.55 per cent point) 21.97 per cent (6.63 per cent point) and 35.86 per cent point (0.01 per cent point), 9.86 per cent point (1.75 per cent point) for India and Bihar has been reported The reason of low literacy during this period was Indo -Pak War. Other than that poverty and illiteracy go hand in hand, the poor are disenfranchised, cut off from the democratic process. 1981, the total literacy rate of India and Bihar has increased to 43.57 per cent (9.12 per cent point) and 32.32 per cent (9.15 per cent point). For male and female literacy rate an increase up to 56.38 per cent (10.43 per cent point), 29.76 per cent (7.79 per cent point) and 47.11 (11.25 per cent point) and 16.61 per cent (6.75 per cent point) for India and Bihar has been noted. In many sense, it is true that the education system has under gone many types of changes and experiments. But educational growth in India and in the state of Bihar did not steeped up speedily as post independence planners and policy makers failed in establishing sound strides in the over world advancement at grass-roots level. The 2001 Census of literacy shows 65 per cent (8.65 per cent point) total literacy for India and for Bihar, it was 37.49 per cent (5.17 per cent point), for male and female it was 64.13 per cent (7.76 per cent point) and 47 per cent (9.54 per cent point) and 59.68 per cent (4.26 per cent point) 33.12 per cent (5.38 per cent point) for India and Bihar respectively. The decade of the 2000s, closely identified with the expansion of children's access and participation in basic education across India. The challenge of achieving gender and social equity in assuring quality of education was on real track. In 2011, the total literacy increases to 74.84 per cent (12.63 per cent point) for India and 63 per cent (15 per cent point) for Bihar. The male literacy was 82 and female literacy was 65 per cent. Where is in Bihar male literacy was 71.20 and female literacy was 51.50. Despite recent improvement in enrolment in primary education and survival rates to grade 5, Bihar is still behind the national average in terms of educational enrolment and literacy rates. The 2011 census indicated that Bihar's literacy level was 63 per cent, the lowest in India average of 74 per cent. The revised target year to achieve universal access to primary education has been pushed to 2007 in the approach paper has now been fixed at 72% by 2007 and 80% by 2012.
Trends and Patterns of Literacy in Bihar
Bihar has the lowest literacy rate among the major states of India. This acute poverty and backwardness can be traced to the backwardness of both its agricultural and industrial sectors. The social fabric of the state is also unique in comparison to other states of India and still has a pronounced hangover of the medieval period. The social fabric not only segregates community into strong line of caste system but also has effect on the livelihood pattern at large. There is huge gap in regional pattern and trends of literacy among the districts of Bihar and even urban to rural and male to female literacy rate. Literacy rate is marked with notable variations in its distribution among the districts of Bihar. The total literacy rate among the various district of the state varies from 51.08 per cent (Purniya) to 73.37 per cent (Rohtas) in 2011. The eighteen districts fall even below the average literacy rate of the state. (Table-2 and fig. 2). The districts in descending order of high literacy rate are Rohtas (73.37 per cent), Patna (70.68 per cent), Munger (70.46 per cent), Bhojpur (70.47 per cent), Aurangabad (70.32 per cent), Buxar (70.14 per cent), Jehanabad (66.80 per cent), Kaimur (69.34 per cent), Nalanda (64.43 per cent), Saran (51.8 per cent), Siwan (69.45 per cent), Vaishali (66.60 per cent) and Gaya (63.67 per cent). On the other hand, the districts with medium literacy rate are Bhagalpur (63.14 per cent), Sheikhpura (63.86 per cent), Muzaffarpur (63.43 per cent), Lakhisarai (62.42 per cent), Begusarai (48 per cent), Gopalganj (65.47 per cent), Nawada (59.76 per cent), Samastipur (61.86 per cent) Darbhanga (56.56 per cent), Banka (58.17 per cent), Jamui (59.79 per cent) Madhubani (58.62 per cent), Khagaria (57.92 per cent). The districts of lowest literacy rate are mainly concentrated in the North -East and North-West parts of Bihar (Table 2). The districts of less than 56% literacy rate under lowest category are Saharsa (53.20 per cent), West Champaran 9 55.70 per cent), Sitamarhi (52.05 per cent), East Champaran (55.79 per cent), Supaul (57.67 per cent), Madhepura (52.25 per cent), Sheohar (53.78 per cent), Katihar (52.24 per cent), Araria (53.53 per cent) Kishangang (55.46 per cent) and Purnia (51.08 per cent), A large number of children below the age of eighteen from the northern districts of Bihar including Champaran, Sitamarhi, Darbhanga, Madhubani, Purnia, Araria and Kishangang, one way and, the other way are the part of child labour due to poverty and lack of opportunities for education. These children have been deprived from their basic right to education. Total number of children as main workers (i.e. working for more than six month (per year) is about 0.54milion, while children in marginal work (working for less than six months) is approximately 0.58 million (Census of India 2011). These children do not have education potions that are available for them.
| S. No. | Districts | Total | Rural | Urban |
|---|---|---|---|---|
| 1 | West Champaran | 38.9 | 36 | 63.5 |
| 2 | East Champaran | 37.5 | 35.4 | 67.1 |
| 3 | Sheohar | 35.3 | 34.9 | 43.6 |
| 4 | Sitamarhi | 38.5 | 36.7 | 66.2 |
| 5 | Madhubani | 42 | 41.2 | 63.1 |
| 6 | Supaul | 37.3 | 35.9 | 61.4 |
Table text extracted from the original PDF; superscript letters are shown inline. The original table image is below.
View original table image
Rural -Urban Distribution
The literacy rate of rural urban population is also considerably different. The highest Rural literacy rate is found in Rohtas (59.2 per cent) and it is lowest in Kishngang (27.8 per cent point) whereas in case of Urban literacy it is highest in Patna (78.1 per cent) and lowest in Sheohar (43.6 per cent) (Table 2 and Fig. 2). The high rural literacy rate are found in the districts of Rohtas (59.2 per cent), Bhojpur (56.8 per cent), Aurangabad (55.5 per cent), Buxar (55 per cent), Kaimur (54.4 per cent), Jehanabad (54.1 per cent), Munger (52.8 per cent), Patna (51.4 per cent), Siwan (50.5 per cent), Nalanda (50.4 per cent), Saran (50.3 per cent) and Vaishali (49.3 per cent). The urban literacy rate is highest in the districts of Patna (78.1 per cent), Begusarai (77.7 per cent), Muzaffarpur (77.3 per cent) Kaimur (76.9 per cent), Samastipur (75.7 per cent), Gaya (75.7 per cent), Darbhanga (74.9 per cent), Rohtas (74.1 per cent), Buxar (73.6 per cent), Aurangabad (73.5 per cent), Katihar (72.3 per cent), Bhojpur (71.6 per cent), Nawada (71.1 per cent), Purnia (70.9 per cent), Saharsa (70.7 per cent), Bhagalpur (70.7 per cent). The medium urban literacy rate has been noticed from the districts of central parts of Bihar and the lowest from north to east parts of the districts of the state (Table 2). Extensive impoverishment, entrenched hierarchical social divisions and the lack of correlation between educational attainment and job opportunities are often cited in studies of the hurdles. Obviously, the social set up and economic status of urban centres have greater functional utility skills and the people in various occupations warrant literacy as a pre -requisite.
Male literacy Rate
Male literacy constitutes the major proportion of literacy rate of Bihar. Similarly, Male literacy rate has been grouped into high, medium and low. Considerable regional variation has been traced out in the male literacy rate of Bihar. The highest male literacy rate has been recorded from the districts of Rohtas (75.3 per cent), Bhojpur (74.3 per cent), Patna (73.3 per cent), Buxar (71.9 per cent), Aurangabad (71.1 per cent), Jehanabad (70.1 per cent). The south-east districts of the state lie under medium grade of literacy rate (Table 3). The districts of Sitamarhi (49.4 per cent), East Champaran (49.3 per cent), Madhepura (48.8 per cent), Araria (46.4 per cent), Purnia (45.6 per cent), Sheohar (45.3 per cent), Katihar (45.3 per cent), Kishanganj (42.7 per cent), fall under lowest literacy group (Table 3).
| S. No. | Districts | Total | Rural | Urban |
|---|---|---|---|---|
| 1 | West Champaran | 51.1 | 48.5 | 72.4 |
| 2 | East Champaran | 49.3 | 47.4 | 75.5 |
| 3 | Sheohar | 45.3 | 44.9 | 54.5 |
| 4 | Sitamarhi | 49.4 | 47.7 | 74.7 |
| 5 | Madhubani | 56.8 | 56.1 | 73.9 |
| 6 | Supaul | 52.4 | 51.2 | 72.8 |
| 7 | Araria | 46.4 | 44.7 | 69.8 |
| 8 | Kishanganj | 42.7 | 39.5 | 68.7 |
| 9 | Purnia | 45.6 | 42.2 | 78.2 |
| 10 | Katihar | 45.3 | 41.4 | 80.2 |
| 11 | Madhepura | 48.8 | 47.4 | 76.4 |
| 12 | Saharsa | 51.7 | 48.8 | 79.8 |
| 13 | Darbhanga | 56.7 | 54.2 | 83 |
| 14 | Muzaffarpur | 59.1 | 56.4 | 83 |
| 15 | Gopalganj | 63 | 62.3 | 73.2 |
| 16 | Siwan | 67.3 | 66.5 | 78.4 |
| 17 | Saran | 67.3 | 66.3 | 76.5 |
| 18 | Vaishali | 63.2 | 62.3 | 74.9 |
| 19 | Samastipur | 57.6 | 56.5 | 83.9 |
| 20 | Begusarai | 59.1 | 57.8 | 84.9 |
| 21 | Khagaria | 51.8 | 50.1 | 77.1 |
| 22 | Bhagalpur | 59.2 | 54.8 | 77.3 |
| 23 | Banka | 55.3 | 54.8 | 67.8 |
| 24 | Munger | 69.9 | 64.5 | 83.1 |
| 25 | Lakhisarai | 60.7 | 58.8 | 71.1 |
| 26 | Sheikhpura | 61.9 | 59.9 | 72.7 |
| 27 | Nalanda | 66.4 | 64.5 | 77.2 |
| 28 | Patna | 73.3 | 64.5 | 84.7 |
| 29 | Bhojpur | 74.3 | 73.4 | 79.2 |
| 30 | Buxar | 71.9 | 70.7 | 82.9 |
| 31 | Kaimur (Bhabua) | 69.7 | 69.1 | 85.1 |
| 32 | Rohtas | 75.3 | 74 | 83.1 |
| 33 | Jehanabad | 70.1 | 69.3 | 79.3 |
| 34 | Aurangabad | 71.1 | 70 | 82.4 |
| 35 | Gaya | 63.3 | 59.7 | 83.4 |
| 36 | Nawada | 60.6 | 58.9 | 79.3 |
| 37 | Jamui | 57.1 | 55.1 | 79.7 |
Table text extracted from the original PDF; superscript letters are shown inline. The original table image is below.
View original table image
Rural -Urban Male literacy Rate
The average literacy rates of males in urban areas are substantially higher than the rural areas. It is 77.3 per cent against 57.2 per cent for rural male. The ranges of variation in literacy rate among urban population are 85.1 per cent to 54.5 per cent, whereas, this variation in rural areas ranges between 74 per cent (Rohtas) to 39.5 per cent (Kishanganj) (Table 3).
The districts of Rohtas (74 per cent), Bhojpur (73.4 per cent), Buxar (70.7 per cent) and Aurangabad (70 per cent) have high rural male literacy rate, whereas the districts of Jehanad, Kaimur, Siwan, Saran, Munger, Nalanda, Patna, Gopalgang, Vaishali, Sheikhpura, Gaya, Nawada, Lakhisarai, Begusarai, Samastipur, Muzaffarpur, Madhubani, Jamui, Bhagalpur, Banka, Darbhanga, Supaul and Khagaria have medium literacy rate ranges from 69.3 per cent to 51.1 per cent. And, the districts of Saharsa, West Champaran, Sitamarhi, East Champaran, Madhepura, Sheohar, Araria, Purnia, Katihar and Kishangang fall under the lowest male literacy rate. The highest urban male literacy has been recorded from the district of Kaimur (85.1 per cent) followed by Patna (84.7 per cent) and it was the lowest in the district of Sheohar (54.5 per cent). Parents with limited resources invest in educating their sons, as it is typically, assumed that girls will ultimately be married and live with their in-laws.
Female Literacy Rate
The female literacy rate is lesser than those of males and varies widely at district level with a maximum of 50.
Rural -Urban Female literacy Rate
There is a wide gap between rural urban female literacy rates. The urban female literacy rate for the state is 58.42 per cent whereas it is 29.57 per cent for the rural areas. Among the districts of rural areas it runs from 15.4 per cent to 42.9 per cent, whereas in urban areas it ranges from 31.2 per cent (Sheohar) to 70.5 per cent (Muzaffarpur). The rural areas Rohtas has the highest female literacy rate and Kishangang has the lowest female literacy rate. The high female literacy rate in rural areas found in the districts of Rohtas, Aurangabad, Munger, Bhojpur, Kaimur, Jehanabad, Buxar, Patna, Siwan, vaishali and Nalanda. The female literacy rate in these districts ranges between 35 per cent to 42.9 per cent (Table 4). The districts of medium rural female literacy rate are Begusarai, Muzaffarpur, Bhagalpur, Gaya, Lakhisarai, Gopalgang, Sheikhpura, Samastipur, Nawada, Banka, Dharbhanga, Khagaria and Madhubani. And it is lowest in the districts of Sitamarhi, Jamui, Sheohar, Saharsa, East-Champaran, West -Champaran, Madhepura, Araria, Katihar, Purnia, Supaul and Kishangang (The range of variation is 24.3 per cent to 15.4 per cent). In urban areas, the highest female literacy rate found in Muzaffarpur (70.5 per cent) whereas Sheohar has the lowest urban female literacy rate. The districts of highest female literacy rate (ranges between75.5 per cent to 60.9 per cent) are Patna, Begusarai, Munger, Kaimur, Gaya, Samastipur, Darbhanga, Rohtas, Aurangababad, Katihar, Bhagalpur, Buxar, Bhojpur, Purnia, Nawada and Khagaria (Table 4). The districts of Siwan, Saharsa, Nalanda, Jehanabad, East-Champaran, Sitamarhi, Jamui, Madhepura, Vaishaili, Saran, West-Champaran, Araria, Madhubani, Banka, Sheikhpura and Gopalgang comprise under medium category, the range of variation is 59.6 per cent to 50 per cent. Lakhaisarai (49.7 per cent), Supaul (48.2 per cent), Kishangang (48.2 per cent) and Sheohar (31.2 per cent) fall under the lowest category (Table 4). Societies with no equal status and opportunities to female adversely affect total literacy rate, since women usually constitute half of the total population of any society. In Bihar, the inability of Govt. School to prevent dropout of girls increases the probability of poor girls remaining illiterate. In addition to the factors stated above, the apathy and resistance of parents, unfavorable attitudes towards the education of girls and early marriage are the main factors aggravating the issue in excluded communities.
| S. No. | Districts | Total | Rural | Urban |
|---|---|---|---|---|
| 1 | West Champaran | 25.2 | 21.9 | 53.3 |
| 2 | East Champaran | 24.3 | 22 | 57.2 |
| 3 | Sheohar | 23.9 | 23.6 | 31.2 |
| 4 | Sitamarhi | 26.1 | 24.3 | 56.2 |
| 5 | Madhubani | 26.2 | 25.4 | 50.9 |
| 6 | Supaul | 20.8 | 19.3 | 48.2 |
| 7 | Araria | 22.4 | 20.4 | 51.5 |
| 8 | Kishanganj | 18.6 | 15.4 | 48.2 |
| 9 | Purnia | 23.4 | 19.6 | 62.1 |
| 10 | Katihar | 23.8 | 19.7 | 63 |
| 11 | Madhepura | 22.1 | 20.6 | 55.2 |
| 12 | Saharsa | 25.3 | 22.1 | 59.8 |
| 13 | Darbhanga | 30.8 | 27.6 | 65.6 |
| 14 | Muzaffarpur | 35.8 | 32.1 | 70.5 |
| 15 | Gopalganj | 32.2 | 31 | 50 |
| 16 | Siwan | 36.9 | 35.6 | 59.9 |
| 17 | Saran | 35.8 | 34 | 54.3 |
| 18 | Vaishali | 36.6 | 35.2 | 55.1 |
| 19 | Samastipur | 31.7 | 30.3 | 66.4 |
| 20 | Begusarai | 35.6 | 34 | 69.4 |
| 21 | Khagaria | 29.3 | 27.3 | 60.9 |
| 22 | Bhagalpur | 38.1 | 32.1 | 62.9 |
Table text extracted from the original PDF; superscript letters are shown inline. The original table image is below.
View original table image
Conclusion
In the light of discussions, it may be concluded that over all literacy rate of Bihar shows an increasing trend from 13.49 per cent in 1951 to 47.53 per cent in 2011.Futher, in the state, however, the literacy rate is rising from 39% in 1991 to 47% in 2011, but, still it has the lowest literacy rate in India. What further confounds the picture is the considerable disparity between educational achievements within districts, between rural and urban areas and between social groups. The data on women and girls in Bihar reveal certain facts that ought to be of great concern to educationists, planners and policy makers. While the female literacy may have exhibited the decadal increase, but it still remains, considerably lower than male literacy rate (33.57% against the national average of 54.16%). Girls, yet again emerge as an extremely vulnerable category cutting across social groups as well as geographical location. The social fabric not only segregates community into strong like of caste system but also has effect on the livelihood pattern at large. As elsewhere, much of the gaps in education of the state can be attributed to caste status, gender and poverty.
Figures and tables from the paper
| Years | India | — | — | Bihar | — | — |
|---|---|---|---|---|---|---|
| Total | Male | Female | Total | Male | Female | |
| 1951 | 18.33 | 27.16 | 8.86 | 13.49 | 22.68 | 4.22 |
| 1961 | 28.3 | 40.4 | 15.35 | 21.95 | 35.85 | 8.11 |
| 1971 | 34.45 | 45.96 | 21.97 | 23.17 | 35.86 | 9.86 |
| 1981 | 43.57 | 56.38 | 29.76 | 32.32 | 47.11 | 16.61 |
| 1991 | 52.21 | 64.13 | 39.29 | 37.49 | 51.37 | 21.99 |
| 2001 | 64.84 | 75.26 | 53.67 | 47.53 | 60.32 | 33.57 |
| 2011 | 74.04 | 82.14 | 65.46 | 61.80 | 71.20 | 51.50 |
Table text extracted from the original PDF; superscript letters are shown inline. The original table image is below.
View original table image
References
22 in the original paper- Bandyo Padhyay PK. Population and Development, Yojna, No. 16, sept. 16, Ministry of Information and Broad Casting, Govt. of India, New Delhi, 1994, 38.
- Census of India. General Population Table, Series-1, Part-1-A, Ministry of Home Affairs, New Delhi, 1951, 2.
- Census of India. Primary Census Abstract, Population Tables of Bihar, 1961.
- Census of India. Primary Census Abstract, Population Tables of Bihar, 2011.
- Chandana RC. Geography of Population, Kalyani Publishers, Ludhiana, 2006.
- Colclough C. The Impact of Primary Schooling on Economic Development: A Dreze, J. (2003). Patterns of Literacy and their Social Context, in Das V et al. (ed). European Commission, 1982.
- Gajraj S. The Impact of Primary Education on Literacy, Section of Statistics on Education, STE-8, UNESCO, Paris, 1992.
- GOI. Census of India 2011, General Population Tables, Office of the Registrar General, Min. of Home Affairs, Govt. of India downloaded from the website, 2011. www.censusindia.net
- Golden Hilda H. Literacy: International Encyclopedia of Social Sciences, Macmillion Company and Free Press, 1968, 9.
- Gosal GS. Literacy in India: An interpretative Study, Rural Sociology, Groups, Centre for Policy Research. New Delhi, 1964, 29.
- Inequalities among and within Families, The Pakistan Development Review, Jha, J., Jhingran, D. Elementary Education for the Poorest and Other Deprived, 2002, 33.
- Khullar R. India: A Comprehensive Geography, Kalyani Publishers, New Delhi, 2006.
- Kozel V, Parker B. Poverty in Rural India-The Contribution of qualitative Research in Poverty and Development 2011-01, 1999.
- Krishan G, Shayam M. Spatial Perspective on Progress in Female Literacy in India: 1907-71, Pacific View Point, 1973, 14.
- Maharatna A. Demographics Perspectives on India's Tribes, Oxford, 2005.
- Nayar KR, Kumar. Data from Kerala and Bihar: A Comparison, Published in Yojana 2005;2:103-34.
- Ramachandran V. Gender and Social Equity. Hierarchies of Access, The Review of the Evidence, World Development 2002;10(3):167-185.
- Sathar ZA, Lloyd CB. Who Gets Primary Schooling in Pakistan: Sen, Amartya (1996) Radical Needs and Moderate Reforms, in Jean Dreze and Amartya Sen (ed.), Indian Development: Selected Regional Perspectives, New Delhi: Oxford University, 1994.
- Sharma Alka N. Political Economy of Poverty in Bihar Economic and political Weekely 1995;30(41&42):2587-2602.
- Street B. Literacy in theory and practice Cambridge: Cambridge University Press. The Oxford India Companion of Sociology and Social Anthropology, 2, Oxford, 1984.
- Trewartha GT. A Geography of Population: World Patterns, John Willey and Sons, New York University Press New Delhi, 1969.
- World Bank. Primary Education in India, Washington, DC, 1997.
Cited by 1
From OpenAlex, OpenCitations and reference lists read by Scinovex
- Education and income disparities among farm households in Bhagalpur district Bihar, India ↗
Shatrughan Kumar · International Journal of Arts Humanities and Social Studies · 2020
This study investigates whether education makes a difference in farm household income inequality in India. Agriculture is vital for India’s rural economy. But there are many income inequalities across households. Land ownership, caste, access to non‑farm employment, and, crucially, education affect these differences. By drawing on national surveys and empirical work, the paper looks at how education differences cause income