
Research article · 2020 · Full text
International Journal of Statistics and Applied MathematicsUse of triple exponential smoothing in the analysis of hydrological data
Volume 5(4) · Pages 191–195
Research areasForecasting Techniques and Applications
Abstract
Author-writtenRegular and correct hand hygiene is one of the most important measures to prevent infection with the COVID-19 virus. WASH practitioners should work to enable more frequent and regular hand hygiene by improving access to hand hygiene facilities to support good hand hygiene behavior. Performing hand hygiene at the right time, using the right technique with either an alcohol-based hand rub and soap and water is critical. It makes water to be an essential resource in the fight against the pandemic. This article ventured into the analysis of water demand by Kisii County householders. This article employed a triple exponential smoothing method. The exponential smoothing methods usually applied in the analysis of univariate time series data. This study employed the Cox-Stuart method to determine the trend of the data. Since p-value = 0.00001141 < the significance level (α) = 0.05, this study concluded that the water data has a trend. The parameters of the triple exponential smoothing were identified to be α=0.2358, β=0.0028 and γ = 0.0976. They were determined in such a way that the mean squared error (MSE) of the error is minimized. In-sample forecasting was employed. No significant difference was noted. The exponential smoothing model was employed in out of sample forecasting, and it was realized that the water demand was expected to decrease. This study recommends the use of other statistical models to establish if the same results could be realized.
Summary
Source-checkedPlain-language reading of the full paper, prepared with AI and checked against the text. Each point links to the authors' own words.
Why it matters
- Proper hand hygiene is a critical measure for preventing COVID-19 infections. View evidence ↗
- Because of the importance of hygiene in fighting the pandemic, water has become an essential resource. View evidence ↗
The question
- The study aimed to analyze the water demand of householders in Kisii County. View evidence ↗
What they did
- The researchers analyzed hydrological data spanning from 2012 to 2020. View evidence ↗
- A triple exponential smoothing method was used to analyze the time series data. View evidence ↗
- The Cox-Stuart method was applied to determine if the water demand data exhibited a trend. View evidence ↗
- The analysis used data with a periodicity of 12 months per year. View evidence ↗
What they found
- The Cox-Stuart test indicated that the water data has a trend, as the p-value (0.00001141) was less than the significance level of 0.05. View evidence ↗
- The estimated parameters for the triple exponential smoothing model were α=0.2358, β=0.0028, and γ=0.0976. View evidence ↗
- In-sample forecasting showed no significant difference between the actual data and the forecasted plot. View evidence ↗
- Out-of-sample forecasting using the model indicated that water demand is expected to decrease. View evidence ↗
- The model demonstrated a good fit, with residuals that were normally distributed and within limit bounds. View evidence ↗
What it means
- The authors conclude that the estimated parameters are suitable for forecasting future household water demand. View evidence ↗
- The authors recommend using other statistical models to verify if the same results are obtained. View evidence ↗
- The authors suggest that future research could use the ordinary least square method to estimate the trend. View evidence ↗
Visual summary
2 visualsIllustrations explain the paper; charts are replotted from the paper's own table values.
Analysis Workflow
AI-generated conceptual illustration (a river basin with a water gauging station). It explains the idea and does not show study data.
View source evidence ↗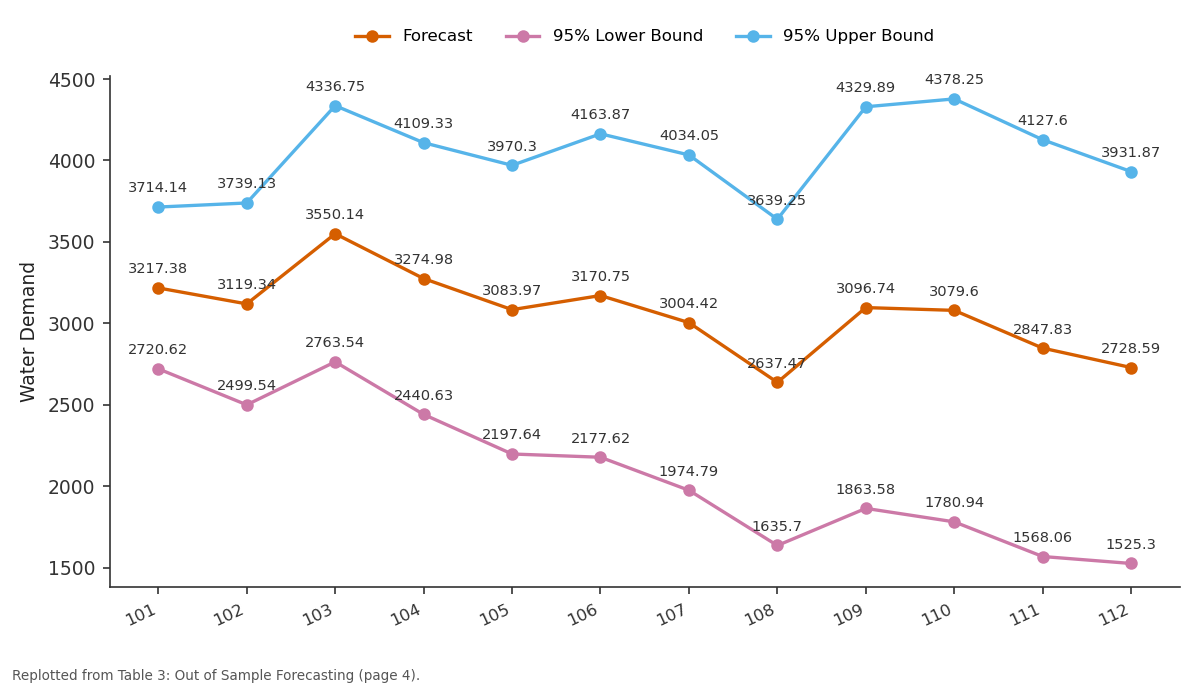
Forecast and 95% Lower Bound and more: 101 vs 102 vs 103 vs 104 vs 105
Replotted from Table 3 (page 4) of the original paper. Every bar is the paper's own table value.
View source evidence ↗Figures & tables
From the original paper Table 2
 Table 1
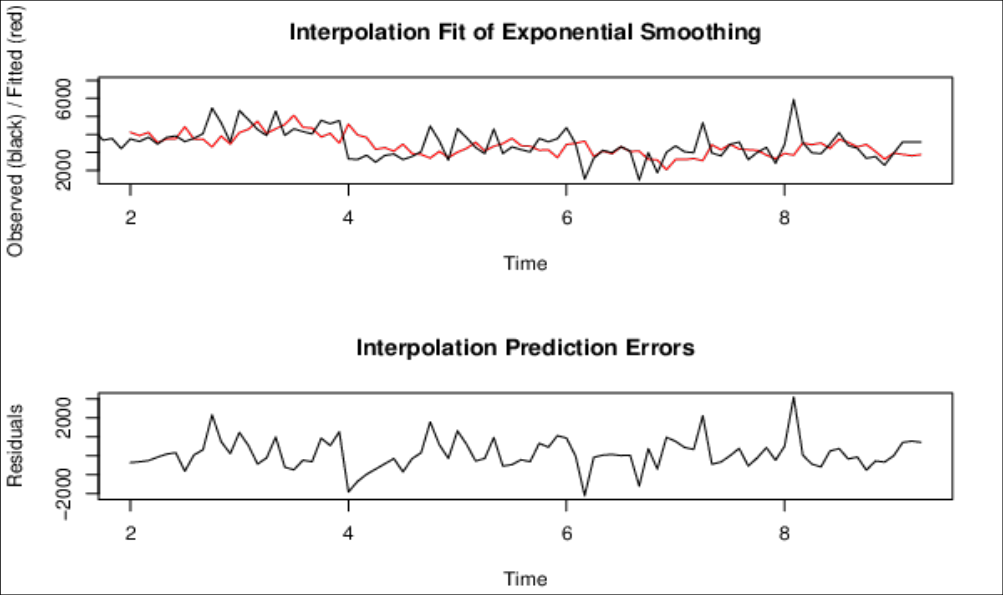 Figure 1
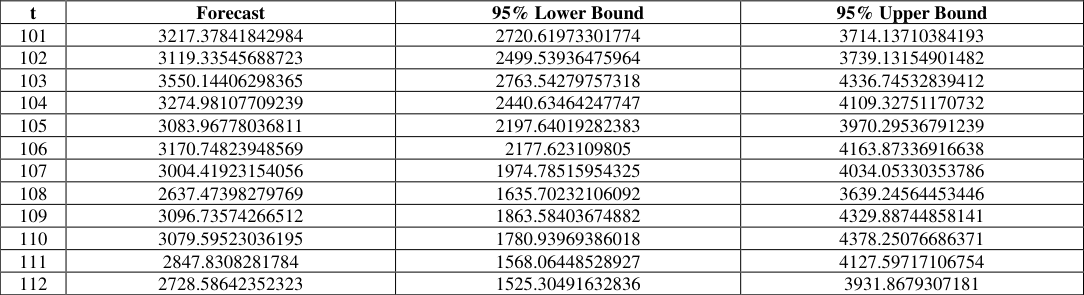 Table 3
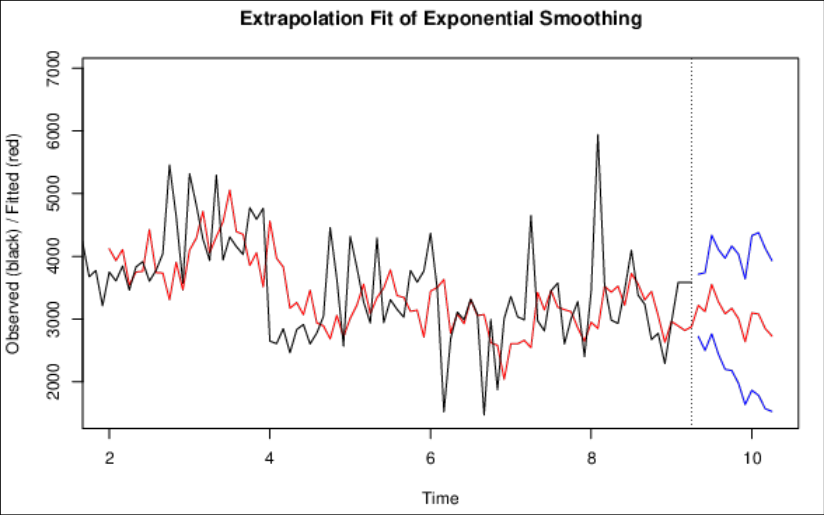 Figure 2
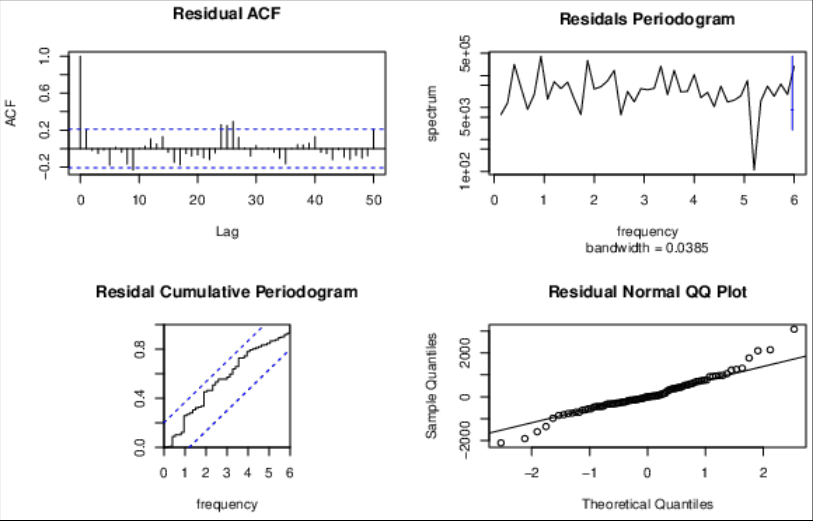 Figure 3
Introduction
According to [4] , Hand hygiene is essential to prevent the spread of the COVID-19 virus. Regular and correct hand hygiene is one of the most important measures to prevent infection with the COVID-19 virus. WASH practitioners should work to enable more frequent and regular hand hygiene by improving access to hand hygiene facilities to support good hand hygiene behavior. Performing hand hygiene at the right time, using the right technique with either an alcohol-based hand rub or soap and water, is critical. Existing WHO guidance on the safe management of drinking water and sanitation services applies to the COVID-19 outbreak. Water disinfection and sanitation treatment can reduce viruses. Many health co-benefits can be realized by safely managing water and sanitation services, and by applying good hygiene practices. Hygiene makes water to be an essential resource in the fight against the pandemic. This article ventured into the analysis of water demand by Kisii County householders. This article employed a triple exponential smoothing method. According to [1] , the presented method is found to have excellent forecast performance for time series with and without outliers, as well as for fat-tailed time series and under model misspecification. The exponential smoothing methods are generally applied in the analysis of univariate time series data. It is generally considered for an alternative to the Box-Jenkins methodology (ARIMA) [2] . It is a rule of thumb technique for smoothing time series data using the exponential window function. Whereas in the simple moving average, the past observations are weighted equally, exponential functions are used to assign exponentially decreasing weights over time. It is a quickly learned and easily applied procedure for making some determination based on prior assumptions by the user, such as seasonality. Exponential smoothing is often used for the analysis of time-series data. Exponential smoothing is one of many window functions commonly applied to smooth data in signal processing, acting as low-pass filters to remove high-frequency noise. This method is preceded by Poisson's use of recursive exponential window functions in convolutions from the 19th century, as well as Kolmogorov and Zurbenko's use of recursive moving averages from their studies of turbulence in the 1940s [6] .
Methodology
The article delved into the application of triple exponential smoothing in the analysis of household water data. We ventured into finding out if the data had a trend by using the Cox-Stuart method. The procedure is as follows:
Cox and Stuart (C-S) Trend Test
C-S test is customarily employed to detect the non-random pattern, which is the periodic pattern. C-S test compares the first half and the second half of the sample data. When the data has a downward trend, the observations in the first half are expected to be higher than the observation in the second half. When the data has an upward trend, the observations in the first half are expected to be smaller than the observations in the second half. When the data in question has no trend, then the researcher should expect smaller differences between the two halves of the sample data due to the randomness of the data [5] . To perform the C-S test, the sample differences are computed as shown below;
Where 𝑚 = 𝑛 2 if and only if n is even and 𝑚 = (𝑛+1) 2 if and only if n is odd. The differences which are equal to zero are ignored in this case. Denoting the sample data with positive differences by Y1, Y2, Y3 Ym; then, the C-S test is a sign test applied to the sample data of non-zero differences Y1, Y2, Y3, …, Ym [5] . Let 𝑠𝑔𝑛(𝑏) = 1, if 𝑏 > 0 and 𝑠𝑔𝑛(𝑏) = -1, if 𝑎 < 0. Then the C-S statistic is given as:
The hypotheses tested at the significance level (α) are H0: There is no periodic trend in the household water data H.A.: There is a periodic trend in the household water data To use the triple exponential method, the time series data must have the trend and the seasonal component. The basic equations are indicated below.
Overall Smoothing Equation
Where x is the observation, S is the smoothed observation, b is the trend factor, and t is the time
Trend Smoothing Equation
Where S is the smoothed observation and b is the trend factor
Seasonal Smoothing
Where I is the seasonal index
Forecasting Equation
Where I is the seasonal index and F is the forecast at m periods ahead 𝛼, 𝛽 𝑎𝑛𝑑 𝛾 are constants that must be determined in such a way that the mean squared error (MSE) of the error is minimized. It is mostly achieved using a statistical software.
To initialize the triple exponential smoothing method, we need at least season's data to estimate the initial seasonal indices 𝐼 𝑡 -𝐿 A complete season's data comprises of L periods. We need to estimate the trend factor from one period to the next. It compels the researcher to use two complete seasons-that is-2L periods [3] .
Initial Values for the Trend Factor
The initial value of the trend is estimated by:
Initial Values for the Seasonal Indices
The initial values for the seasonal indices were computed using the steps indicated below.
In our study, we worked with hydrological data with a periodicity of 12 (that is 12 months per year). The above process of finding the mean proceeds for the next n years.
STEP 3: The seasonal indices are formed by computing the average of each row. That is;
Sometimes zero coefficients for the trend or seasonality or both are encountered. It does not necessarily imply that there is no trend component or seasonality. It means that both of them were right on the money; hence no updating was required in order to achieve the lowest MSE [3] .
Results
This study ventured into the analysis of hydrological data from 2012 to 2020 to determine the forecast of the future demand for water in Kisii County. This study conducted a trend test using the Cox-Stuart method.
Cox-Stuart Trend Test
Cox and Stuart's trend analysis method was subjected to household water data. The hypotheses were: H0: There is no periodic trend in the household hydrological data H.A.: There was a periodic trend in the household hydrological data The hypotheses were tested at a 5% significance level.
The test results from r software are as indicated in Table 4 below From the table above, it can be seen that the p-value = 0.00001141 < the significance level (α) = 0.05. Therefore this study can reject the null hypothesis in favor of the alternative hypothesis and conclude that the household water data has a periodic trend.
Estimated Parameters of Exponential Smoothing
The three parameters were estimated, and they are indicated in the table below It can be deduced that there is no significant difference between the actual data plot and that of the in-sample forecasted plot. It suggests that the model gives a good representation of the data. Therefore this study deemed it fit to use in conducting out-sample forecasting.
Extrapolation Forecasts of Exponential Smoothing
Since the In-sample forecasting was identified to be within the limit bounds, this study went further and conducted out of sample forecasting. The out of sample forecasting are indicated in table 3 below It can be established that the residuals are normally distributed and fall with the limit bounds indicating a good fit of the model.
| t | Forecast | 95% Lower Bound | 95% Upper Bound |
|---|---|---|---|
| 101 | 3217.37841842984 | 2720.61973301774 | 3714.13710384193 |
| 102 | 3119.33545688723 | 2499.53936475964 | 3739.13154901482 |
| 103 | 3550.14406298365 | 2763.54279757318 | 4336.74532839412 |
| 104 | 3274.98107709239 | 2440.63464247747 | 4109.32751170732 |
| 105 | 3083.96778036811 | 2197.64019282383 | 3970.29536791239 |
| 106 | 3170.74823948569 | 2177.623109805 | 4163.87336916638 |
| 107 | 3004.41923154056 | 1974.78515954325 | 4034.05330353786 |
| 108 | 2637.47398279769 | 1635.70232106092 | 3639.24564453446 |
| 109 | 3096.73574266512 | 1863.58403674882 | 4329.88744858141 |
| 110 | 3079.59523036195 | 1780.93969386018 | 4378.25076686371 |
| 111 | 2847.8308281784 | 1568.06448528927 | 4127.59717106754 |
| 112 | 2728.58642352323 | 1525.30491632836 | 3931.8679307181 |
Table text extracted from the original PDF; superscript letters are shown inline. The original table image is below.
View original table image
Conclusions
▪ It can be seen that the p-value = 0.00001141 < the significance level (α) = 0.05 from the Cox-Stuart test. Therefore this study can conclude that the household water data has a trend. ▪ Since the in-sample forecasts show no significant difference compared to the observed data, the estimated parameters can be applied in forecasting the future demand of household water. ▪ From figure 2 above, it can be deduced that the quantity of household water demanded is expected to decrease.
Recommendations
▪ This study employed the Cox-Stuart method to determine the trend of water demanded. Future researchers can employ other methods like the ordinary least square method to estimate the trend. ▪ The future researchers can employ other models like harmonic regression models, principal component regression models to determine if the same results could be realized. ▪ The methods employed in this article can be applied in other areas to analyze and forecast future values.
Acknowledgment
I wish to thank all individuals whose information was of value in drafting this article. God bless you all.
Figures and tables from the paper
| Parameter | Value |
|---|---|
| 𝛼 | 0.2358 |
| 𝛽 | 0.0028 |
| 𝛾 | 0.0976 |
Table text extracted from the original PDF; superscript letters are shown inline. The original table image is below.
View original table image
| Description | Value |
|---|---|
| Cox-Stuart Statistic | 4.8655 |
| P-value | 0.00001141 |
| Significance level(α) | 0.05 |
Table text extracted from the original PDF; superscript letters are shown inline. The original table image is below.
View original table image
References
6 in the original paper- Gelper Sarah, Fried Roland, Croux Christophe. Robust Forecasting with Exponential and Holt-Winters Smoothing. Journal of Forecasting. 2010; 29(3):285-300. doi: 10,2139/ssrn.1089403
- Jason Brownlee. A Gentle Introduction to Exponential Smoothing for Time Series Forecasting in Python. Retrieved from Machine Learning Mastery, 2020. https://machinelearningmastery.com/exponentialsmoothing-for-time-series-forecasting-in-python/
- Mary Natrella, Paul Tobias, Carroll Croarkin. eHandbook of Statistical Methods, 2012. doi: doi.org/10.18434/M32189
- Matt Arduino et al. Water, sanitation, hygiene, and waste management for the COVID-19 virus. World Health Organization, 2020.
- Robert Orwenyo Onyoni, George Otieno Orwa, Zablon Maua Muga. Modeling household water demands using sinusoidal models. International Journal of Statistics and Applied Mathematics. 2019; 4(6), 128-132.
- Wikipedia Contributors. Exponential Smoothing. Retrieved from Wikipedia, The Free Encyclopedia, 2020. https://en.wikipedia.org/w/index.php?title=Exponential_s moothing&oldid=966519029
Cited by 2
From OpenAlex, OpenCitations and reference lists read by Scinovex
- Predicting Saudi Stock Market Index by Using Multivariate Time Series Based on Deep Learning ↗
Mutasem Jarrah, Morched Derbali · Applied Sciences · 2023
Time series (TS)-based predictions are made by examining the behaviour of historical data to forecast future values. Multiple industries; such as stock market trading, power load forecasting, medical monitoring, and intrusion detection; frequently use it. Several variables; such as the performance of other markets as well as the economic situation of a country which affect its market performance; significantly affect…
❝ 24PDF - A Novel Martingale Based Model Using a Smartphone to Detect Gait Bout in Human Activity Recognition ↗
Jonathan Etumusei, Jorge Martínez Carracedo, Sally I. McClean · Journal of Sensors · 2022
Gait bout is when an individual performs certain physical activities such as walking or running. In the last few decades, the study of gait bout has led to substantial progress in treating gait impairment (neuropathic, myopathic, and parkinsonian) in a person. Recently, gait bout study has been improved by advancing smartphone technology. To perform gait bout tasks, two different human…
❝ 4PDF