
Research article · 2020 · Full text
International Journal of Statistics and Applied MathematicsPrediction of covid-19 cases in India using prophet
Volume 5(4) · Pages 103–106
Research areasCOVID-19 epidemiological studiesCOVID-19 diagnosis using AIArtificial Intelligence in Healthcare
Abstract
Author-writtenThe substantial spike in daily new cases infected with the novel Coronavirus (COVID-19) worldwide is alarming and many researchers are now carrying out several analyses to forecast the future pattern of this pandemic. In this study, we have forecasted the expected daily number of COVID-19 cases in India for the next four weeks using Prophet. The results have demonstrated that by the end of the second week of August, the rate of proliferation of COVID-19 might reach upto 1,500,000 cases per day in India. It is observed that the performed model of fit is accurate within a certain range, and extreme preventive and control measures are suggested in an effort to avoid such a situation.
Summary
Source-checkedPlain-language reading of the full paper, prepared with AI and checked against the text. Each point links to the authors' own words.
Why it matters
- The global surge in daily COVID-19 cases has created an urgent need for researchers to forecast the pandemic's future patterns. View evidence ↗
- The rapid spread of the virus necessitates intensive study and precise data monitoring to improve the accuracy of future case predictions. View evidence ↗
The question
- The study aims to forecast the expected daily number of COVID-19 cases in India for a four-week period using the Prophet model. View evidence ↗
What they did
- The researchers used Prophet, an open-source Facebook library that employs an additive model combining non-linear trends, seasonality, and holidays for time series forecasting. View evidence ↗
- The forecasting was implemented using the R analytics platform. View evidence ↗
- The model accounts for non-periodic changes, periodic changes (seasonality), irregular holiday effects, and an error term for unusual changes. View evidence ↗
- Model performance was evaluated using metrics including R-squared and Root Mean Square Error (RMSE). View evidence ↗
What they found
- The model predicts that daily COVID-19 cases in India could reach up to 1,500,000 by the end of the second week of August. View evidence ↗
- Analysis of weekly trends revealed that the highest number of confirmed cases were typically reported on Tuesdays. View evidence ↗
- India's patterns for confirmed, recovered, active, and death cases were found to be similar to those of other countries globally. View evidence ↗
- The model showed a very high goodness of fit, with an R-squared value of 0.996. View evidence ↗
- The model's unexplained variability was very low, measured at 0.04%. View evidence ↗
- The forecast of a steady rise in infections suggests that existing control measures in India would be insufficient. View evidence ↗
What it means
- The authors recommend implementing extreme preventive and control measures to avoid the predicted surge in cases. View evidence ↗
- The authors conclude that future transmission will depend heavily on government regulations and the promotion of individual self-isolation. View evidence ↗
Visual summary
1 visualsIllustrations explain the paper; they do not show study data.

Prophet Model Components
AI-generated conceptual illustration (A digital representation of a time-series data stream). It explains the idea and does not show study data.
View source evidence ↗Figures & tables
From the original paper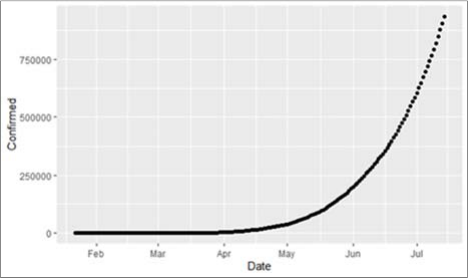 Figure 1
 Table 1
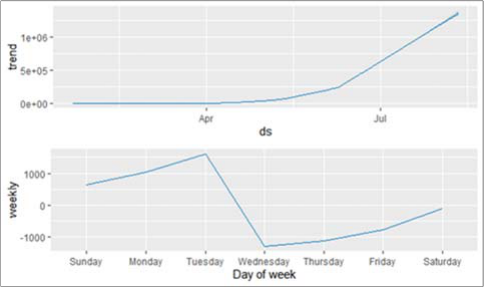 Figure 2
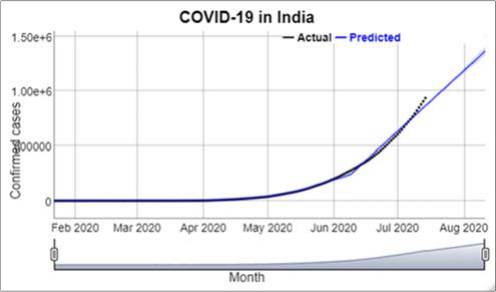 Figure 3
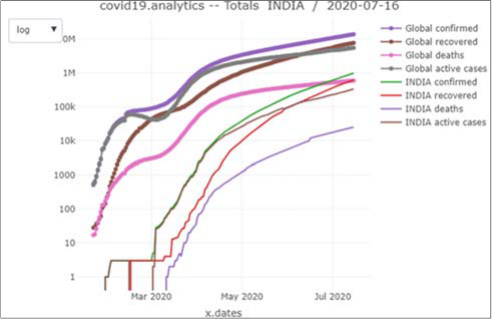 Figure 4
Introduction
In the last weeks of 2019, many local hospitals in Wuhan, China, have reported an unusual number of patients admitted with severe pneumonia without knowing the cause and did not respond to any form of vaccine or medicine [5] . The agent causing the viral-related disease was identified as SARS-CoV-2 because of its similarity to SARS CoV [9] . In addition, these cases increased exponentially, primarily because of human to human transmission, and became a global pandemic. Currently there is no scientific evidence to substantiate the origin of the virus. The rate of contagion and infection spread is expeditious when compared with precedent viral infections. Due to rapid proliferation of COVID-19, many countries including India have announced complete national lock down. As a result, nearly 3.5 billion of the world's population have gone into self-isolation [5] . The World Health Organization (WHO) confirms that the incubation period for COVID-19 outbreak is 14 days. The basic reproduction number "R naught" or R0 is a contagiousness indicator or infectious transmissibility of parasite agents [8] . In epidemic sciences and health literature, R0 is highly encountered to understand a slow outbreak of disease. For instance, When R0 equals one, it implies that an average person affected by the disease could transmit it over a single individual. According to WHO, R0 for COVID-19 is confirmed to be around 2.0-2.5 [8] . For India, R0 was calculated to be about 1.83 in April. The R value went up to 1.19 on 7 July from 1.11 around 26 June, just a week after 'Unlock 2' came in [13] . India currently has the largest number of confirmed cases in Asia, and has the third highest number of confirmed cases in the world with the number of total reported cases crossing the 100,000 mark on 19 May and 200,000 on 3 June. As of 14 July 2020, the Ministry of Health and Family Welfare (MoHFW) has confirmed a total of 906,752, 571,459 (including 1 migration) and 23,727 deaths in the country [6] . Although the recovery rate is north of 50%, active cases have continued to burgeon. Due to the rapid spread of the virus in a short time period, it is necessary to carry out intensive studies of the same. Subsequently, for this, it is important to precisely monitor and glean data regarding cases in order to increase the accuracy of future predictions. There are many studies on the prediction of epidemic diseases, nevertheless producing high quality prediction is not an easy task for most analysts as forecasting is a specialized data science skill requiring substantial experience [6] . Prophet is an open source library published by Facebook that is based on decomposable (trend+seasonality+holidays) models [1] . It is a procedure for forecasting time series data based on an additive model where non-linear trends are fit with yearly, weekly, and daily seasonality, plus holiday effects. This works best with the time series data that have clear seasonal effects [13] . In this study, the COVID-19 cases in India in the next four weeks have been forecasted with Prophet using R analytics platform. The weekly trend of the cases have also been found using the Prophet package. The viral spread in India has also been compared with other countries across the globe. Similar adaptations include Cayir et al. (2018) for forecasting bitcoin using ARIMA and Prophet models [2] , Samal et al.
(2019) for Time Series based Air Pollution Forecasting using SARIMA and Prophet Model [8] and Andrej Baranovskij (2020) [3] has carried out a study using Growth Modeling and Forecasting techniques for the COVID-19 cases with Prophet. This is partly related to the fact that time series forecasting using Prophet has not been explored yet.
Materials and Methods
Prophet is an open source software available in Python and R for forecasting time series data. Prophet is published by Facebook's Core Data Science team. It depends on a contribution model where nonlinear trends are fit with weekly and yearly seasonality and plus holidays. Prophet is strong in dealing with missing data, capturing the shifts in the trend and large outliers. In addition, it arrives at a reasonable estimate of the mixed data without spending manual effort [11] . Purely automatic prediction techniques are not flexible to combine useful assumptions because of their fragility. Furthermore, high quality estimates are not easy to make, requiring special data science skills. All these are determined as working motivations for the Prophet, because it aims to make highquality predictions easier. Prophet is optimized for business forecasts that are observed on Facebook. For example, time, daily, weekly observations of history, within a year, large outliers, trend changes, missing observations and trends with non-linear growth curves [3] . The Prophet framework has its own special data frame to handle time series and seasonality data easily. The data frame needs two basic columns. One of these columns is "ds" and this column stores date time series. The other column is "y" and it stores the corresponding values of the time series in the data frame. Thus, the framework can work on seasonal time series quite efficiently, also providing options to handle seasonality of the dataset. These options are yearly, weekly and daily seasonality. With provision of these options, a data analyst can choose the available time granularity for the forecast model on the dataset [3] .
We use a decomposable time series model with three main components: trend, seasonality, and holidays. They are combined in the following equation: ∈ g(t): piecewise linear or logistic growth curve for modeling non-periodic changes in time series s(t): periodic changes (e.g. weekly/yearly seasonality) h(t): effects of holidays (user provided) with irregular schedules ∈ : error term accounts for any unusual changes not accommodated by the model Using time as a regressor, Prophet aims to fit several linear and nonlinear functions of time as components. The model parameters g(t), s(t), h(t), ∈t are piecewise linear curves for modeling non-periodic changes in time series, periodic changes, the effects of holidays with irregular schedules, and error term accounts for any unusual changes not accommodated by the model respectively. To fit the proposed model with seasonality effects and forecast based on it, it uses a Fourier series which provides a flexible model. Seasonal effects s(t) can be represented as in Equation ( 1), (1), where p represents a regular period [1] .
Results and Discussion
To measure performance of models and to find the best splitting ratios, we have used different metrics for all models. These metrics can be listed as below:
Where the predicted value and y is is the mean of the real values. R2 measures goodness of fitting.
Where N is the number of samples, is predicted value and is the real value.
Where N is the number of samples, is predicted value and is the real value. RMSE, RMSPE and, MAPE are derived from MSE and MAE [2] . The forecast has been performed for the Confirmed COVID-19 cases in India till the second week of August. The raw plot (Fig. 1) indicates the increasing trend in the confirmed COVID-19 cases with each day attaining the maximum number of cases. From (Fig. 2), the weekly pattern for the confirmed cases has been observed with the maximum number of cases reported mostly on Tuesday. The plot diagram (Fig. 3) shows that by the end of the second week of August, more than 1,500,000 cases might be witnessed. The slight variations with the actual and predicted cases after June is primarily due to the relaxations in lockdown norms. The log plot (Fig. 4) depicts that COVID-19 Confirmed, Recovered, Death and Active cases in India follow a similar pattern as that of the other nations across the globe.
The plots have revealed that the trend in cases registered at Indian hospitals has approached its peak in the last two weeks of July. The likely cause being that most people traveling back to their home lands due to few relaxations amidst the lockdown. As a result of this migration of people, viruses could disseminate and expose the symptoms on or after the incubation period. The possible residuals were plotted and statistical analysis was performed using 'R' version 3.6.0. The table also provides the goodness of fit statistics, where the value (0.996) suggests that it could be the best fit for the model. Also there is less scope of improvement, as the unexplained variability is only 0.04%. Further, Mean Absolute Error indicates that the predicted cases are not so far from the observed cases. Performance evaluation of the forecast is estimated in terms of Root Mean Square Error (RMSE), R Squared, and the other error values are found to be within the satisfactory limits. The R Squared value (Table I) shows how close the data are to the fitted regression line, implying a very good fit. The model forecasted a steady rise in the number of infected cases in the days to come. This implies that the country's existing measures will not be sufficient to control the ongoing epidemic. Based on the forecasting model and assuming the current conditions of the COVID-19 outbreak, a rapid and exponential increase in the number of cases is expected.
Conclusion
In the present study, the data have been considered with respect to the confirmed daily cases of COVID-19 in India. Based on the reported data, the predicted daily number of cases using Prophet will reach upto 1,500,000 cases per day in the next four weeks in India. This prediction has been made in the context of existing conditions. However, a few more preventive measures could improve the current situation. Although the death rate is comparatively low, it is certain that the virus spread is significantly increasing day by day. The trend in proliferation of cases evinces that, India being the second most populated country in the world, has controlled the spread of the virus to a greater extent when compared to the other highly populated countries. However, it is important to note that the country is reaching its new peak in maximum number of cases almost every day. Thus, the future of the COVID-19 transmission will depend largely on government regulations and encouragement for the individuals to carry out self-isolation.
Figures and tables from the paper
References
10 in the original paper- Analytics Vidhya. https://www.analyticsvidhya.com/blog/2018/05/generateaccurate-forecasts-facebook-prophet-python-r/
- Aykut Cayir, Bitcoin Forecasting Using ARIMA and PROPHET, 2018. https://www.researchgate.net/publication/329400738_Bitcoin_F orecasting_Using_ARIMA_and_PROPHET Andrej
- Baranovskij COVID-19 Growth Modeling and Forecasting with Prophet, 2020. https://medium.com/katanaml/covid-19-growth-modeling-andforecasting-with-prophet-2ff5ebd00c01
- Chen Z-L, Zhang Q, Lu Y, Guo ZM, Zhang X, Zhang WJ, et al. Distribution of the COVID-19 epidemic and correlation with population emigration from wuhan, China. Chin Med J (Engl), 2020.
- Facebook research. https://research.fb.com/blog/2017/02/prophet-forecasting -at-scale/
- Krishna Rani Samal et al. Time Series based Air Pollution Forecasting using SARIMA and Prophet Model, 2019.
- Nalini Chintalapudi et al. COVID-19 virus outbreak forecasting of registered and recovered cases after sixty day lockdown in Italy: A data driven model approach. Journal of Microbiology, Immunology and Infection. 2020; 53:396-403.
- Peiris JSM, Poon LLM. Severe Acute respiratory Syndrome (SARS). In: Encyclopedia of virology; 2008. https://www.mendeley.com/catalogue/27b71d32-45a5-337094e3-6f02ed0071de/
- Arch Acad Emerg Med. 2020; 8(1):e29.
- Sean J Taylor and Benjamin Letham. Forecasting at scale. The American Statistician, (just-accepted), 2017.
Cited by 12
From OpenAlex, OpenCitations and reference lists read by Scinovex
- Forecasting COVID-19 Pandemic Using Prophet, ARIMA, and Hybrid Stacked LSTM-GRU Models in India ↗
Sweeti Sah, B. Surendiran, Ramasamy Dhanalakshmi, Sachi Nandan Mohanty, Fayadh S. Alenezi, Kemal Polat · Computational and Mathematical Methods in Medicine · 2022
Due to the proliferation of COVID-19, the world is in a terrible condition and human life is at risk. The SARS-CoV-2 virus had a significant impact on public health, social issues, and financial issues. Thousands of individuals are infected on a regular basis in India, which is one of the populations most seriously impacted by the pandemic. Despite modern medical…
❝ 50PDF - Improving prediction of COVID-19 evolution by fusing epidemiological and mobility data ↗
Santi García-Cremades, Juan Morales-García, Rocío Hernández-Sanjaime, Raquel Martínez‐España, Andrés Bueno-Crespo, Enrique Hernández‐Orallo et al. · Scientific Reports · 2021
We are witnessing the dramatic consequences of the COVID-19 pandemic which, unfortunately, go beyond the impact on the health system. Until herd immunity is achieved with vaccines, the only available mechanisms for controlling the pandemic are quarantines, perimeter closures and social distancing with the aim of reducing mobility. Governments only apply these measures for a reduced period, since they involve…
❝ 49PDF - COVID-19 ICU demand forecasting: A two-stage Prophet-LSTM approach ↗
DALTON BORGES, Mariá C. V. Nascimento · Applied Soft Computing · 2022
❝ 42PDF - Time Series Facebook Prophet Model and Python for COVID-19 Outbreak Prediction ↗
Mashael M. Khayyat, Kaouther Laabidi, Nada Almalki, Maysoon Al-zahrani · Computers, materials & continua/Computers, materials & continua (Print) · 2021
COVID-19 comes from a large family of viruses identified in 1965; to date, seven groups have been recorded which have been found to affect humans. In the healthcare industry, there is much evidence that Al or machine learning algorithms can provide effective models that solve problems in order to predict confirmed cases, recovered cases, and deaths. Many researchers and scientists…
❝ 33PDF - Predicting Hospital Beds Utilization For COVID-19 In Telangana, India ↗
Narayana Darapaneni, Mahita GM, Anwesh Reddy Paduri, Sateesh Kumar Talupuri, Vasundhara Konanki, Shruti Galande et al. · IEEE International IOT, Electronics and Mechatronics Conference (IEMTRONICS) · 2021
Our study aims to predict the requirement of isolation beds, oxygen beds, and Intensive Care Unit (ICU) beds in both government and private hospitals for COVID-19 patients in Telangana, India. Using epidemic modeling and time series analysis techniques, we can predict the future daily COVID-19 cases and active cases from historical data of confirmed COVID-19 cases. From the historical data…
❝ 5 - Informational Technology of Analysis and Forecasting of Number of New Cases of Coronavirus SARS-Cov-2 in Ukraine Based on the Prophet Model ↗
В. Б. Мокін, A. V. Losenko, A. R. Yasсholt · Visnyk of Vinnytsia Politechnical Institute · 2020
The article describes the development of information technology for analysis and forecasting of amount of new confirmed cases of the disease for coronavirus "COVID-19" caused by SARS-CoV-2 infection, based on the daily summary data of the current “wave” in Ukraine, and taking into account various holidays and pseudo-holidays. A review of the known models, which acknowledge such anomalies, was conducted…
❝ 5PDF - Information Technology Analysis and Predicting a Multiwave Number of New COVID-19 Disease Based on Prophet Model ↗
В. Б. Мокін, A. V. Losenko, A. R. Yasсholt · Visnyk of Vinnytsia Politechnical Institute · 2020
The article is devoted to the improvement of the information technology previously developed by the authors for the analysis and forecasting of the number of new confirmed cases of the disease for the coronavirus COVID-19 caused by the SARS-CoV-2 infection, using the example of the daily total data of the current "wave" in Ukraine, taking into account various holidays and…
❝ 5PDF - Tourism in Singapore, prediction model using SARIMA and PROPHET ↗
Samya Bouhaddour, Chaimae Saadi, Ibrahim Bouabdallaoui, Fatima Guerouate, Mohammed Sbihi · AIP conference proceedings · 2023
This paper presents the statistical performance measures concerning two models: SARIMA and PROPHET. This study compares the performance measures of the two different forecasting models performed on the same data set. This study consists of data collected from 1961 to 2019 of Singaporean air passengers. The data are analyzed and prepared for time series analysis. Based on the tests, we…
❝ 3PDF - Predicting Dengue Outbreaks in Cagayan de Oro, Philippines Using Facebook Prophet and the ARIMA Model for Time Series Forecasting ↗
Rigene M. Galvez, Dennis A. Tarepe · Journal of Advances in Mathematics and Computer Science · 2023
In terms of public health, dengue fever continues to be an important issue. In recent years, there has been a sharp rise in dengue-related cases all throughout the world. The number of reported cases was consistently rising, especially in the cities of the Philippines. Time series analysis is used in this study to forecast the frequency of dengue by modeling…
❝ 3PDF - Implementation of the Prophet Model in COVID-19 Cases Forecast ↗
Rodiah Rodiah, Eka Patriya, Diana Tri Susetianingtias, Ety Sutanty · ILKOM Jurnal Ilmiah · 2022
One of the steps to understanding this pandemic is to look at the spread of the data by predicting an increase in cases in various countries so that prevention can be carried out as early as possible. One way to see fluctuations in COVID-19 pandemic data is to predict the rate of cases using forecasting methods so that conclusions can…
❝ 2PDF - Forecasting of a complex phenomenon using stochastic data-based techniques under non-conventional schemes: The SARS-CoV-2 virus spread case ↗
Daniel E. Mendoza, Ana Ochoa‐Sánchez, Esteban P. Samaniego · Chaos Solitons & Fractals · 2022
Epidemics are complex dynamical processes that are difficult to model. As revealed by the SARS-CoV-2 pandemic, the social behavior and policy decisions contribute to the rapidly changing behavior of the virus' spread during outbreaks and recessions. In practice, reliable forecasting estimations are needed, especially during early contagion stages when knowledge and data are insipient. When stochastic models are used to…
❝ 1PDF - Short-Term Holt Smoothing Prediction Model of Daily COVID-19 Reported Cumulative Cases ↗
Ousseynou Mbaye, Siriman Konare, Mouhamadou Lamine Ba, Aba Diop · Lecture notes of the Institute for Computer Sciences, Social Informatics and Telecommunications Engineering · 2021
❝ 1