
Research article · 2020 · Full text
International Journal of Statistics and Applied MathematicsRelationship between selected macroeconomic variables and S&P BSE index: A statistical analysis
Volume 5(1) · Pages 14–23
Research areasMarket Dynamics and VolatilityMonetary Policy and Economic ImpactStock Market Forecasting Methods
Abstract
Author-writtenThe relationship between stock market and various macroeconomic variables has always been discordant. Studies indicate that stock market is influenced by changes in various macroeconomic variables. Some of which affect the stock market positively while others have an adverse impact. This article examines the impact of five macroeconomic variables i.e. Exchange Rate, Inflation, Interest Rate, Money Supply and Consumer Price Index on BSE S & P index of India. It covers a period of 60 months from October, 2014 to September, 2019. Statistical Package for Social Sciences (SPSS) is used to test the Descriptive Statistics, Correlation Matrix and Regression analysis (Goodness of Fit, Variance Inflation Factor, Coefficient of Determination and Durbin – Watson d-Statistic). Analysis results indicate that S & P BSE value has a positive correlation with all independent variables except for Interest Rate; whereas Interest Rate is seen to have a negative correlation with all variables. Money Supply and Consumer Price Index have a positive relation with Exchange Rate and negative correlation with Interest Rate. VIF of all the independent variables, except for Money Supply and Consumer Price Index are within the acceptable limit and influence of independent variables on the S & P BSE value appears to be very strong.
Summary
Source-checkedPlain-language reading of the full paper, prepared with AI and checked against the text. Each point links to the authors' own words.
Why it matters
- The stock market is influenced by various macroeconomic variables, which can have either a positive or negative impact on its performance. View evidence ↗
- The Indian stock market is critical to the growth of the national economy, meaning its movements directly affect overall economic performance. View evidence ↗
- Understanding the relationship between stock prices and macroeconomic variables is important for both academic research and the creation of economic policy. View evidence ↗
The question
- The study aims to determine the relationship between the S&P BSE index value and specific macroeconomic variables using statistical analysis. View evidence ↗
What they did
- The researchers analyzed the impact of five variables, Exchange Rate, Inflation, Interest Rate, Money Supply, and Consumer Price Index, on the S&P BSE index over a 60-month period from October 2014 to September 2019. View evidence ↗
- The study utilized SPSS software to perform descriptive statistics, correlation matrices, and regression analyses, including tests for goodness of fit and multicollinearity. View evidence ↗
- Monthly closing prices for the stock market and the selected macroeconomic variables were sourced from a Bloomberg terminal. View evidence ↗
What they found
- The S&P BSE index showed a positive correlation with all studied macroeconomic variables except for the Interest Rate. View evidence ↗
- The Interest Rate exhibited a negative correlation with all other variables in the study. View evidence ↗
- The regression model demonstrated a strong goodness of fit, with an F-value of 250.00 and a significance value of 0.00. View evidence ↗
- Multicollinearity was present for Money Supply (VIF = 26.716) and Consumer Price Index (VIF = 39.662), as both exceeded the acceptable limit of 10. View evidence ↗
- The derived regression equation shows that the S&P BSE value is negatively affected by the Exchange Rate (-691.79) and Inflation (-20.41), and positively affected by Interest Rate (5005.80), Money Supply (0.26), and CPI (533.00). View evidence ↗
- The five selected macroeconomic variables explain 95.5% of the variation in the S&P BSE index value, as indicated by the adjusted R-squared value. View evidence ↗
What it means
- The authors conclude that the S&P BSE index is significantly influenced by the selected macroeconomic variables. View evidence ↗
- The authors recommend that policymakers design strategies to control the rapid growth of the money supply. View evidence ↗
Visual summary
1 visualsIllustrations explain the paper; charts are replotted from the paper's own table values.
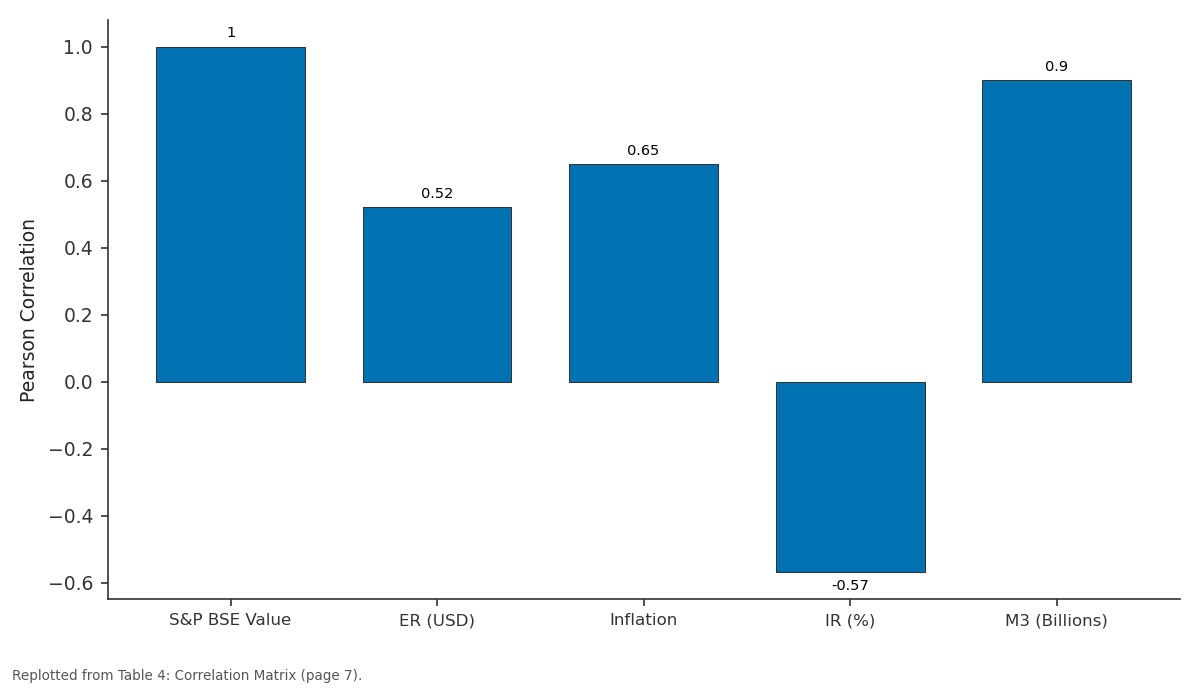
S&P BSE Value: S&P BSE Value vs ER (USD) vs Inflation vs IR (%) vs M3 (Billions)
Replotted from Table 4 (page 7) of the original paper. Every bar is the paper's own table value.
View source evidence ↗Figures & tables
From the original paper Table 1
 Table 2
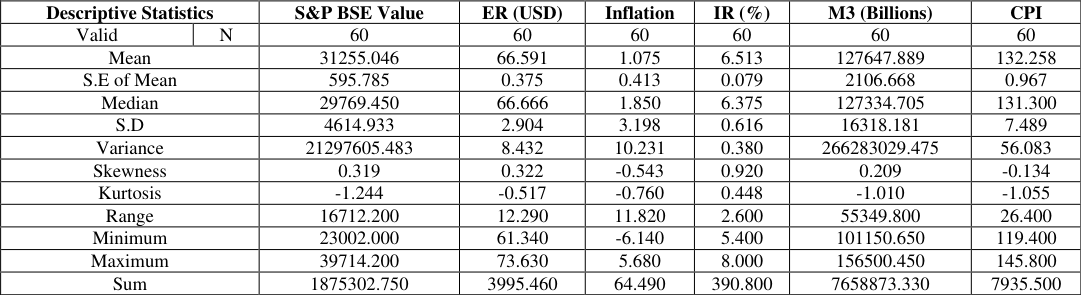 Table 3
 Table 4
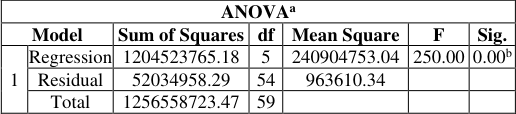 Table 5
 Table 6
 Table 7
Introduction
The Indian stock market had seen various up-down since 1991, after the government implemented the LPG, i.e., Liberalization, Privatization and Globalization. According to the Economic Survey 2018-19, India's growth rate is forecasted to be between 7.0 -7.5 percent for the FY19 as compared to 6.80 percent for FY18 and 7.20 in FY17. The government has planned on achieving a fiscal target of 3.40 percent of GDP and 44.50 percent debt to GDP ratio with the 3.40 percent inflation for the FY18. Over the years, India has attracted many investments by different economies and a large consumption base. With this growth rate, India also became the fastest growing economy in FY18. Stock market is a place where investors, whether Indians or foreigners can invest or take the funds for capital appreciation. Their decision to invest or withdraw the funds depends upon the numerous factors. For this cause Indian stock market plays a vital role in the growth of Indian economy and every movement on it puts an impact on the performance of the economy. The stock prices reflect all information about the stocks and also the expectations of the future performances of corporate sector. As a result, if stock prices reflect these assumptions in real, then it should be used as a major indicator for the economic activities (Ray S, 2012) [1] . Hence the dynamic relationship between stock prices and macroeconomic variables contains academic interest as well as policy implications. Macroeconomics is the analysis of the nation's economy as a whole. It scrutinizes the cyclical movements and trends exists in economy such as Gross Domestic Production, Unemployment, Inflation, Money Supply, Budget Deficits, International Trade and Exchange Rate, etc. The various schools of thoughts like Classical theory by Adam Smith, David Ricardo, Thomas Robert Malthus and John Stuart Mill, Keynes theory by John Maynard Keynes, New Classical theory, New Keynesian theory and New Growth theory developed their own views about the role of macroeconomic variables in economy by considering different assumptions. But, they accepted that macroeconomic variables are the most remarkable variables and Government's can't make their policies, rules and regulations without contemplating them.
So, macroeconomic variables are the key indicators to show the prevailing trends in the economy as well as stock market.
Bombay stock exchange (BSE): A bird's eye view
Established in 1875, the BSE (formerly known as Bombay Stock Exchange Ltd.) is Asia's oldest stock exchange was founded by an influential businessman Premchand Roychand, located at Dalal Street, Mumbai. The BSE is the world's 10th largest stock exchange with an overall market capitalization of more than $2.2 trillion. Today, BSE is the world's number one exchange in the world in terms of the number of listed companies (over 4900). It is the world's 5th most active in terms of number of transaction handle through its electronic trading system. The BSE Index, SENSEX, is India's first and most popular stock market benchmark index. Exchange traded funds (ETF) on SENSEX, are listed on BSE and in Hong Kong. SENSEX, first compiled in 1986, was calculated on a "Market Capitalization-Weighted" methodology of 30 component stocks representing large, well-established and financially sound companies across key sectors. SENSEX is being calculated on a free-float market capitalization methodology.
The free-float market capitalization-weighted methodology is a widely followed index construction methodology on which majority of global equity indices are based; all major index providers like MSCI, FTSE, STOXX, S&P and Dow Jones uses the free float methodology.
Review of Literature
The various researchers did a remarkable work to evaluate the association between changes in macroeconomic variables and stock market returns in India by using different tools and techniques. Hemavathy P & Gurusamy S (2016) [2] , Poornima DS & Ganeshwari M (2016) [3] studied the casual relationship of NSE and exchange rates. By using Granger causality test, exchange rates have a unidirectional casual relationship with stock price in the short run and the author referred as a vibrant connection. But Megaravalli AV & Sampagnaro G (2018) [4] found that Indian stock market have a long tern association with the inflation and bidirectional causality from Indian stock market to exchange rate and the stock market is somewhat dependent on the macroeconomic variables of the economy (Pilinkus D, 2010) [5] . Box-Jenkins ARIMA technique was used by Gay Jr. RD (2016) [6] to analyse both the positive and negative correlation between the stock market with exchange rate and oil price respectively. Benaković D & Posedel P (2010) [7] analyses the strength of association of independent by Arbitrage Pricing Theory (APT). He analysed the market index and proved that, interest rates, oil prices and industrial production have a positive impact. Aanchal (2017) [8] found that all the independent variables and market data were non-stationary in nature. Sometimes it was also found that both the independent and the dependent variable have no relation. Melicher RW (1974) [9] examines link between various risk factors and data of these firms by CAPM model to ascertain the expected returns on any asset with the given sensitivity of the asset and the returns of the market. The sensitivity of any stock is found by dividing the covariance of the asset with the market return; by the variance on market returns. Ramanujam V & Leela L (2011) [10] examines the effect of various macroeconomic variables, using the Wald test and the results were proved that these variables have a long term effect on the stock market. Bhattacharya B and Mukherjee J (2002) [11] , Nath GC and Samantha GP (2002) [12] found the causal relationship between stock prices and macroeconomic factors in India by Toda and Yamamoto. It was found that industrial production affects significantly the stock prices. Similar results are also obtained by Chakravarty S (2005) [13] , but Johansen and Juselius's cointegration test pointed out, at least one cointegration vector and long-run relationships between BSE Sensex with index of industrial production and call money rate (Dasgupta R, 2012) [14] . Positive relationship between industrial production and stock prices was examined by using Granger causality test and observed uni-directionality from industrial production to stock prices in India. The results of Chowan PK et al. (2000) [15] are supported by the similar findings of Sahu NC & Dhiman HD (2011) [16] . They have tried to explore the causal relationship between stock market indicator and macroeconomic variables of India by using correlation, regression and Ganger causality techniques. Sarkar P (2005) [17] examined the relation between growth and capital accumulation exists in case of India. Maken et al. (2012) [18] found that, there is a positive relation between FII and Sensex, call rate and Sensex, whereas exchange rate and Sensex shows a negative relation by using Granger causality test. However, the studies of Kanakaraj A et al. (2008) [19] , Ray S (2012) [1] and Naik PK & Padhi P (2012) [20] and others have found significant relationship between macroeconomic variables and stock returns. They have tried empirically to explore upon and answer that if the recent stock market boom can be explained in the terms of macroeconomic fundamentals and have concluded by recommending a strong relationship between the two. Johansen's approach of co-integration and Toda -Yamamoto Granger causality test was used by Ahmed S (2008) [21] to investigate the relationship between stock prices and the macroeconomic variables using quarterly data whereas, Singh D (2010) [22] attempted to explore the causal relation between the BSE Sensex and three key macroeconomic variables of Indian economy by using correlation, unit root stationarity tests and Granger causality test. Results showed that IIP was having bilateral causal relationship with BSE Sensex, while WPI was found to be related to stock market unidirectional. Srivastava A (2010) [23] demonstrated the effect of macroeconomic variables on the Indian stock market by using Jhonsen's cointegration analysis and Vector Error Correction mechanism. It was concluded that IIP, WPI and Interest Rate are the most effecting variables in the long run (Pal K and Mittal R, 2011 & Naka A, Mukherjee TK and Tufte D, 2001) [25] whereas, macroeconomic variables and BSE 500 were cointegrated with each other and bilateral causality exists during the World Financial Crisis (Hojatallah G and Ramanarayana CS, 2011) [26] . Hosseini MA (2011) [27] investigated the nature of the causal relationships between the Bombay Stock Exchange's stock prices and the key macroeconomic variables. The results of the study revealed both long-run and short-run linkages between the macroeconomic variables and stock market indices by applying Augmented Dickey Fuller (ADF) unit root test, Johansen-Juselius Multivariate Cointegration and Vector Error Correction Model techniques. The study also confirmed the evidence of causality among the variables (Patel S, 2012) [28] . Ljung-Box Q test, Breusch-Godfrey LM test, Unit Root test and Granger Causality test was employed by Tripathy N (2011) [29] to examined the weak form market efficiency and casual relationship between the selected macroeconomic variables and the Indian stock market. Pethe A and Karnik A (2000) [30] have taken monthly data over the period of Apr 1992 to Dec 1997 to conduct a study on relationship between Indian stock market and macroeconomic factors using error correction model and co-integration. Their study showed that the condition of economy and the stock market prices don't show a long run relationship. The review indicated that, the relationship between macroeconomic variables and stock market can be divided into three groups. Some researchers found that there exist a significant relationship between macroeconomic variables and stock market. Some found that, there is no significant relationship between macroeconomic variables and stock market, while other found that some macroeconomic variables are significant and some are not (Barakat MR et al., 2016 and Joshi P, 2015) [32,33] . According to the past researches, it can be concluded that many macroeconomic factors combined affect the stock market and almost every Indian research was done on the two major indices of Indian Stock Market, i.e., CNX Nifty and BSE Sensex. Therefore, it is viable to use BSE Sensex for analysing the effect of macroeconomic variables on the stock market of India. Based on the Literature Review one of the major gaps observed from the studies was the time period of which the stocks were analysed. The study conducted before by various scholars and researchers was limited on the ground of shorter time span which could have been studied for a longer time period in order to have a clear picture and to obtain more precise results to know the impact of the selected macroeconomic variables on the stock prices.
Objective of the study
Objective of the study are to determine the relationship between stock market value and selected macroeconomic variables through selected statistical methods. The present study is focused on the following objectives. To measure the movement of selected macroeconomic variables and stock market values, and To study the relationship between selected macroeconomic variables and stock market values.
Methodology
The study examines the impact of selected macroeconomic variables on stock market values, while other variables assumed to be constant. Data have been analysed through Descriptive Statistics, Correlation Matrix and Regression analysis (Goodness of Fit, Variance Inflation Factor, Coefficient of Determination and Durbin -Watson d-Statistic).
Variables description
For the purpose of the above study, secondary data has been used to analyse the effect and the influence of macroeconomic variables on stock prices of India. The closing prices of the stock market and macroeconomic variables are gathered on a monthly basis from Bloomberg terminal for the study. The selected macroeconomic variables are taken from various websites and their symbol, unit of measurement and proxy of each variable are illustrated in Table -2.
Exchange rate
An exchange rate is the cost of a country's cash as far as money and has two segments, the country's own money and foreign currencies can be cited either straight forwardly or roundabout way (Garg K & Kalra R, 2018) [33] . The whole procedure of sending out and bringing in procedure of any nation is entirely subject to the exchange rate of money value of the country. Gunasekarage A et al. (2004) [35] and Adam MA & Tweneboah G (2009) used USD (United States Dollar) as a proxy for exchange rate. It is also affect the net exports (Osamwanyi IO & Evbayiro-Osagie EL, 2012) [37] . Vejzagic M & Zafarat H (2013) found that changes in exchange rate would have an impact on firm's competitiveness as it affects the price of foreign currency, leading to changes in the firm's profit and equity which in return will lead to price adjustments in the stock market.
Inflation
Inflation is an ascent in cost of price of a few things over a period of time. Everyone of the index is made in a particular way with a specific year as the base year and they consider the value changes over a year. According to Pearce DK & Roley VV (1985) [39] , it has been calculated from Wholesale Price Index (WPI). Talla JT (2013) [40] used Consumer Price Index is a proxy for inflation. He states that inflation can affect stock market either positively or negatively. He added that unexpected and expected inflation determines the direction of the relationship between stock market and inflation.
Interest rate
The rate of interest is the rate of exchange between future and current consumption (Reilly F & Brown K, 2003) [41] . When borrowing money and receiving on it on their saving difference is accepted by people for accept to pay, which the author referred to as the pure time value of money. Moreover, if the investor expects an increase in price (Rise in inflation), he/she will demand a higher rate of return, that is, pure time value of money plus expected inflation rare. Joseph NL & Vezos P (2006) [34] stated stat, it is the difference between two time factor t and (t-1).
Money supply
Walter J (1989) [42] argued that monetary aggregates can be used to measure any nation's money stock. He also stated that in order to forecast the changes in economic activities, inflation and interest rate analysts need to study the relationship between the monetary measures and other macroeconomic variables. The components of money supply are drawn from the liability side at the balance sheet of the banking sector. Kumar R (2013) [43] and Barakar MR et al.
(2016) used M3 as a proxy of money supply and stated that there is a strong relationship between money supply and stock prices.
Consumer price index
The Consumer Price Index (CPI) is a measure that examines the weighted average of prices of a basket of consumer goods and services, such as transportation, food, and medical care. It is calculated by taking price changes for each item in the predetermined basket of goods and averaging them. Schwert GW (1981) examined that stock market responds negatively to the announcement of unanticipated inflation in the CPI. He reported that there are at least three theories that predict a positive relation between volatility and volume. First if investors have heterogeneous beliefs, new information causes both the price changes and the trading. Second, if some investors use price movements as information on which to make trading decisions, large price movements cause large trading volume. Finally, if there is short term "price pressure" due to illiquidity in secondary trading markets; large trading volume that is predominantly either buy or sell orders cause price movements. Whereas, using hourly data, Jain PC (1988) [45] found that CPI announcement surprises have significant negative effects on stock prices and trading volume was not associated with surprises in the CPI announcements and the results were consistent with the hypothesis that market participants interpret the surprises in announcements in an analogous manner and do not engage in additional trading. By using monthly data Chen NF, Roll R and Ross SA (1986) [46] found that inflation related variables were highly significant in the 1968-77 periods and insignificant both earlier and later. Smirlock M & Yawitz Y (1985) [47] found a significant positive response of long -term rates to unexpected inflation.
Comparison between macroeconomic variables and stock market return
Many academic researchers, financial and industry analysts and practitioners have tried to establish the relationship between macroeconomic variables and stock market movements from the past decades. They have done several empirical and descriptive studies to check the effect of macroeconomic variables on stock prices or vice versa and the existing relationship between the two. To help those who are interested in the stock market either government officials, investors or academics, a stock market index was invented as a tool in order to evaluate the decision of portfolio managers and investment advisors. According to Rafique A et al. (2013) [48] , the stock performance is measured through movement in the index. The fluctuations in the index are affected by macroeconomic, social, political and the firm's specific variables. In this work, we established some empirical proof relating designated macroeconomic variables to stock market return.
Exchange rate and stock market return
According to portfolio management, any inflow or outflow of foreign capital will be a result of changes in stock prices. When stock prices increases, they will attract towards foreign capital and when price decreases, they will be less appealing to foreign investors, which will lead to a corporate wealth (Vejzagic M & Zarafat H, 2013) [38] . It is also creation of country's external business and straightly related to balance of payment. The balance of payment deficit and the intensity of external reserve frequently influence exchange rate (Oaikhena H.E, 2002) [49] .
Inflation and stock market return
Chandra P (2004) [50] stated the effect of inflation rate towards the corporate sector has been found to be bi-directional. For unexpected inflation, an increase in general price level leads to the increase in cost of living, which forces people to invest less and relocate their resources for consumption. When inflation increases, nominal interest rate also increases. This will reduce the present value of the income generated by firms as the discount rate used to determine the intrinsic values of stocks went up. This will force stock prices to decrease (Amadi SN & Odubo TD, 2002) [51] . If the price elasticity of demand for the firm's product is high, a rise in inflation that leads to an increase in price will cause a decline in a firm's sale and net income and thus its stock price (Fama EF, 1981) [52] .
Interest rate and stock market return
Interest proportion varies with time, inflation and output of capital among others (Chandra P, 2004) [50] . According to Kelvin S (2000) [53] , the interest changes in systematized and synthesized financial segment of the economy are focused within anticipated range over monetary strategy. Alam MN & Uddin MGS (2009) [54] argued that, interest rate on deposit has a negative relationship with stock prices. When rates on deposit in the bank increase, people will redirect their money from capital market to the banks and this will lead to decrease in demand of shares stock prices, and vice versa.
Money supply and stock market return
Monetary aggregates can be used to measure any nation's stock (Walter J, 1989) [42] . In order to forecast the changes in stock prices, inflation and interest rates, researcher need to find out the relationship between the monetary measures and other macroeconomic variables. In the short run disequilibrium, supply and demand of capital might occur and it will change the ease of tightness of capital market (a decrease in the growth rate of money supply will results in decline in supply of capital and an increase in interest rate). Sudden changes in money supply among other variables might be a cause of this disequilibrium through affecting the normal risk free rate (Reilly F & Brown K, 2003) [41] .
Consumer price index and stock market return
Fama EF, (1981) [52] stated that negative stock returns with inflation are defined by the positive connection between stock returns and basic determinants like cost of capital, the average real rate of return capital and productivity of a firm. Fieldstein MS (1980) [54] also confirmed the effect of inflation on stock prices through corporate income taxation, cost depreciation and taxation of normal capital gains, since the depreciation is determined based on historical cost which is not affected by the increase in inflation rate. The depreciation is less then it is supposed to drive the real taxable earnings to go up (Hong H, 1977) [56] .
Analysis and interpretation 5.1. Descriptive statistics
Various descriptive statistics are calculated of the variables under study in order to describe the basic characteristics of these variables. The deviation is not regarded significant at 5% level of significance. It also enables us to determine the probable limits within which the population parameter may be expected to lie. So the descriptive statistics shows that the values are not normally distributed about its mean and variance or in other word we can says no randomness in data and therefore, is sensitive to periodic change and speculation.
Correlation matrix
It is found that S & P BSE value has a positive correlation with all independent variables except for IR (%). According to the correlation matrix obtained in the Table -4, it can be seen that various independent variables are inter-correlated to each other but some are very significant and can be used in further analysis. and negative correlation with IR (%).
Regression analysis 5.3.1 Goodness of fit
Levin RI & David SR (2005) [57] states that in multiple regression, F-test explains the level of influence of independent variable on dependent variable. If the value of significance is higher the significance F then it indicates that Independent variable has influence on dependent variable and vice versa. The output of Table-5 presents an analysis of variance (ANOVA). A good regression model generates high level of F value and very low level of F-significance value. In line with the thumb rule, the F-value is very high (250.00) and its significance value is the lowest (0.00) at 5 percent level of significance. This signals the goodness of fit of the model.
Variance inflation factor
Multicollinearity has been considered as a critical factor while execution of multiple regression analysis. Correlation among independent variables is considered as the main reason behind existence of multicollinearity. Results of the analysis would be biased, if we ignore the multicollinearity in the research data. VIF (Variance Inflation Factor) has been used as a multicollinearity diagnostic technique. VIF indicates whether independent variables have any correlation among themselves or not. If the value of VIF is more than 10 then it indicates the existence of multicollinearity in the data and if the value of VIF is less than 10 then it indicates that data is free from multicollinearity.
These coefficients indicate the direction of relationship between independent and dependent variables. These coefficients also tell us to what degree each predictor affects the outcome when the effects of all other predictors are held constant. The signs of coefficients of all the independent variables except IR (%) and CPI are as per theoretical predictions. Among the five independent macroeconomic variables IR (%) and CPI appears to have very high influence on S & P BSE value. As the IR (%) and CPI are increases by 1 unit, the S & P BSE value increases by 5005.8 and 533.0 units respectively, subject to the condition that, other variables are constant. This positive relationship appears to be unusual. The negative sign implies that stock index performances would decrease by 691.79 and 20.41 respectively for every unit increase in ER (USD) and Inflation subject to other variables are constant.
Coefficient of determination & Durbin -Watson dstatistic
The impact of macroeconomic variables on the S & P BSE value has been captured statistically by the regression model. From the model summery presented in Table - The combined influence of independent variables on the S & P BSE value appears to be very strong. Field A (2013) [58] states that R 2 represent the percentage of variance in the outcome that are explained by the independent variables or predictors. As shown in Table-7, the R 2 = 0.959, which implies that the macroeconomic variables account for 95.9% variation in the S & P BSE value? However, in a multiple regression model adjusted R 2 is the more reliable explanator of dependent variable thanR 2 . In the above model, adjusted R 2 is 0.955, which implies that 95.5% of the variation in S & P BSE is explained by the five macroeconomic variables, viz. CPI, Inflation, ER (USD), IR (%) and M3 (Billions). Only 4.5% changes in S & P BSE is caused by the external factors outside the model. Thus, S & P BSE is highly sensitive to the variations in CPI, Inflation, ER (USD), IR (%) and M3 (Billions).
Conclusion
The prime aim of the study was to examine factors influencing S & P BSE behaviour through selected macroeconomic variables. We expected a relationship between selected macroeconomic variables and stock indices performances as proxy for Indian Capital Market. The relationship was tested by using Descriptive Statistics, Correlation Analysis and Regression Analysis (Goodness of Fit, Variance Inflation Factor, Coefficient of Determination and Durbin -Watson d-Statistic) with the past 60 months data and we found that stock market indices are influenced by selected macroeconomic variables. In line with this, the grades also suggest the need for policy makers to design policies that will help to curtail rapid growth in money supply. There is also the need to formulate policies that are capable of enhancing the national income of the country. Export policies should be encouraged, as they rise to issue of balance of payments, their deficit or surplus and also responsible for the appreciation or otherwise of a nation's foreign exchange.
Figures and tables from the paper
| Sl. No. | Variable | Symbol | Data Source | Unit of Measurement | Proxy |
|---|---|---|---|---|---|
| 1 | Exchange Rate | ER | www.rbi.org.in | In Rs. | USD |
| 2 | Inflation | Inflation | www.mospi.gov.in | Rs, (%) | WPI |
| 3 | Interest Rate | IR | www.rbi.org.in | Rs. (%) | Deposit |
| 4 | Money Supply | M3 | www.bankbazaar.com | Rs in Billions | M3 |
| 5 | Consumer Price Index | CPI | www.rbi.org.in.com | In Rs. | Combined |
Table text extracted from the original PDF; superscript letters are shown inline. The original table image is below.
View original table image
| Descriptive Statistics | — | S&P BSE Value | ER (USD) | Inflation | IR (%) | M3 (Billions) | CPI |
|---|---|---|---|---|---|---|---|
| Valid | N | 60 | 60 | 60 | 60 | 60 | 60 |
| Mean | 31255.046 | 66.591 | 1.075 | 6.513 | 127647.889 | 132.258 | |
| S.E of Mean | 595.785 | 0.375 | 0.413 | 0.079 | 2106.668 | 0.967 | |
| Median | 29769.450 | 66.666 | 1.850 | 6.375 | 127334.705 | 131.300 | |
| S.D | 4614.933 | 2.904 | 3.198 | 0.616 | 16318.181 | 7.489 | |
| Variance | 21297605.483 | 8.432 | 10.231 | 0.380 | 266283029.475 | 56.083 | |
| Skewness | 0.319 | 0.322 | -0.543 | 0.920 | 0.209 | -0.134 | |
| Kurtosis | -1.244 | -0.517 | -0.760 | 0.448 | -1.010 | -1.055 | |
| Range | 16712.200 | 12.290 | 11.820 | 2.600 | 55349.800 | 26.400 | |
| Minimum | 23002.000 | 61.340 | -6.140 | 5.400 | 101150.650 | 119.400 | |
| Maximum | 39714.200 | 73.630 | 5.680 | 8.000 | 156500.450 | 145.800 | |
| Sum | 1875302.750 | 3995.460 | 64.490 | 390.800 | 7658873.330 | 7935.500 |
Table text extracted from the original PDF; superscript letters are shown inline. The original table image is below.
View original table image
| Correlation Analysis | — | S&P BSE Value | ER (USD) | Inflation | IR (%) | M3 (Billions) | CPI |
|---|---|---|---|---|---|---|---|
| Pearson Correlation | S&P BSE Value | 1.00 | 0.52 | 0.65 | -0.57 | 0.90 | 0.86 |
| ER (USD) | 0.52 | 1.00 | 0.45 | -0.55 | 0.75 | 0.74 | |
| Inflation | 0.65 | 0.45 | 1.00 | -0.61 | 0.69 | 0.73 | |
| IR (%) | -0.57 | -0.55 | -0.61 | 1.00 | -0.81 | -0.86 | |
| M3 (Billions) | 0.90 | 0.75 | 0.69 | -0.81 | 1.00 | 0.98 | |
| CPI | 0.86 | 0.74 | 0.73 | -0.86 | 0.98 | 1.00 |
Table text extracted from the original PDF; superscript letters are shown inline. The original table image is below.
View original table image
| ANOVAa | — | — | — | — | — | — |
|---|---|---|---|---|---|---|
| Model | Sum of Squares | df | Mean Square | F | Sig. | |
| 1 | Regression | 1204523765.18 | 5 | 240904753.04 | 250.00 | 0.00b |
| Residual | 52034958.29 | 54 | 963610.34 | |||
| Total | 1256558723.47 | 59 |
Table text extracted from the original PDF; superscript letters are shown inline. The original table image is below.
View original table image
| VIF Table | — | Unstandardized Coefficients | — | Standardize Coefficients | t | Sig. | Co linearity Statistics | — |
|---|---|---|---|---|---|---|---|---|
| B | S.E | Beta | Tolerance | VIF | ||||
| 1 | (Constant) | -59085.51 | 11370.47 | -5.196 | 0.000 | |||
| ER (USD) | -691.79 | 68.63 | -0.435 | -10.080 | 0.000 | 0.411 | 2.432 | |
| Inflation | -20.41 | 60.25 | -0.014 | -0.339 | 0.736 | 0.440 | 2.274 | |
| IR (%) | 5005.80 | 434.28 | 0.668 | 11.527 | 0.000 | 0.228 | 4.386 | |
| M3 (Billions) | 0.26 | 0.040 | 0.923 | 6.451 | 0.000 | 0.037 | 26.716 | |
| CPI | 533.00 | 107.47 | 0.865 | 4.959 | 0.000 | 0.025 | 39.662 |
Table text extracted from the original PDF; superscript letters are shown inline. The original table image is below.
View original table image
| Model | R | 𝐑𝟐 | Adj. 𝐑𝟐 | S.E of Estimate | Change Statistics | — | — | — | — | Durbin Watson |
|---|---|---|---|---|---|---|---|---|---|---|
| 𝐑𝟐 Change | F Change | df1 | df2 | Sig. F Change | ||||||
| 1 | 0.979a | 0.959 | 0.955 | 981.636 | 0.959 | 250.002 | 5 | 54 | 0.000 | 1.476 |
Table text extracted from the original PDF; superscript letters are shown inline. The original table image is below.
View original table image
References
58 in the original paper- Ray S. Testing Granger Causal Relationship between Macroeconomic Variables and Stock Price Behaviour: Evidence from India, Advances in Applied Economics and Finance. 2012; 3(1):470-481.
- Hemavathy P, Gurusamy S. Testing the Causality and Cointegration of Gold Prices and NSE S&P CNX NIFTY: Evidence from India, Amity Global Business Review, 2016.
- Poornima DS, Ganeshwari M. Relationship between Exchange Rates and Stock Market Index: Evidence from the Indian Stock Market, International Journal of Science and Research (IJSR). 2016; 5(10):16-18.
- Megaravalli AV, Sampagnaro G. Macroeconomic indicators and their impact on stock markets in ASIAN 3: A pooled mean group approach, Cogent Economics & Finance. 2018; 6(1):1-14.
- Pilinkus D. Macroeconomic indicators and their impact on stock market performance in the short and long run: The case of the Baltic States, Technological and Economic Development of Economy. 2010; 16(2):291304.
- Gay Jr. RD. Effect of Macroeconomic Variables on Stock Market Returns for Four Emerging Economies: Brazil, Russia, India and China, International Business & Economics Research Journal. 2016; 15(3):119-126.
- Benaković D, Posedel P. Do macroeconomic factors matter for stock returns? Evidence from Estimating a multifactor model on the Croatian market, Business System Research. 2010; 1(2):39-46.
- Aanchal. Impact of Macroeconomic Variables on Indian Stock Market, SSRG International Journal of Economics and Management Studies. 2017; 4(5):77-82.
- Melicher RW. Financial factors which influence Beta Variations within a homogenous Industry Environment, Journal of Financial and Quantitative Analysis. 1974; 9(2):231-241.
- Ramanujam V, Leela L. Factors affecting the movement of Stock Market: Evidence from India, Indian Journal of Applied Research. 2011; 4(6):1-4.
- Bhattacharya B, Mukherjee J. The nature of the causal relationship between stock market and macroeconomic aggregates in India: An empirical analysis, In 4th Annual Conference on Money and Finance, Mumbai, 2002, 1-21.
- Nath GC, Samantha GP. Dynamic Relation between Exchange Rate and Stock Prices: A case for India, Available at: https://nseindia.com/content/press/feb2003c.pdf, 2002, 1-8.
- Chakravarty S. Stock market and macroeconomic behaviour in India, Institute of Economic Growth, Delhi, Available at:http://citeseerx.ist.psu.edu/viewdoc/download;jsessioni d=239BDB6 B1CDC68F777B60C9325E5779? Doi =10.1.1.1 12.5953 &rep=rep1&type=pdf, 2005, 1-15.
- Dasgupta R, Long-Run, Short-Run. Relationships between BSE Sensex and Macroeconomic Variables, International Journal of Finance and Economics. 2012; 95:135-150.
- Chowan PK et al., Volatility in Indian Stock Market, Xavier Institute of management, 2000.
- Sahu NC, Dhiman HD. Correlation and causality between stock market and macro-economic variables in India: An empirical study. International Conference on E-business, Management and Economics, Hong Kong: IACSIT Press, 2011; 3:281-284.
- Sarkar P. Stock Market, Capital Accumulation and Growth in India since, 1950, 2005, Paper presented at International Conference on The Indian Economy in the Era of Financial Globalisation, Maison des Sciences de l' Homme, Paris on 28 and 29 September, 2006, 1-21.
- Makan C, Ahuja AK, Chauhan S. A study of the effect of macroeconomic variables on stock market: Indian perspective. Available at: https://mpra.ub.unimuenchen.de/43313/1/AStudyof the_Effect of Macroeconomic Variables _on_Stock_Market.pdf, 2012, pp. 1-43.
- Kanakaraj A, Singh BK, Alex D. Stock Prices, Micro Reasons and Macro Economy in India: What do data say between 1997-2007, Fox Working Paper 3, 2008, 1-17.
- Naik PK, Padhi P. The impact of macroeconomic fundamentals on stock prices revisited: Evidence from Indian data, Eurasian Journal of Business and Economics. 2012; 5(10):25-44.
- Ahmed S, Aggregate economic variables and stock market in India, International Research Journal of Finance and Economics. 2008; 14:14-64.
- Singh D, Causal relationship between macroeconomic variables and stock market: A case study for India, Pakistan Journal of Social Sciences. 2010; 3(2):263-274.
- Srivastava A. Relevance of Macro Economic factors for the Indian Stock Market, Decision. 2010; 37(3):69-89.
- Pal K, Mittal R. The impact of macroeconomic indicators on Indian capital markets, Journal of Risk Finance. 2011; 12(2):84-97.
- Naka A, Mukherjee TK, Tufte D. Microeconomic Variables and the Performance of the Indian Stock Market, Working Paper 1998-06, University of New Orleans, New Orleans, 2001, pp. 1-32. Available at:https://pdfs.semanticscholar.org/943b/2447491ec05a01 9520e8f13f66fb2ebd0c45.pdf.
- Hojatallah G, Ramanarayana CS. Empirical Analysis of the impact of Foreign Institutional Investment on the Indian Stock Market Volatility during World Financial Crisis, International Journal Economics of and Finance. 2011; 3:214-226.
- Hosseini MA. The Role of Macroeconomic Variables on Stock Market Index in China and India, International Journal of Economics and Finance. 2011; 3:233-243.
- Patel S. The Effect of Macroeconomic Determinants on the performance of the Indian Stock Market, NMIMS Management Review. 2012; 22:117-127.
- Tripathy N. Casual Relationship between MacroEconomic Indicators and Stock Market in India, Asian Journal of Finance & Accounting. 2011; 3:208-226.
- Pethe A, Karnik A. Do Indian Stock Markets matter? Stock Market Indices and Macro-Economic Variables, Economic and Political Weekly. 2000; 35:349-356.
- Joshi P. Relationship between Macroeconomic Variables and Stock Market Development: Evidence from Indian Economy, Thesis, BITS-Pilani, 2015.
- Barakat MR, Elgazzar SH, Hanafy KM. Impact of Macroeconomic variables on Stock Market: Evidence from Emerging Markets, International Journal of Economics and Finance. 2016; 8(1):195-207.
- Garg K, Kalra R. Impact of Macroeconomic Factors on Indian Stock Market, Parikalpana-KIIT Journal of Management, 2018, pp. 134-145.
- Joseph NL, Vezos P. The sensitivity of US banks to stock returns to interest rates & exchange rates changes, Managerial Finance. 2006; 32:182-199.
- Gunasekarage A, Pisedtasalasai A, Power DM. Macroeconomic Influence on the Stock Market: Evidence from an Emerging Market in South Asia, Journal of Emerging Market Finance. 2004; 3(3):285-304.
- Adam MA, Tweneboah G. Foreign Direct Investment and Stock Market Development: Ghana's Evidence, International Research Journal of Finance and Economics. 2009; 26:178-185.
- Osamwonyi IO, Evbayiro-Osagie EL. The Relationship between Macroeconomic Variables and Stock Market Index in Nigeria, Journal of Economics. 2012; 3(1):5563.
- Vejzagic M, Zarafat H. Relationship between Macroeconomic Variables and Stock Market Index: Cointegration Evidence from FTSE Bursa Malaysia Hijrah Shariah Index, Asian Journal of Management Sciences & Education. 2013; 2(4):94-108.
- Pearce DK, Roley VV. Stock Prices and Economic News, Journal of Business. 1985; 58(1):49-67.
- Talla JT. Impact of Macroeconomic Variables on the Stock Market Prices of the Stockholm Stock Exchange (OMXS30), Thesis, 2013, pp. 1-48. Available at: http://www.divaportal.org/smash/get/diva2:630705/FULLTEXT02.
- Reilly F, Brown K. Investment analysis and portfolio management,7th edition, South-Western Cengage Learning, Mason Ohio, USA, 2003.
- Walter J. Monetary aggregates: A user's guide, FRB Richmond Economic Review. 1989; 75(1):20-28.
- Kumar R. The Effect of Macroeconomic Factors in Indian Stock Market Performance: A Factor analysis approach, IOSR Journal of Economics and Finance (IOSR-JEF). 2013; 1(3):14-21.
- Schewart GW. The Adjustment of Stock Prices to Information about Inflation, the Journal of Finance. 1981; 36(1):15-29.
- Jain PC. Response of hourly stock prices and trading volume to economic news, Journal of Business. 1988; 61:219-231.
- Chen NF, Roll R, Ross SA. Economic forces and the stock market, Journal of business. 1986; 59(3):383-403.
- Smirlock M, Yawitz J. Asset returns, discount rate changes, and market efficiency, The Journal of Finance. 1985; 40(4):1141-1158.
- Rafique A et al., Impact of Macroeconomic Variables on Stock Market Index (A Case of Pakistan), Elixir Finance Management. 2013; 57:14099-14104.
- Oaikhena HE, Fiscal Deficit. Money Stock and the behaviour of Stock Prices in Nigeria: An empirical Investigation, Journal of Financial Management and Analysis. 2002; 1(1&2):10-27.
- Chandra P. Investment Analysis and Portfolio Management, McGraw-Hill Publication, New Delhi, 2004.
- Amadi SN, Odubo TD. Macroeconomic variables and stock prices: Causality analysis, The Nigeria Journal of Economic and Management Studies. 2002; 4(1&2):2941.
- Fama EF. Stock returns, real activity, inflation, and money, The American Economic Review. 1981; 71:545565.
- Kelvin S. Portfolio Management, Percentice Hill Publication, New Delhi, 2000.
- Alam MN, Uddin MGS. Relationship between interest rate and stock price: Empirical evidence from developed and developing countries, International journal of business and management. 2009; 4(3):43-51.
- Feldstein MS, Inflation, tax rules, and investment: Some econometric evidence, Econometrica. 1980; 50(4):825862.
- Hong H. Inflation and the market value of the firm: Theory and tests, The Journal of Finance. 1977; 32(4):1031-1048.
- Levin RI, David SR. Multiple Regression and Modelling: Statistics for Management, Pearson Education, India, 2005.
- Field A. Discovering Statistics Using IBM SPSS Statistics, Sage Publication, London, 2013.
Cited by 1
From OpenAlex, OpenCitations and reference lists read by Scinovex
- Dynamic Trends and Predictive Modelling of Stock Market Indices: A Comprehensive Analysis of S&P Bse Oil & Gas Index and Sensex Over 2020-2023 ↗
Sohom Majumder, Uttiya Kar, Vivekananda Biswas · SSRN Electronic Journal · 2024
❝ 0PDF